Products
SentimenTrader Trading Tools
‍
Backtest Engine
My Trading Toolkit
Correlation Analysis
Seasonality
Market Prediction
Indicators & Data API
‍
Proprietary Indicators & Charts
Market Data API
Strategies & Scanner
‍
50+ Trading Strategies
Smart Stock Scanner
Smart Option Scanner
Research Reports
‍
Research Solutions
Reports Library
Free Resources
Simple Backtest Calculator
Simple Seasonality Calculator
The Kelly Criterion Calculator
Sentiment Geo Map
Public Research Reports
Education
Sentiment Indicators
Technical Indicators
Pricing
Company
About
In the News
Testimonials
Client Success Stories
Contact
Log inLoginSign up
< BACK TO ALL REPORTS

This Bollinger band signal suggests higher prices for Korean stocks

Dean Christians
2021-12-07
A Bollinger band mean reversion signal for the KOSPI index issued an alert at the close of trading on Monday. The new signal suggests strong medium-term gains.

Key points:

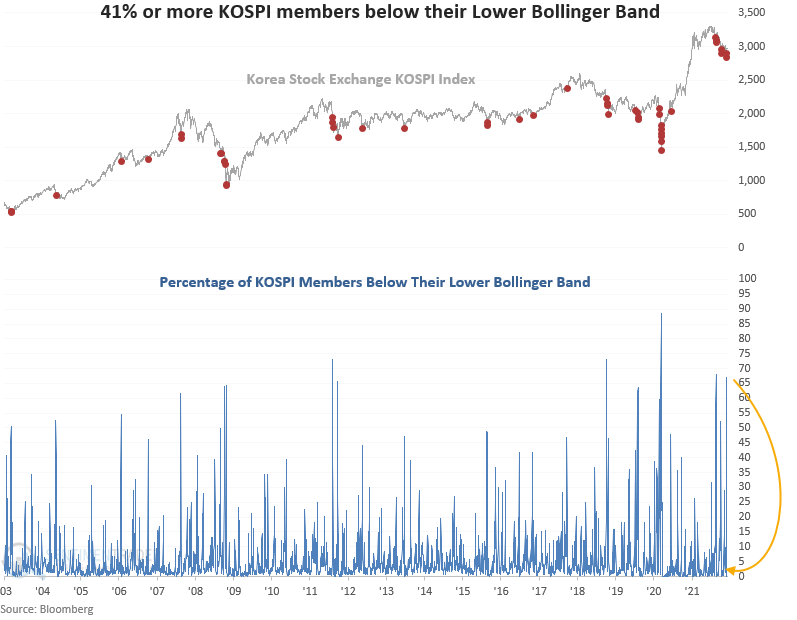
  • The percentage of KOSPI index members below their lower Bollinger band surged above 67%
  • Members have now reversed lower with fewer than 1% below their lower band
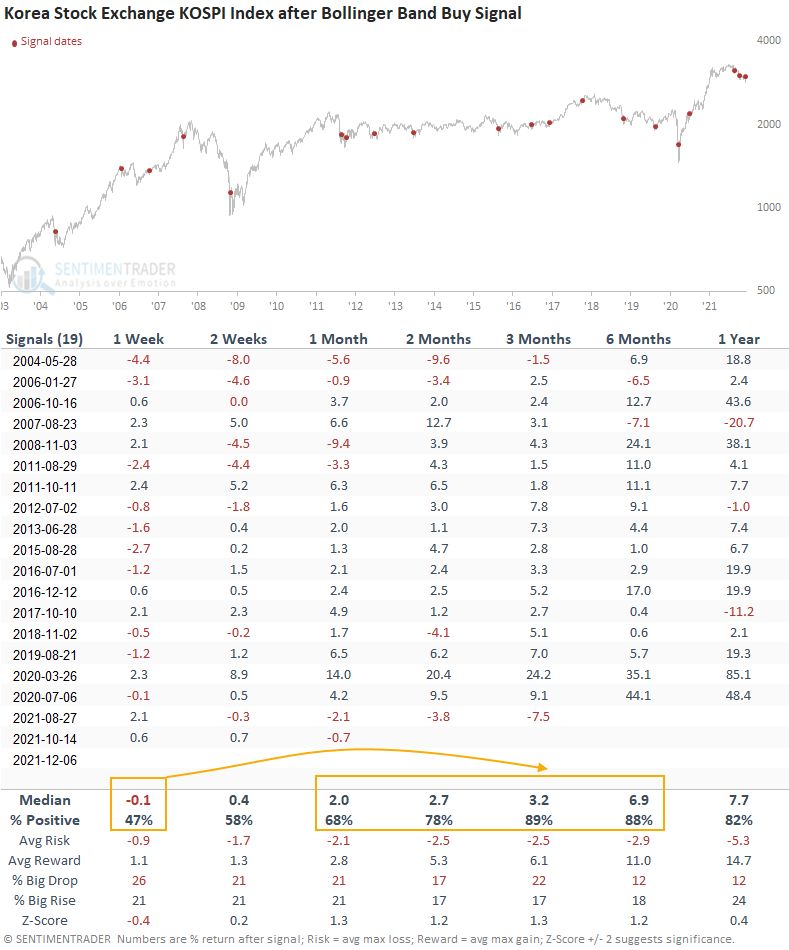
  • The KOSPI rallied 89% of the time over the next 3 months after other signals

A breadth-based model for identifying oversold mean reversion opportunities

A new signal from a mean reversion model that utilizes the percentage of KOSPI index members below their lower Bollinger band registered an alert on Monday. 

The Bollinger band signal identifies when the percentage of index members trading below their lower Bollinger band cycles from a high to a low level. At the same time, KOSPI momentum must be positive.

The percentage of KOSPI members below their lower Bollinger band recently increased to the 7th highest level in history.

Similar signals preceded consistent gains on a medium-term basis

This signal has triggered 19 other times over the past 18 years. After the others, future returns and win rates were good on medium-term time frames. Consistency was especially good in the 3-month time frame, with 17 out of 19 winners. The 1-week results suggest we should be mindful of a short-term pause.

Returns for a USD-based South Korea ETF

The medium-term results and risk/reward profile look solid for the South Korea ETF (EWY). However, as was the case with the KOSPI results, one should be mindful of a potential pullback in the next week. 

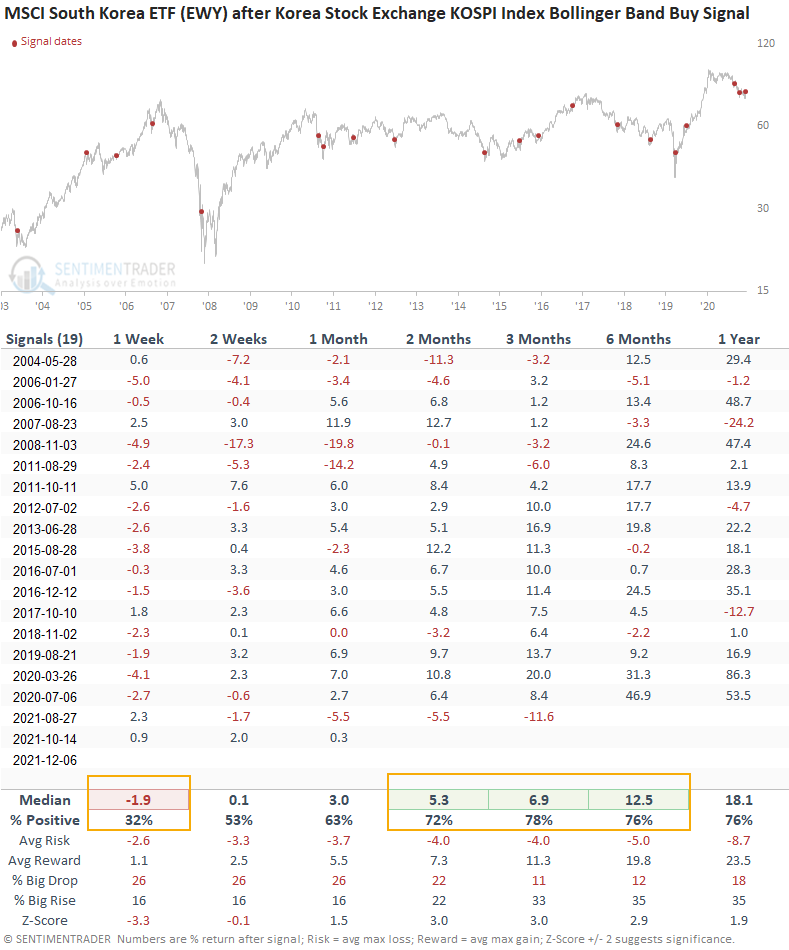
What the research tells us...

When the percentage of members below their lower Bollinger band cycles from a high to a low level, an oversold mean reversion opportunity looks favorable. Similar setups to what we're seeing now have preceded consistent gains on a medium-term basis with an 89% win rate 3 months later. Suppose we apply the signals to a USD-based ETF. In that case, we see solid gains and more favorable risk/reward profiles on a medium-term basis.

PRODUCTS
SentimenTrader
Trading Tools
Indicators & Data API
‍
Strategies & Scanner
‍
Research Reports
FREE
RESOUrCES
Simple Backtest
Calculator
Simple Seasonality
Calculator
The Kelly Criterion
Calculator
Sentiment Geo Map
‍
Public Research Reports
‍
Education
Sentiment Indicators
‍
Technical Indicators
‍
Pricing
Bundle pricing
‍
FAQ
‍
Announcements
‍
COMPANY
‍
About
‍
In the News
‍
Testimonials
‍
Client Success Stories
CONTACT
‍
General Inquiries
‍
Media Inquiries
‍
Financial Professionals Inquiries
‍
© 2026 Sundial Capital Research Inc. All rights reserved.
Setsail Marketing
TermsPrivacyAffiliate Program
Risk Disclosure: The information and tools provided are for research and analytical purposes only and are not intended as investment advice. Market analysis involves uncertainty, and outcomes may differ from expectations. Users should conduct their own due diligence and consider their individual circumstances before making any financial decisions. Past performance is not necessarily indicative of future results.

Hypothetical Performance Disclosure: Hypothetical performance results have many inherent limitations, some of which are described below. No representation is being made that any account will or is likely to achieve profits or losses similar to those shown; in fact, there are frequently sharp differences between hypothetical performance results and the actual results subsequently achieved by any particular trading program. One of the limitations of hypothetical performance results is that they are generally prepared with the benefit of hindsight. In addition, hypothetical trading does not involve financial risk, and no hypothetical trading record can completely account for the impact of financial risk of actual trading. for example, the ability to withstand losses or to adhere to a particular trading program in spite of trading losses are material points which can also adversely affect actual trading results. There are numerous other factors related to the markets in general or to the implementation of any specific trading program which cannot be fully accounted for in the preparation of hypothetical performance results and all which can adversely affect trading results.

Testimonial Disclosure: Testimonials appearing on this website may not be representative of other clients or customers and is not a guarantee of future performance or success.