
This Bollinger band model suggests higher stock prices

Key points:
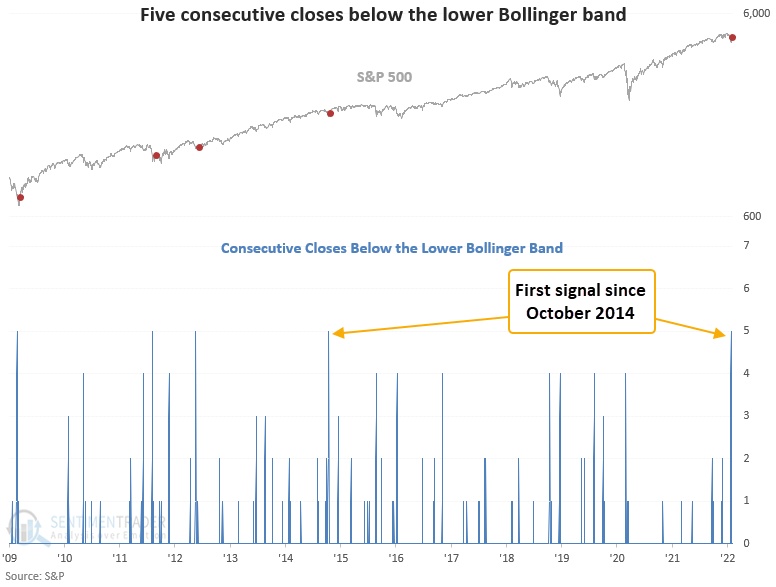
- The S&P 500 closed below its lower Bollinger band for 5 consecutive days
- On Wednesday, the index closed above the Bollinger band midline
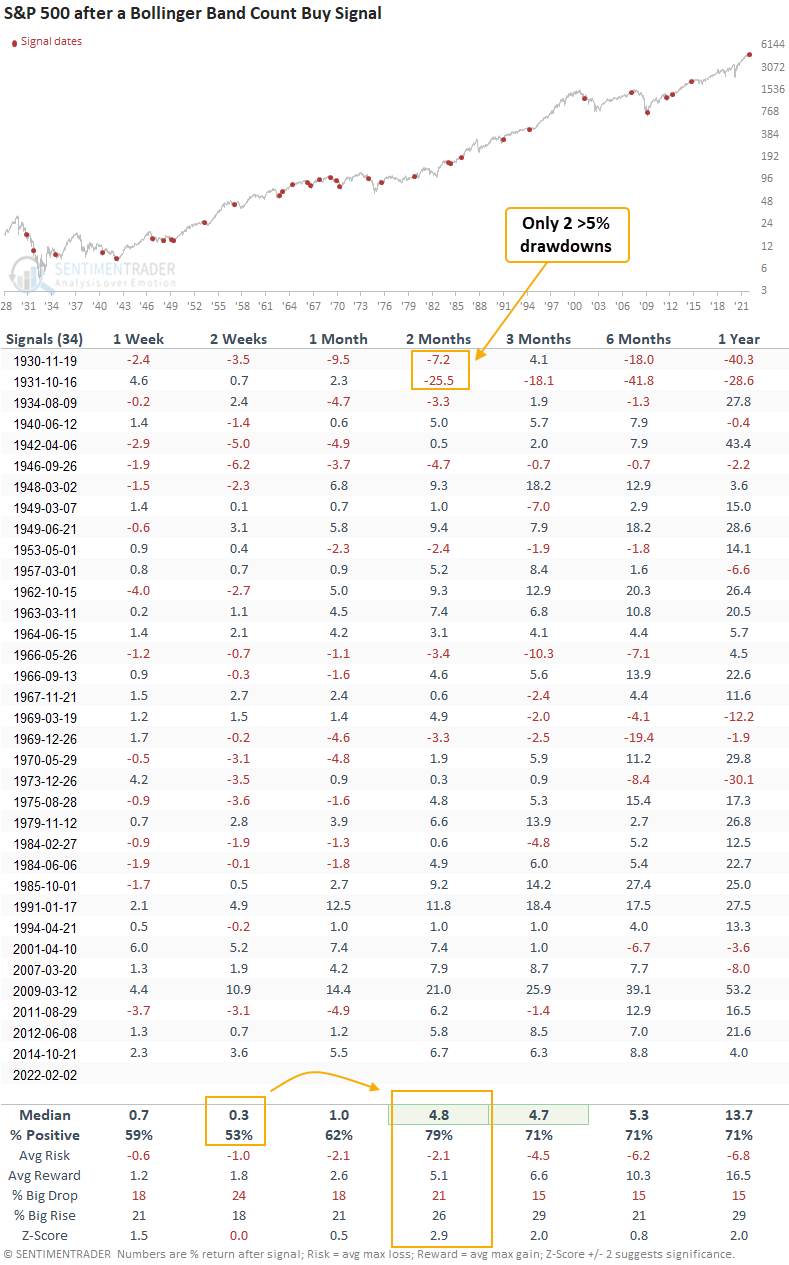
- Similar signals preceded positive returns 79% of the time 2 months later
A Bollinger band trading model that identifies a low volatility capitulation reversal
A new signal from a voting member in the TCTM Composite Washout Model registered an alert at the close of trading on Wednesday. The component is called the Bollinger Band Count Model.
The Bollinger Band signal identifies when the price of a stock, index, or ETF closes below the lower Bollinger band for five consecutive days and reverses higher to close above the midline. Signals can only occur if the percentage spread between the upper and lower Bollinger band is below a user-defined level. i.e., I want to avoid instances when volatility is extremely high.
Similar signals have preceded gains 79% of the time
This signal triggered 34 other times over the past 92 years. After the others, S&P 500 future returns and win rates were solid across almost all time frames, especially the 2-month window. The 1946 and 1966 signals are the only instances that showed negative returns across all time frames when looking forward by 3 months. Because the Bollinger band model attempts to identify extreme downside price action near a low, one should expect choppy conditions in the near term.
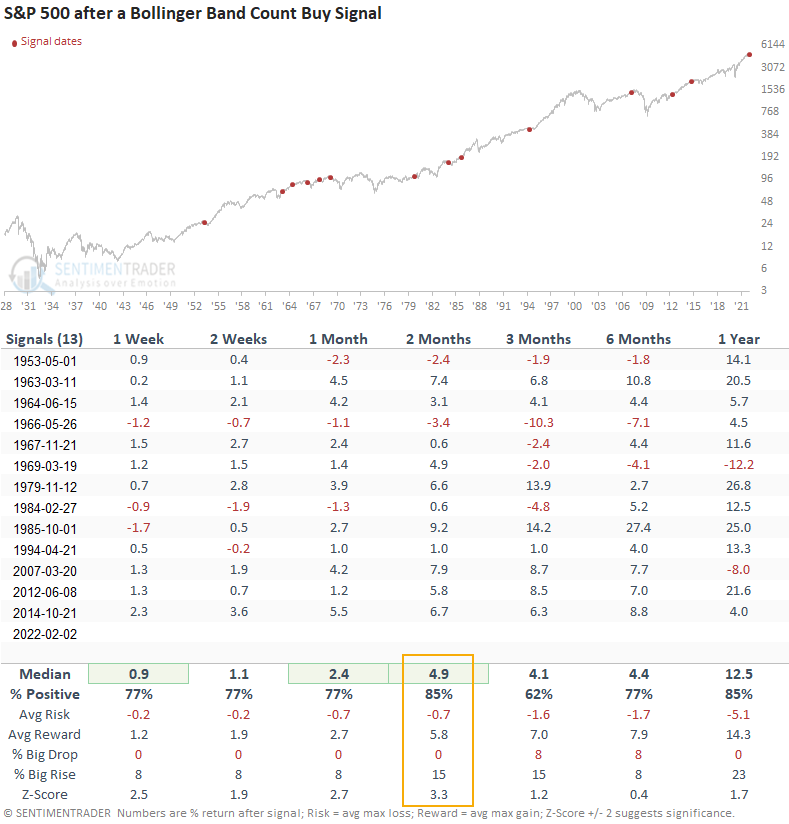
Signals that occur when the S&P 500 is down 10% or less from a high
When a signal occurs with the S&P 500 down 10% or less, returns, win rates, and risk/reward profiles look even better, especially in the near term. Once again, 1966 is the only signal that didn't show a profit at some point when looking forward 3 months.
What the research tells us...
When the S&P 500 closes below its lower Bollinger band for 5 consecutive days and reverses higher to close above the BB midline, a period of extreme adverse price action has decreased. Similar setups to what we're seeing now have preceded solid returns and win rates, especially on a 2-month basis. The outlook appears even more compelling when a signal occurs with the S&P 500 down 10% or less.
Even though we've seen some bullish reversal signals and an improvement in sentiment that is more than likely to provide a tailwind, the market environment remains unstable. Historically, breadth thrusts are among the best indicators to monitor for a signal that would suggest a change in character. So far, panic buying that triggers a thrust signal has been absent.