Products
SentimenTrader Trading Tools
‍
Backtest Engine
My Trading Toolkit
Correlation Analysis
Seasonality
Market Prediction
Indicators & Data API
‍
Proprietary Indicators & Charts
Market Data API
Strategies & Scanner
‍
50+ Trading Strategies
Smart Stock Scanner
Smart Option Scanner
Research Reports
‍
Research Solutions
Reports Library
Free Resources
Simple Backtest Calculator
Simple Seasonality Calculator
The Kelly Criterion Calculator
Sentiment Geo Map
Public Research Reports
Education
Sentiment Indicators
Technical Indicators
Pricing
Company
About
In the News
Testimonials
Client Success Stories
Contact
Log inLoginSign up
< BACK TO ALL REPORTS

The yield curve says, "Don't worry"

Jason Goepfert
2022-03-25
The average Treasury yield curve is far from inversion, suggesting a low probability of imminent recession. High yield (junk) bonds are heavily oversold.

The average yield curve is far from inversion

In early 2019, investors were becoming increasingly concerned about yield curve inversions. As we saw at the time, inversions across the curve were spiking, with several short-term maturities yielding more than longer-term maturities. Using 55 different combinations of Treasury yields from 11 different maturities, more than half of the curves were inverted.

Headlines are stuffed once again with concerns about yield curves. But fewer than 10% of the combinations are currently inverted.

The chart below shows the median spread between the different combinations. This dipped below zero before every recession in the past 60 years. It's still well above that point now; as of Wednesday, the median spread was in the top 29% of all readings since 1962. Since 1982, it's still well above the top half of all days.

Median yield curve across Treasury maturities

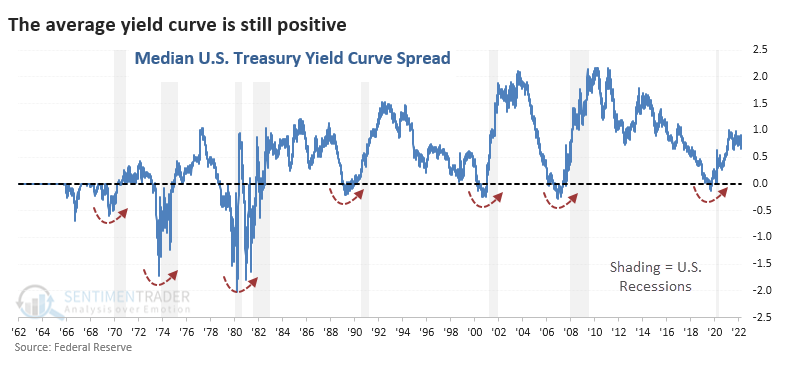
Based on where we are now relative to all other days, there's a very low probability that the U.S. would be in a recession across any time frame.

Junk bonds have been acting just like their name

High yield bonds are debt securities issued by companies with lower-quality credit. To attract buyers, these companies pay a higher interest rate on these bonds. As long as the company does not default on the principal or interest payments, these bonds' above-average returns are typically attractive to income-oriented investors.

Because the financial fortunes of the underlying company are so important, the performance of high-yield debt is typically more highly correlated to the stock market than to straight bonds. The overall state of the economy generally has more influence over the action of the high-yield bond sector than fluctuations in interest rates - although large swings in interest rates can still have significant influence.

With the decline in the stock market during the first quarter of 2022, combined with weakness in the overall bond market, the high yield bond sector took it on the chin. 

The chart below highlights with a red dot those days when the High-yield McClellan Summation Index was below -800. Note that this is an infrequent occurrence, and as such, we are dealing with an admittedly small sample size.

High yield junk bond market McClellan Summation Index

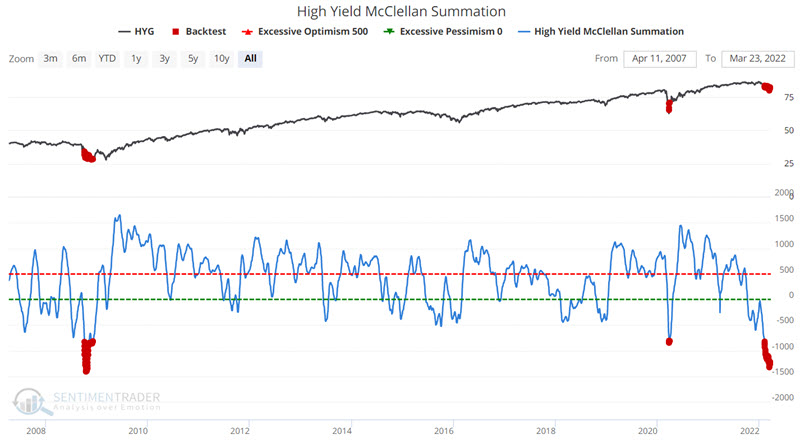
Other indicators are showing similar long-term washouts in these bonds.

PRODUCTS
SentimenTrader
Trading Tools
Indicators & Data API
‍
Strategies & Scanner
‍
Research Reports
FREE
RESOUrCES
Simple Backtest
Calculator
Simple Seasonality
Calculator
The Kelly Criterion
Calculator
Sentiment Geo Map
‍
Public Research Reports
‍
Education
Sentiment Indicators
‍
Technical Indicators
‍
Pricing
Bundle pricing
‍
FAQ
‍
Announcements
‍
COMPANY
‍
About
‍
In the News
‍
Testimonials
‍
Client Success Stories
CONTACT
‍
General Inquiries
‍
Media Inquiries
‍
Financial Professionals Inquiries
‍
© 2026 Sundial Capital Research Inc. All rights reserved.
Setsail Marketing
TermsPrivacyAffiliate Program
Risk Disclosure: The information and tools provided are for research and analytical purposes only and are not intended as investment advice. Market analysis involves uncertainty, and outcomes may differ from expectations. Users should conduct their own due diligence and consider their individual circumstances before making any financial decisions. Past performance is not necessarily indicative of future results.

Hypothetical Performance Disclosure: Hypothetical performance results have many inherent limitations, some of which are described below. No representation is being made that any account will or is likely to achieve profits or losses similar to those shown; in fact, there are frequently sharp differences between hypothetical performance results and the actual results subsequently achieved by any particular trading program. One of the limitations of hypothetical performance results is that they are generally prepared with the benefit of hindsight. In addition, hypothetical trading does not involve financial risk, and no hypothetical trading record can completely account for the impact of financial risk of actual trading. for example, the ability to withstand losses or to adhere to a particular trading program in spite of trading losses are material points which can also adversely affect actual trading results. There are numerous other factors related to the markets in general or to the implementation of any specific trading program which cannot be fully accounted for in the preparation of hypothetical performance results and all which can adversely affect trading results.

Testimonial Disclosure: Testimonials appearing on this website may not be representative of other clients or customers and is not a guarantee of future performance or success.