Products
SentimenTrader Trading Tools
‍
Backtest Engine
My Trading Toolkit
Correlation Analysis
Seasonality
Market Prediction
Indicators & Data API
‍
Proprietary Indicators & Charts
Market Data API
Strategies & Scanner
‍
50+ Trading Strategies
Smart Stock Scanner
Smart Option Scanner
Research Reports
‍
Research Solutions
Reports Library
Free Resources
Simple Backtest Calculator
Simple Seasonality Calculator
The Kelly Criterion Calculator
Sentiment Geo Map
Public Research Reports
Education
Sentiment Indicators
Technical Indicators
Pricing
Company
About
In the News
Testimonials
Client Success Stories
Contact
Log inLoginSign up
< BACK TO ALL REPORTS

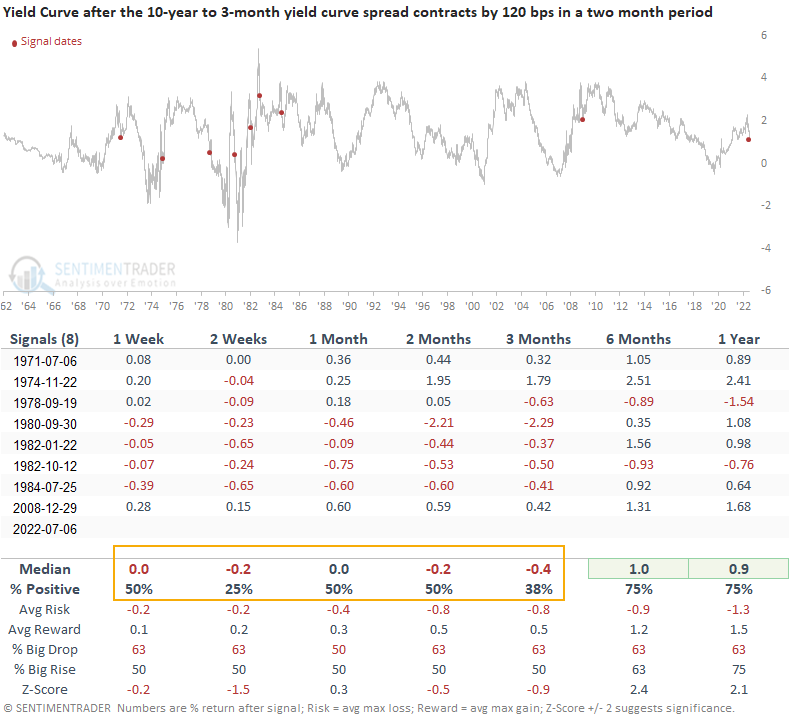
The yield curve is crashing

Dean Christians
2022-07-07
For the first time since the GFC and the 15th time since 1971, the 2-month net change for the yield curve spread has fallen by over 120 bps. Using history as a guide, let's assess the outlook for stocks, commodities, and the yield curve.

Key points:

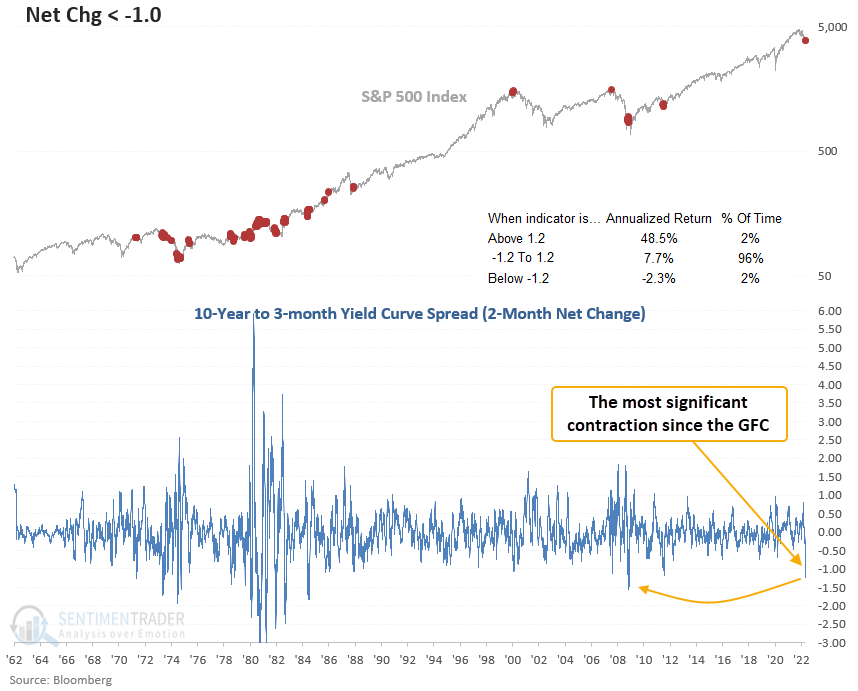
  • The 10-year to 3-month treasury yield curve spread has contracted by a significant amount
  • When I measure the net change over the trailing 2 months, it shows a decline of 123 basis points
  • After similar signals, stocks show flat to slightly negative returns in the 1-2 month time frame
  • Commodities and the yield curve tend to decline in the weeks/months following a signal

What happens when the 10-year to 3-Month yield curve contracts by a significant amount

Let's conduct a study to assess the outlook for stocks, commodities, and the yield curve when the 2-month net change for the yield curve spread declines by 120 basis points. I will use a reset that requires the net change to cross above 0% to screen out repeats.

For the first time since the GFC and the 15th time since 1971, the 2-month net change for the yield curve spread has fallen by over 120 bps. Significant contractions of this magnitude have been rare in the last 3 decades. However, they were more prevalent during the inflationary 1970-80 period.

Similar signals preceded flat to negative returns for stocks

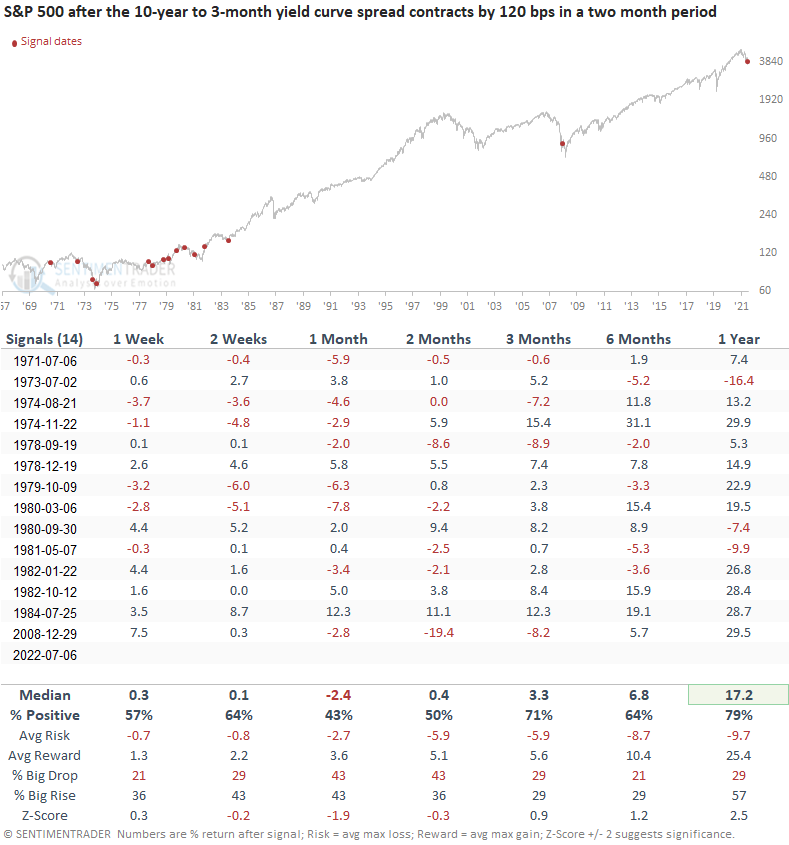
This study generated a signal 14 other times over the past 51 years. After the others, the S&P 500 tends to struggle in the 1 & 2-month time frames. The 3-12 month windows look better, especially the 1-year stats.

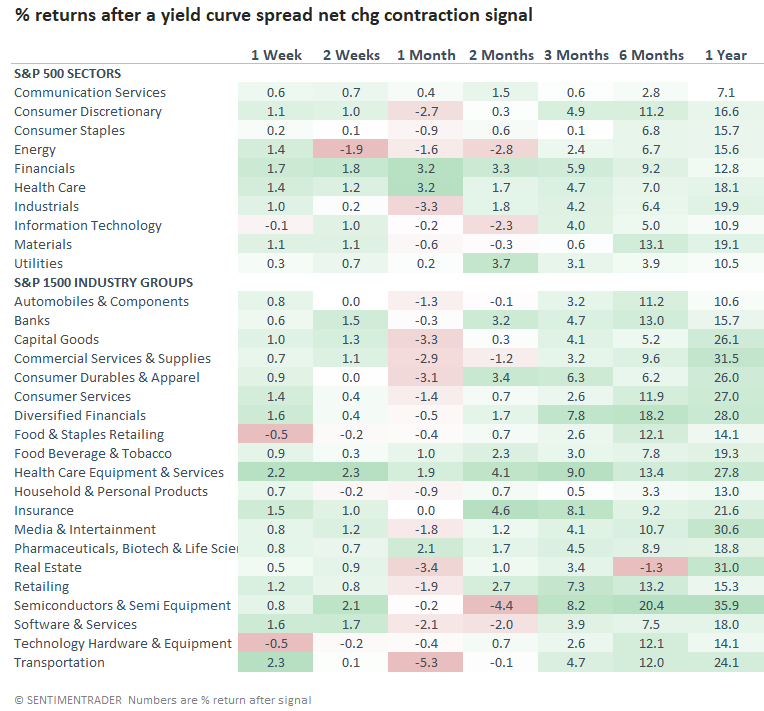
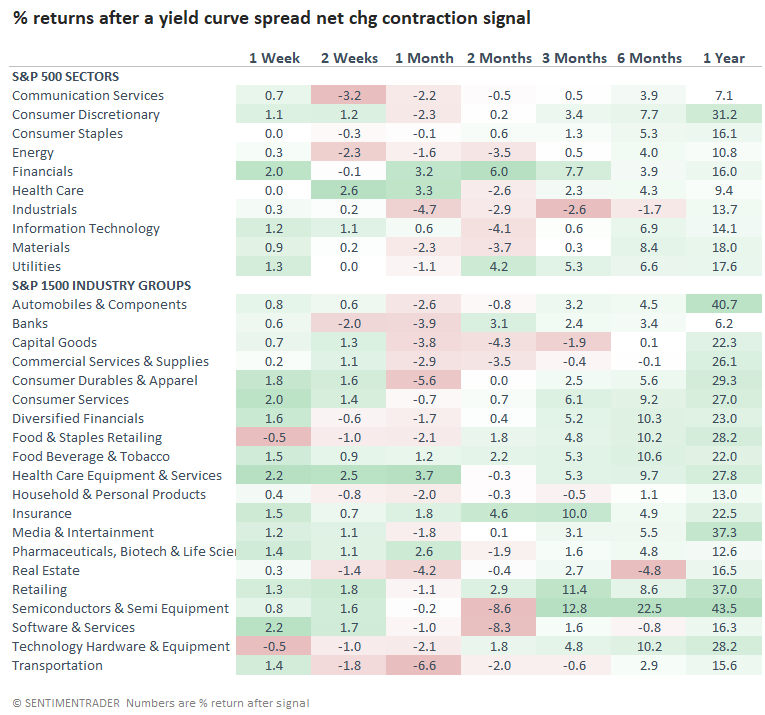
Not surprisingly,  a collapse in the yield curve impacts cyclical sectors and industry groups the most. From a defensive standpoint, health care looks the best.

If I isolate signals that occurred in an equity bear market, which is the case now, the stats look a little worse, with negative returns in the 1 & 2-month time frames.

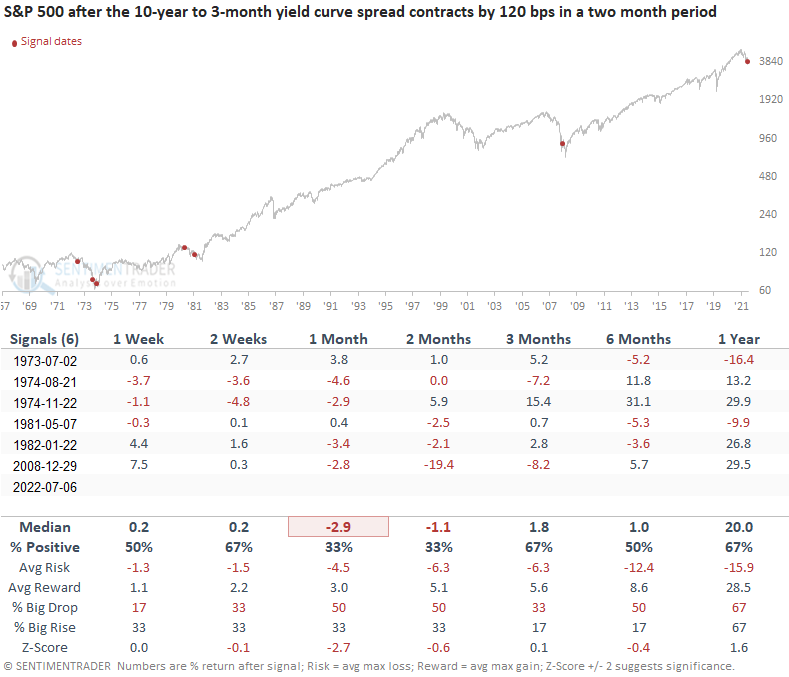
Once again, the bear market signals look unfavorable in the 1 & 2-month time frames across most sectors and industries. Interestingly, financials are one of the betters groups.

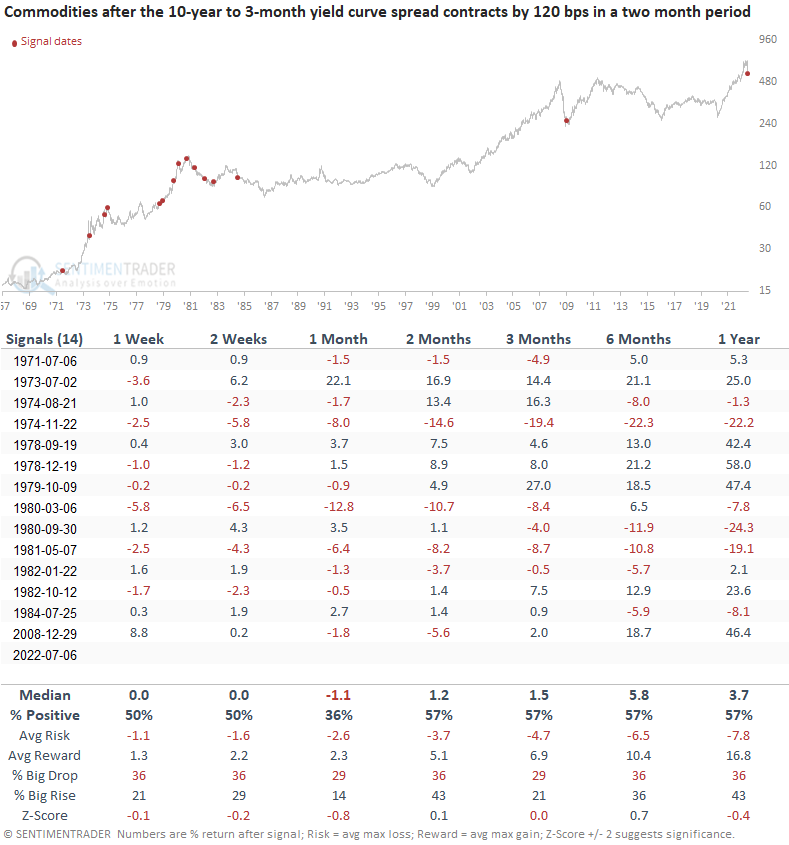
What happens to commodities after yield curve signals

Commodity performance is flat to slightly negative in the first month. A yield curve crash signal shows a loss in 11 out of 14 cases at some point in the first three months.

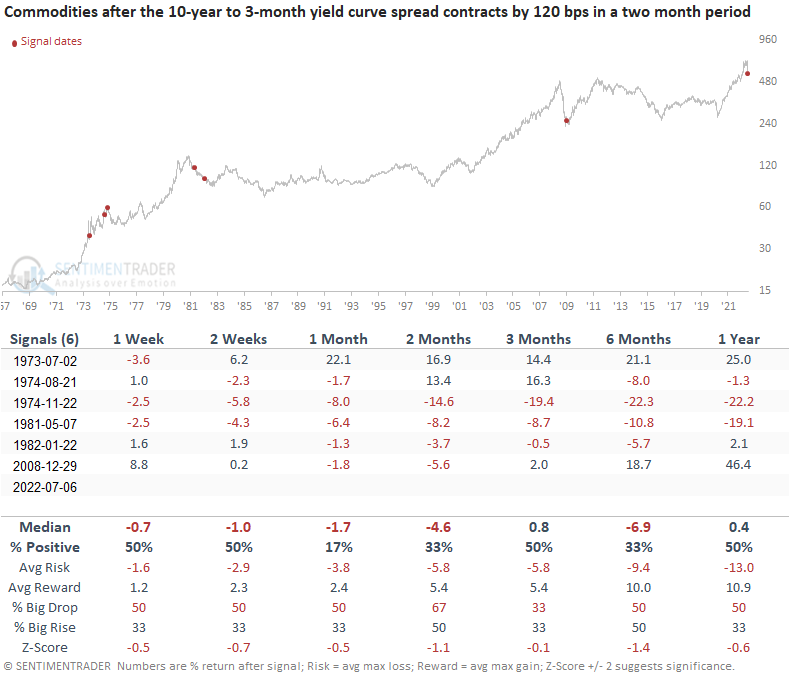
Commodity performance looks significantly worse when the stock market is in a bear market.

What happens to the yield curve after signals

The yield curve shows a tendency to decline further in the near term. However, the 6 and 12-month time frames suggest the curve could steepen.

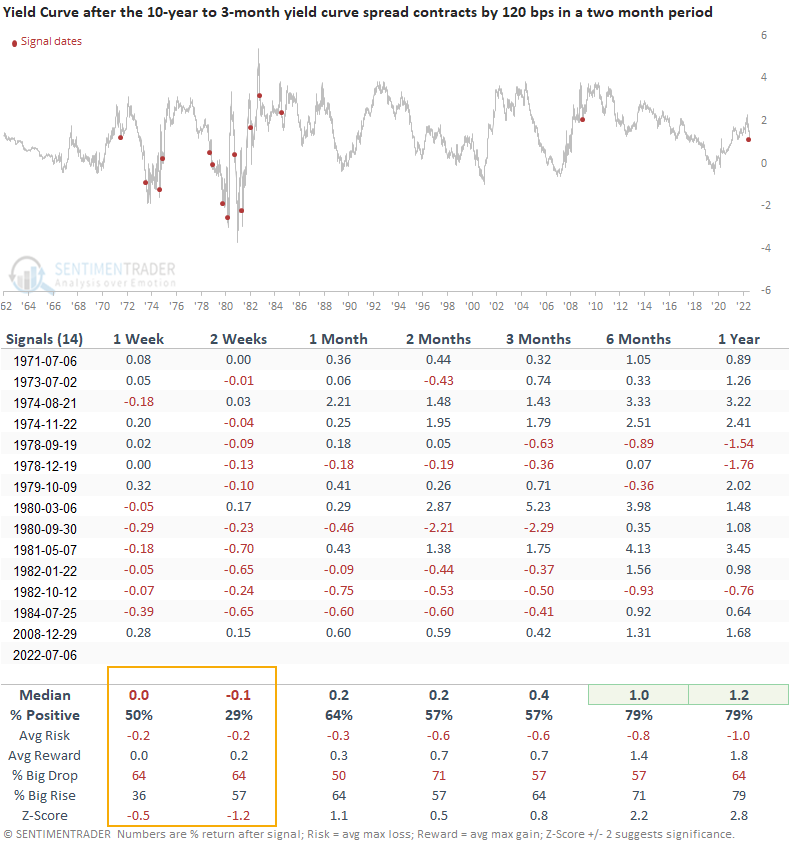
Let's add some context to the yield curve table. I will now isolate signals that occurred when the 10-year to 3-month spread was positive. When a 2-month net change signal occurs, and the spread is positive, the yield curve tends to collapse further over the next 3 months.

What the research tells us...

When the 2-month net change for the yield curve spread declines by 120 basis points or more, the downward shift in the curve typically signals a potential softening in economic activity. Similar setups to what we're seeing now have preceded flat to negative returns for stocks and commodities in the 1 & 2-month time frames. Bear market instances look worse for both groups, especially commodities. Applying the signals to the yield curve suggests the curve could contract further, especially in cases with a positive slope, like now.

PRODUCTS
SentimenTrader
Trading Tools
Indicators & Data API
‍
Strategies & Scanner
‍
Research Reports
FREE
RESOUrCES
Simple Backtest
Calculator
Simple Seasonality
Calculator
The Kelly Criterion
Calculator
Sentiment Geo Map
‍
Public Research Reports
‍
Education
Sentiment Indicators
‍
Technical Indicators
‍
Pricing
Bundle pricing
‍
FAQ
‍
Announcements
‍
COMPANY
‍
About
‍
In the News
‍
Testimonials
‍
Client Success Stories
CONTACT
‍
General Inquiries
‍
Media Inquiries
‍
Financial Professionals Inquiries
‍
© 2026 Sundial Capital Research Inc. All rights reserved.
Setsail Marketing
TermsPrivacyAffiliate Program
Risk Disclosure: The information and tools provided are for research and analytical purposes only and are not intended as investment advice. Market analysis involves uncertainty, and outcomes may differ from expectations. Users should conduct their own due diligence and consider their individual circumstances before making any financial decisions. Past performance is not necessarily indicative of future results.

Hypothetical Performance Disclosure: Hypothetical performance results have many inherent limitations, some of which are described below. No representation is being made that any account will or is likely to achieve profits or losses similar to those shown; in fact, there are frequently sharp differences between hypothetical performance results and the actual results subsequently achieved by any particular trading program. One of the limitations of hypothetical performance results is that they are generally prepared with the benefit of hindsight. In addition, hypothetical trading does not involve financial risk, and no hypothetical trading record can completely account for the impact of financial risk of actual trading. for example, the ability to withstand losses or to adhere to a particular trading program in spite of trading losses are material points which can also adversely affect actual trading results. There are numerous other factors related to the markets in general or to the implementation of any specific trading program which cannot be fully accounted for in the preparation of hypothetical performance results and all which can adversely affect trading results.

Testimonial Disclosure: Testimonials appearing on this website may not be representative of other clients or customers and is not a guarantee of future performance or success.