Products
SentimenTrader Trading Tools
‍
Backtest Engine
My Trading Toolkit
Correlation Analysis
Seasonality
Market Prediction
Indicators & Data API
‍
Proprietary Indicators & Charts
Market Data API
Strategies & Scanner
‍
50+ Trading Strategies
Smart Stock Scanner
Smart Option Scanner
Research Reports
‍
Research Solutions
Reports Library
Free Resources
Simple Backtest Calculator
Simple Seasonality Calculator
The Kelly Criterion Calculator
Sentiment Geo Map
Public Research Reports
Education
Sentiment Indicators
Technical Indicators
Pricing
Company
About
In the News
Testimonials
Client Success Stories
Contact
Log inLoginSign up
< BACK TO ALL REPORTS

The worst bout of selling in S&P history

Jason Goepfert
2022-06-17
Over the past 7 sessions, investors in the most benchmarked index in the world, the S&P 500, have suffered the most lopsided selling pressure since 1928. Positive trends in the index are almost nonexistent. About the only positive factor is that selling on this level has tended to be exhaustive.

Key points:

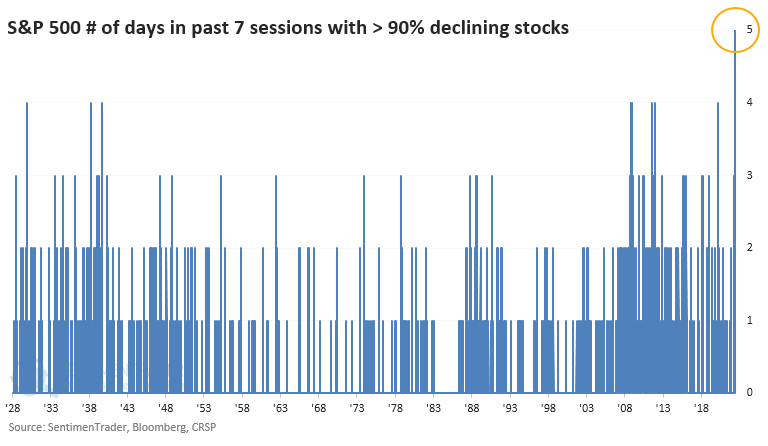
  • Over the past 7 sessions, more than 90% of S&P 500 stocks declined 5 times, the most ever
  • Other metrics show a historic level of failed trends within the index
  • Typically, this has preceded multi-week rebounds and positive long-term returns

The worst bout of selling pressure...ever

This has been the worst stretch of selling in the history of the S&P 500. And even before.

The S&P index went to 500 stocks in 1957 and included fewer stocks in the decades prior. In re-creating history, there has never been a rougher 7-day stretch than what the index has suffered leading into Friday's session.

In the past seven sessions, more than 90% of stocks in the index have declined on five days. 

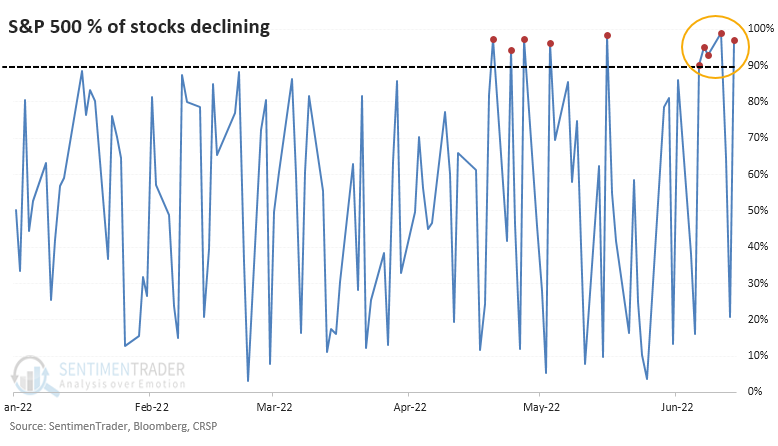
Since 1928, that has never happened before.

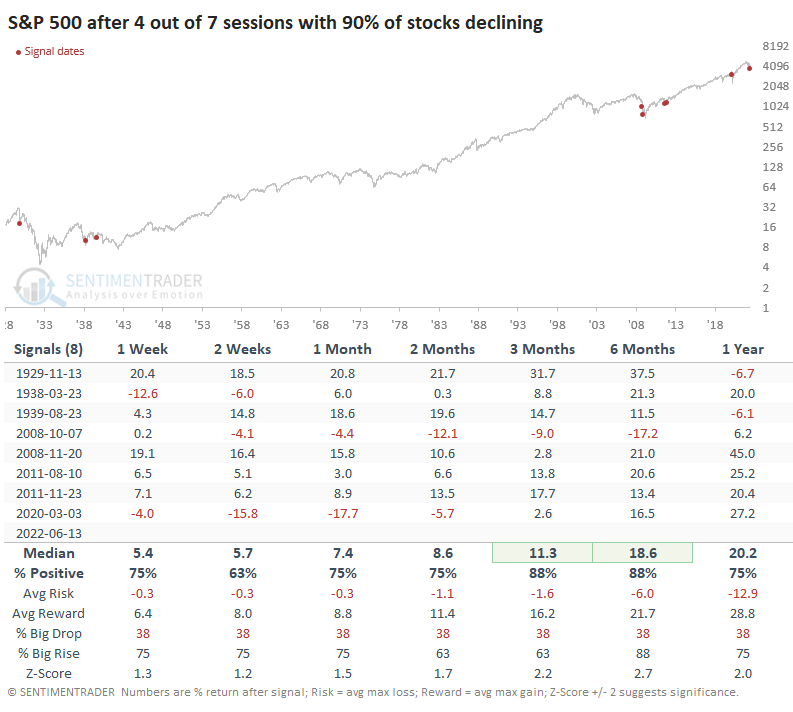
There have been a handful of times when there was a majority of days with more than 90% declining stocks, clustered in the 1930s and post-financial crisis eras. Forward returns were very volatile after these signals, but all preceded a higher price in the S&P 500 6 or 12 months later.

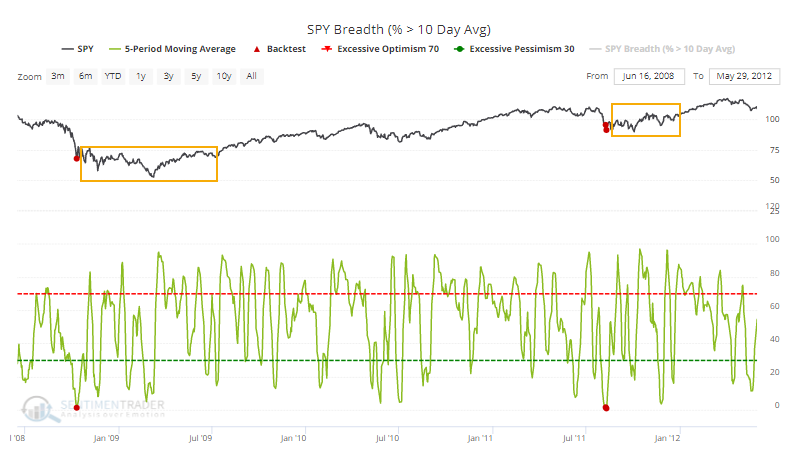
As a result of the persistent and overwhelming selling, there are remarkable extremes in the breadth of trends within the S&P 500. Over the past five days, fewer than 1.6% of stocks in the index have held above their 10-day moving averages. That has been matched only twice before in recent decades.

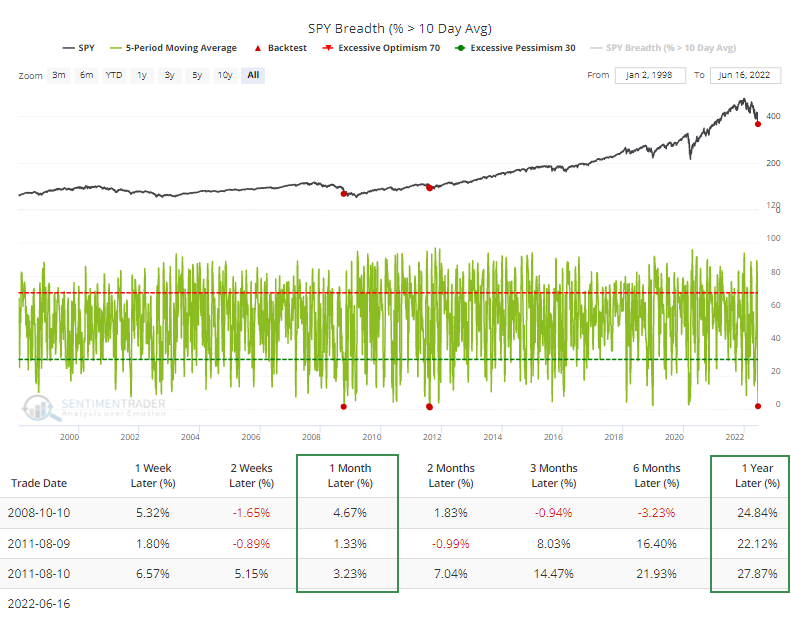
Both endured extremely volatile and choppy conditions for months before experiencing excellent long-term gains.

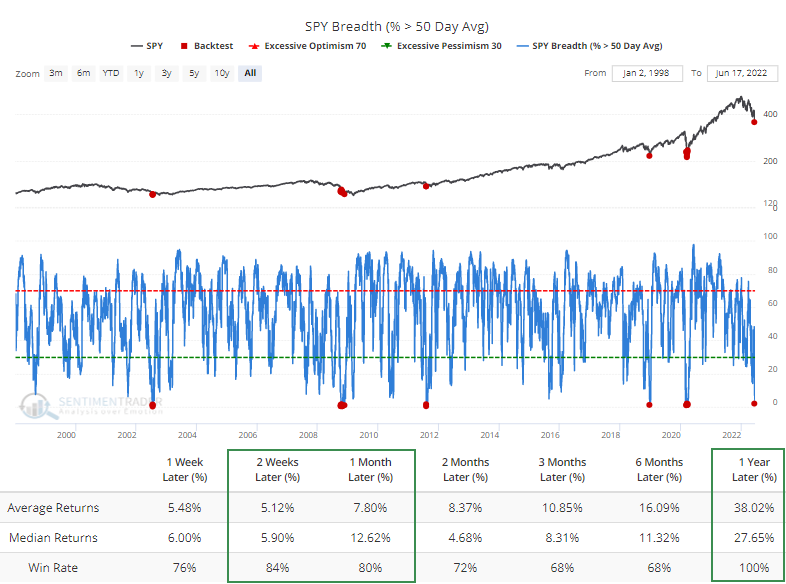
Medium-term trends have also suffered, with fewer than 2% of stocks holding above their 50-day averages. That has happened a handful of times, leading to rebounds over the next 2-4 weeks and longer-term.

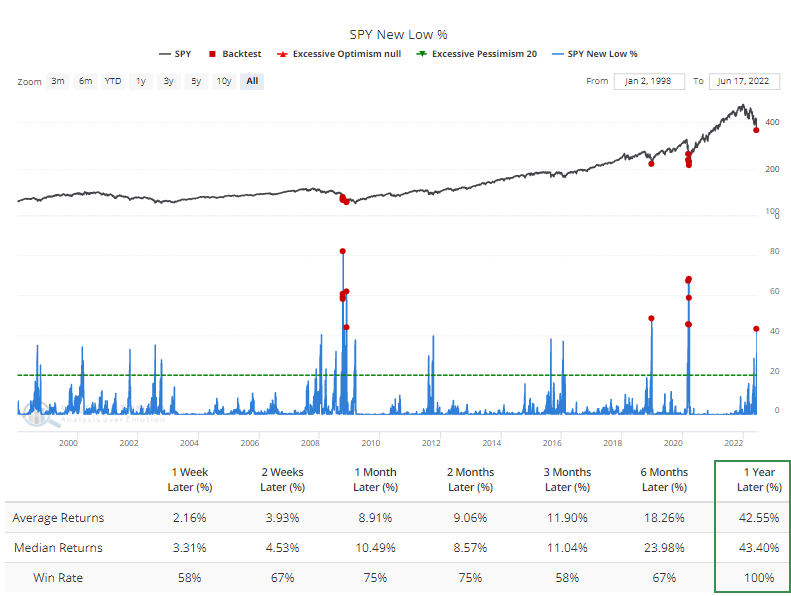
The push lower on Wednesday made investors in many stocks finally capitulate, so more than 43% of stocks in the S&P fell to 52-week lows on the same day. In recent decades, that has been exceeded only by October/November 2008, December 2018, and March 2020.

What the research tells us...

Well, pretty much the same as it has been all week. We are in a bear market, everything is horrible, and there is no sustained interest among buyers. Every bullish setup gets met immediately with a slap upside the head. About the only potential silver lining is just how bad things have become. The level of selling pressure we've seen this week has been rarely - if ever - matched in many decades. One-sided behavior like this has a strong history of being contrarian...but that was also the case in May, and here we are at lower lows. So for new buyers, it seems like patience is a better virtue, and for existing holders, it seems as though it's too late to sell.

PRODUCTS
SentimenTrader
Trading Tools
Indicators & Data API
‍
Strategies & Scanner
‍
Research Reports
FREE
RESOUrCES
Simple Backtest
Calculator
Simple Seasonality
Calculator
The Kelly Criterion
Calculator
Sentiment Geo Map
‍
Public Research Reports
‍
Education
Sentiment Indicators
‍
Technical Indicators
‍
Pricing
Bundle pricing
‍
FAQ
‍
Announcements
‍
COMPANY
‍
About
‍
In the News
‍
Testimonials
‍
Client Success Stories
CONTACT
‍
General Inquiries
‍
Media Inquiries
‍
Financial Professionals Inquiries
‍
© 2026 Sundial Capital Research Inc. All rights reserved.
Setsail Marketing
TermsPrivacyAffiliate Program
Risk Disclosure: The information and tools provided are for research and analytical purposes only and are not intended as investment advice. Market analysis involves uncertainty, and outcomes may differ from expectations. Users should conduct their own due diligence and consider their individual circumstances before making any financial decisions. Past performance is not necessarily indicative of future results.

Hypothetical Performance Disclosure: Hypothetical performance results have many inherent limitations, some of which are described below. No representation is being made that any account will or is likely to achieve profits or losses similar to those shown; in fact, there are frequently sharp differences between hypothetical performance results and the actual results subsequently achieved by any particular trading program. One of the limitations of hypothetical performance results is that they are generally prepared with the benefit of hindsight. In addition, hypothetical trading does not involve financial risk, and no hypothetical trading record can completely account for the impact of financial risk of actual trading. for example, the ability to withstand losses or to adhere to a particular trading program in spite of trading losses are material points which can also adversely affect actual trading results. There are numerous other factors related to the markets in general or to the implementation of any specific trading program which cannot be fully accounted for in the preparation of hypothetical performance results and all which can adversely affect trading results.

Testimonial Disclosure: Testimonials appearing on this website may not be representative of other clients or customers and is not a guarantee of future performance or success.