
The world's most important semiconductor stock regains its momentum

Key points:
- Nvidia (NVDA), the world's largest semiconductor company, triggered a trend score buy signal
- Goldman Sachs (GS), one of the premier global investment banks, triggered a trend score buy signal
- A new indicator that measures relative breadth indicates that technology has the most favorable trends
Two industry-leading stocks regain leadership status
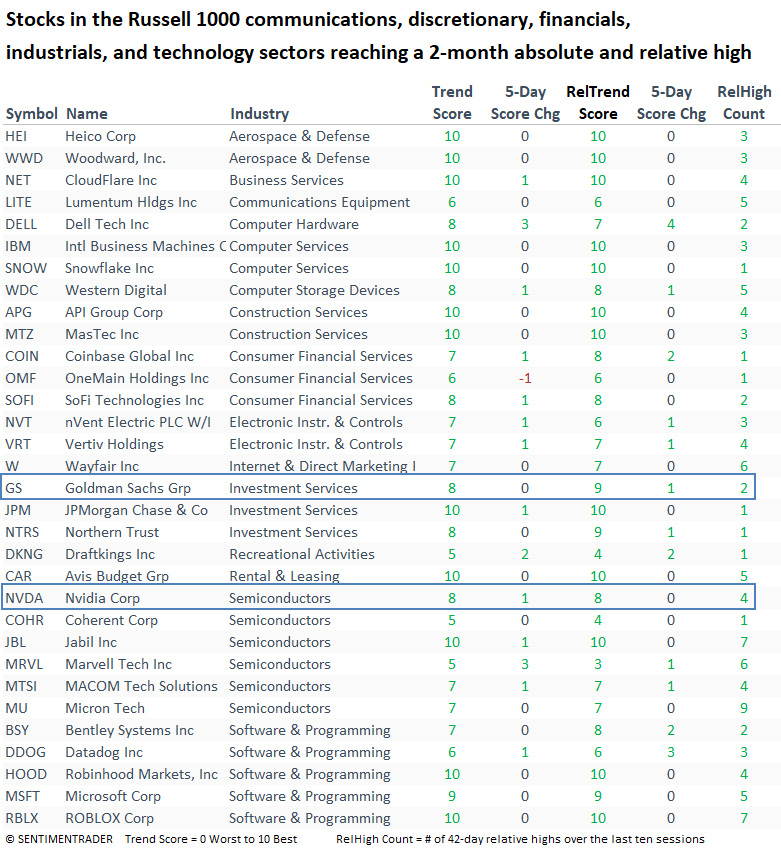
Each night, I review stocks registering absolute and relative highs to identify whether an emerging theme is taking shape beneath the surface. This daily process helps uncover early signs of sector or thematic leadership. Momentum investing seeks to capitalize on market leadership, operating on the principle that trends often persist.
In my report on Tuesday, I highlighted a resurgence in favorable absolute and relative trends among stocks within the AI ecosystem, signaling renewed leadership in this critical growth theme. This positive momentum has now gained further validation as Nvidia, the bellwether for AI, has triggered a trend score buy signal.
Given Nvidia's outsized influence on the group, this confirmation adds significant weight to the view that AI-related stocks are reasserting themselves as market leaders.
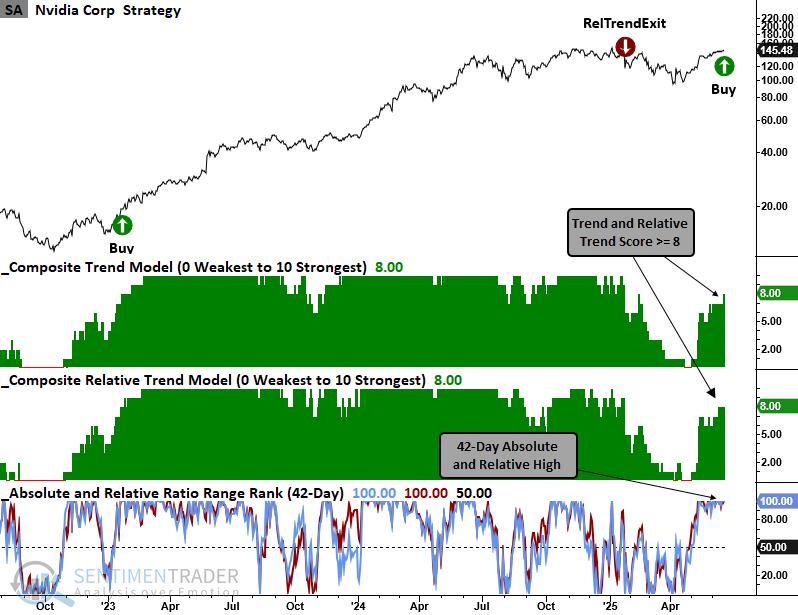
Nvidia is once again exhibiting favorable momentum
Nvidia generated a trend score signal on Wednesday when it registered a 42-day absolute and relative high as both its trend and relative trend scores maintained a level of eight or higher.
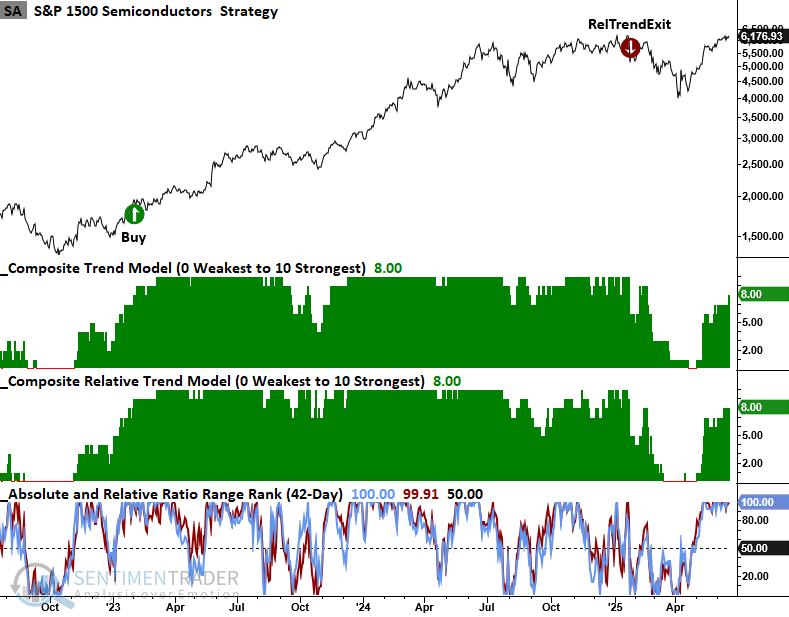
The S&P 1500 Semiconductor sub-industry group, which I highlighted had registered a trend score net change signal on May 12th, narrowly missed a trend score alert on Wednesday as the index closed 0.13% below a 42-day high. I'd assign a high probability that this signal will trigger soon.
It's essential to note that this index is market-cap weighted, meaning that stocks like Nvidia, Broadcom, Advanced Micro Devices, and Micron Technology have a significant impact on its direction.
Other opportunities exist outside of technology
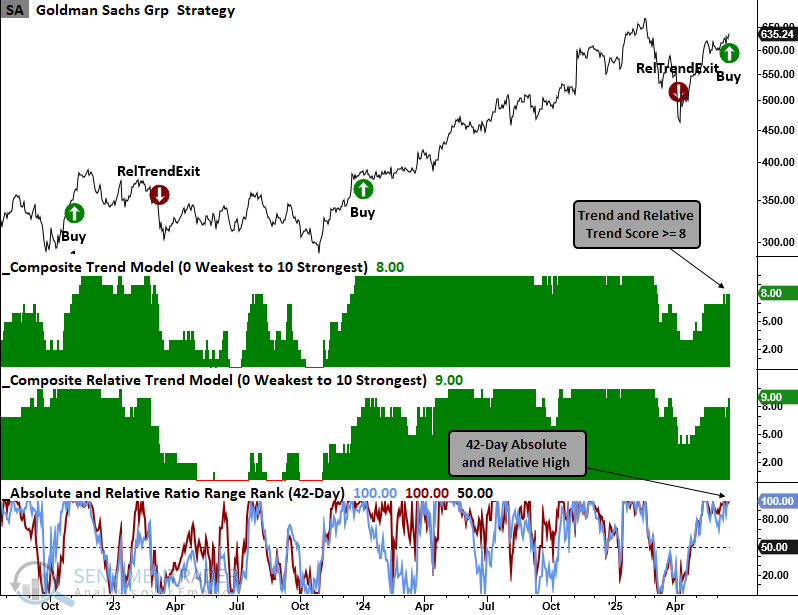
As shown in the breakout table above, Goldman Sachs and JPMorgan reached 2-month highs in both absolute terms and relative performance.
While JPMorgan has maintained a buy signal since mid-May, Goldman Sachs (GS) flashed a new trend score alert on Wednesday.
From a broad market perspective, I always like to see financials, especially the big banks, participate in rallies.
New relative breadth indicators
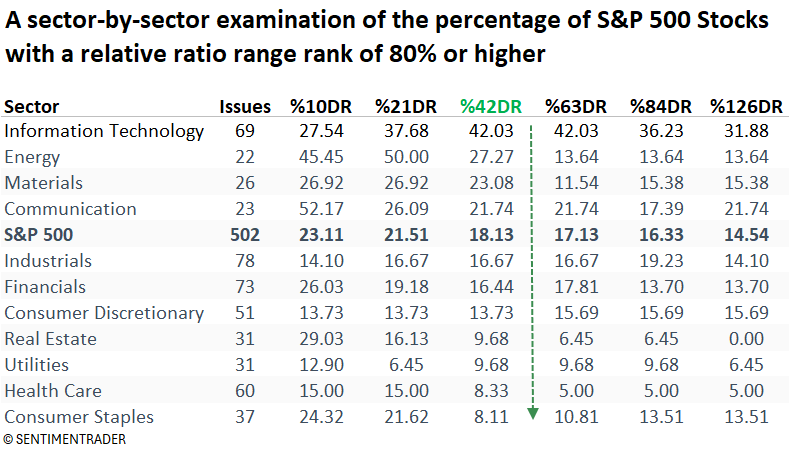
I've shared the following table in several reports, which I constructed using the relative strength range rank data from the trend score page on the website. It continues to show that the technology sector has the highest proportion of stocks, with a rank of 80% or higher across most horizons.
The programming team constructed a time series for these indicators using 10, 42, and 126-day horizons to capture short-, medium-, and long-term relative strength trends for stocks within each sector. i.e., relative breadth indicators. Let's take a look at some examples.
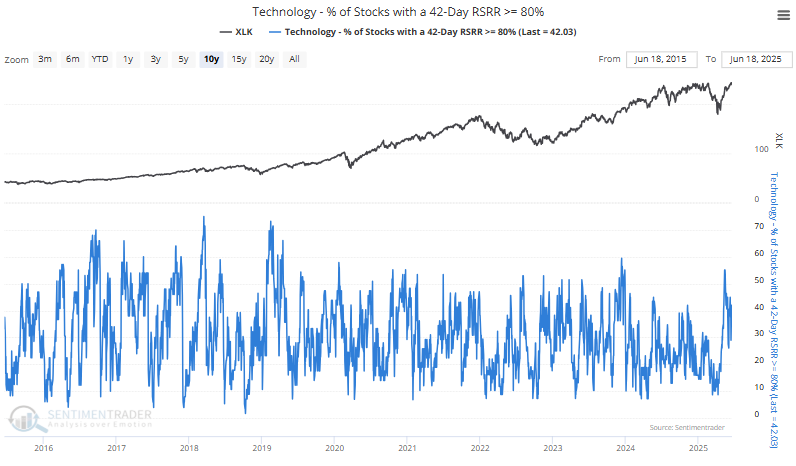
The following chart contains the percentage of S&P 500 Technology sector stocks with a 42-day relative strength range rank of 80% or higher.
Momentum investors can apply these new indicators in two key ways. First, watch for a strong surge that may signal the beginning of a fresh leg of relative outperformance. Second, evaluate how a sector stacks up against others, aiming to overweight those with the highest percentage of stocks exceeding the 80% threshold.
Mean reversion traders can track these indicators for signs of exhaustion, potentially enhancing signal accuracy when all three horizons align.
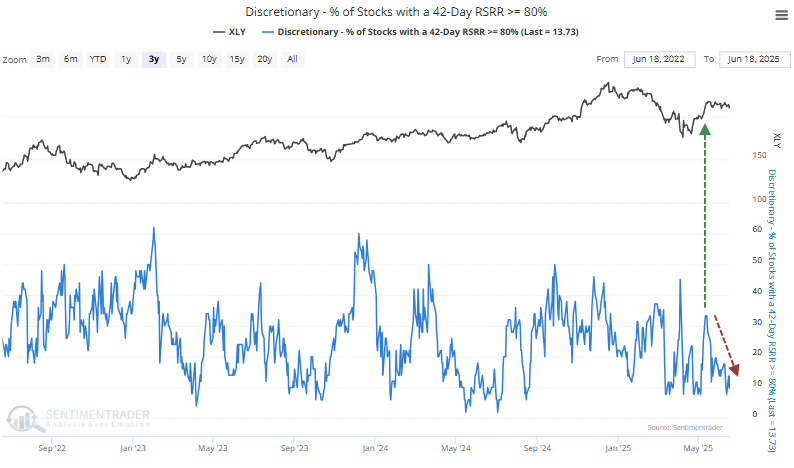
Consumer discretionary stocks saw an initial burst of strength following the Liberation Day low. However, their relative trend breadth has since eroded. As we've noted, a stagnant housing market, driven by elevated mortgage rates and home prices, remains a headwind. The recent surge in crude oil prices, driven by the conflict in the Middle East, has only exacerbated the sector's challenges.
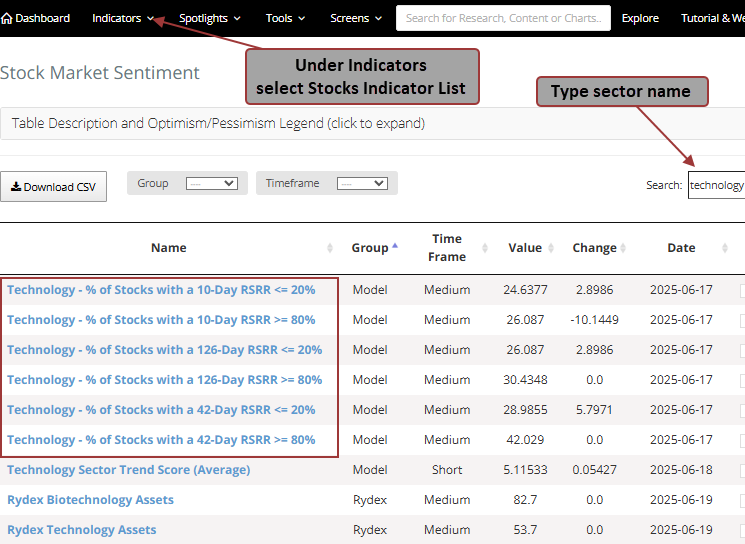
Where can I find these indicators?
The programming team will be adding these new indicators to the trend score page in the sector summary section. For now, you can find them in the Stocks Indicator List, as illustrated below.
I will elaborate further on the indicators in the July webinar.
What the research tells us...
Nvidia, the bellwether semiconductor stock at the forefront of the AI revolution, has regained its leadership status, triggering a trend score buy signal. This resurgence is significant not only for Nvidia itself but also for the broader AI ecosystem and technology sector, given the company's outsized market-cap weighting and influence on index performance. Adding to the bullish tone, Goldman Sachs, a premier name in global banking, also triggered a trend score alert, a positive sign for the financial sector and its industry peers. To help traders and investors stay ahead of these relative trend shifts, we've added several new indicators to the website aimed at identifying both momentum leaders and potential mean-reversion opportunities.