
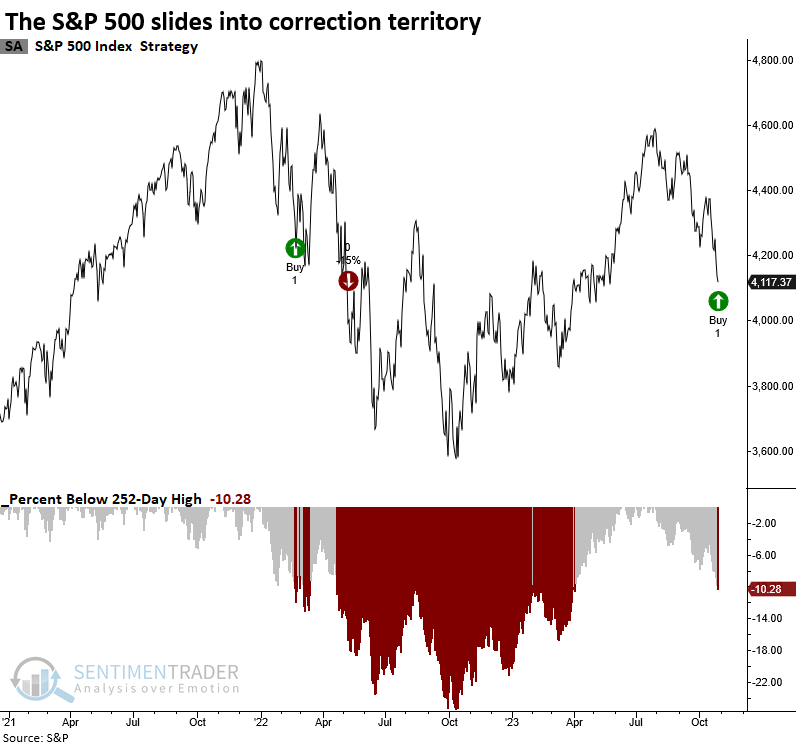
The world's most benchmarked index is now in correction territory

Key points:
- The S&P 500 closed down -10% from a 252-day high, indicating a market correction
- While -10% drawdowns tend to bounce back, that's not the case when breadth is weak, like now
- The probability of the decline exceeding -15% is more significant than a rally to a new 252-day high
What does history suggest after the S&P 500 declines by -10% from a 252-day high?
The S&P 500 suffered losses in ten of the past twelve trading sessions, pushing the prominent large-cap benchmark into correction territory as of Friday. Since 1928, there have been 44 other precedents of a -10% drop from a 252-day high.
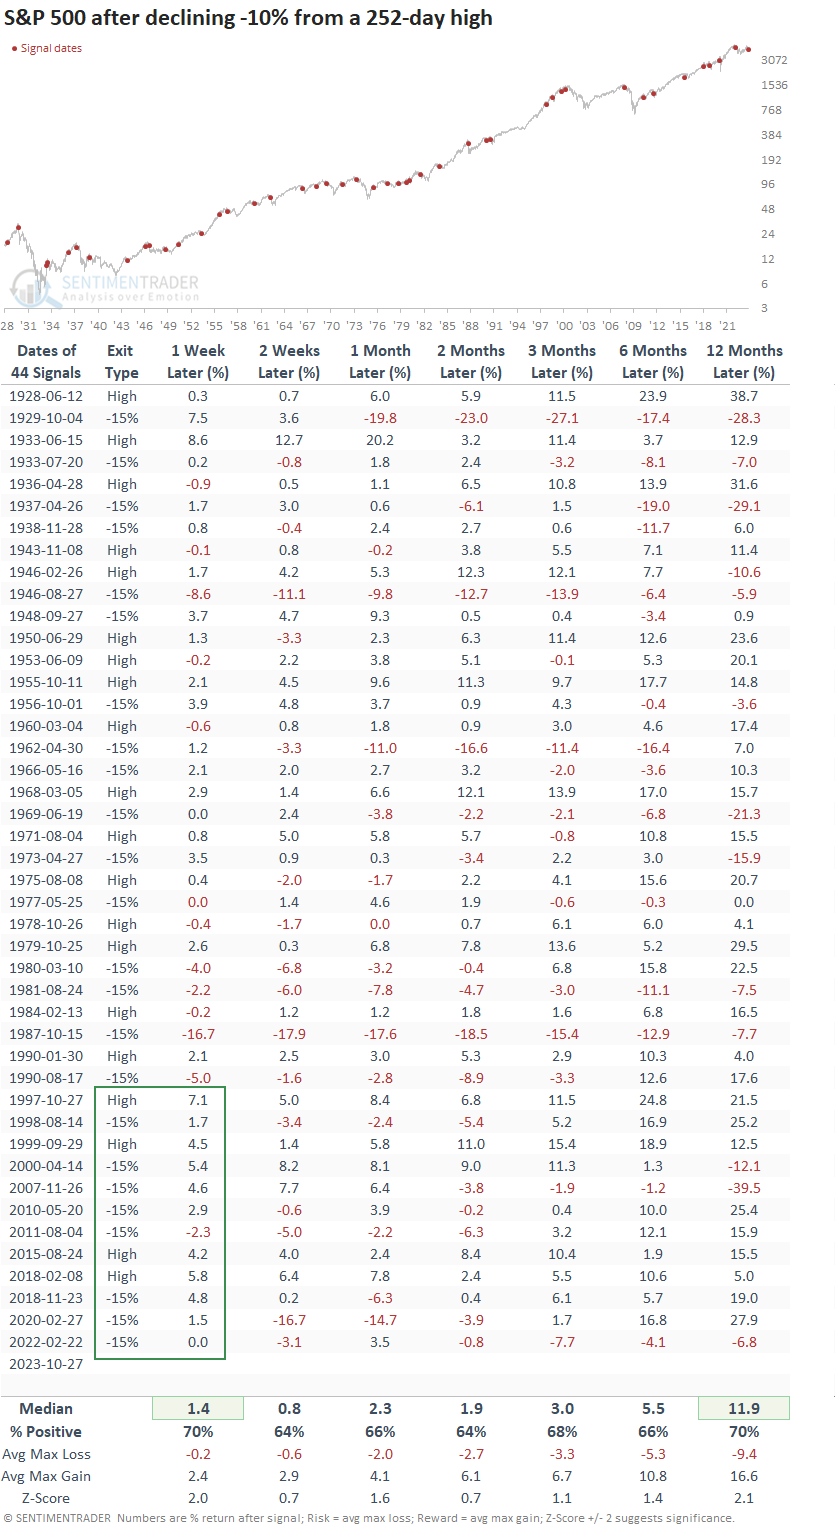
Following a -10% drop from its peak, the S&P 500 tends to face a higher probability of additional losses rather than achieving a new high, with history showing that in 55% of cases, the index fell a total of -15%.
On a more positive note, the likelihood of a severe -20% decline decreases, with just 39% of historical cases experiencing an additional -10% drop, pushing them into the loosely characterized bear market classification.
Similar drawdowns led to a short-term bounce-back
Whenever the S&P 500 declines by -10% from a 252-day high, the bellwether large-cap index tends to bounce back over the subsequent week with a 70% win rate and a median gain of 1.4%.
Since 1997, correction signals have displayed a notable propensity to rebound in the first week, with a positive outcome observed in 10 out of 12 instances. However, it's worth noting that 8 out of those 12 precedents ultimately surpassed the -15% correction threshold.
The exit type column reflects whichever sell signal occurred first. i.e., the S&P 500 declines by -15% from a 252-day high, or it rebounds to close at a new 252-day high.
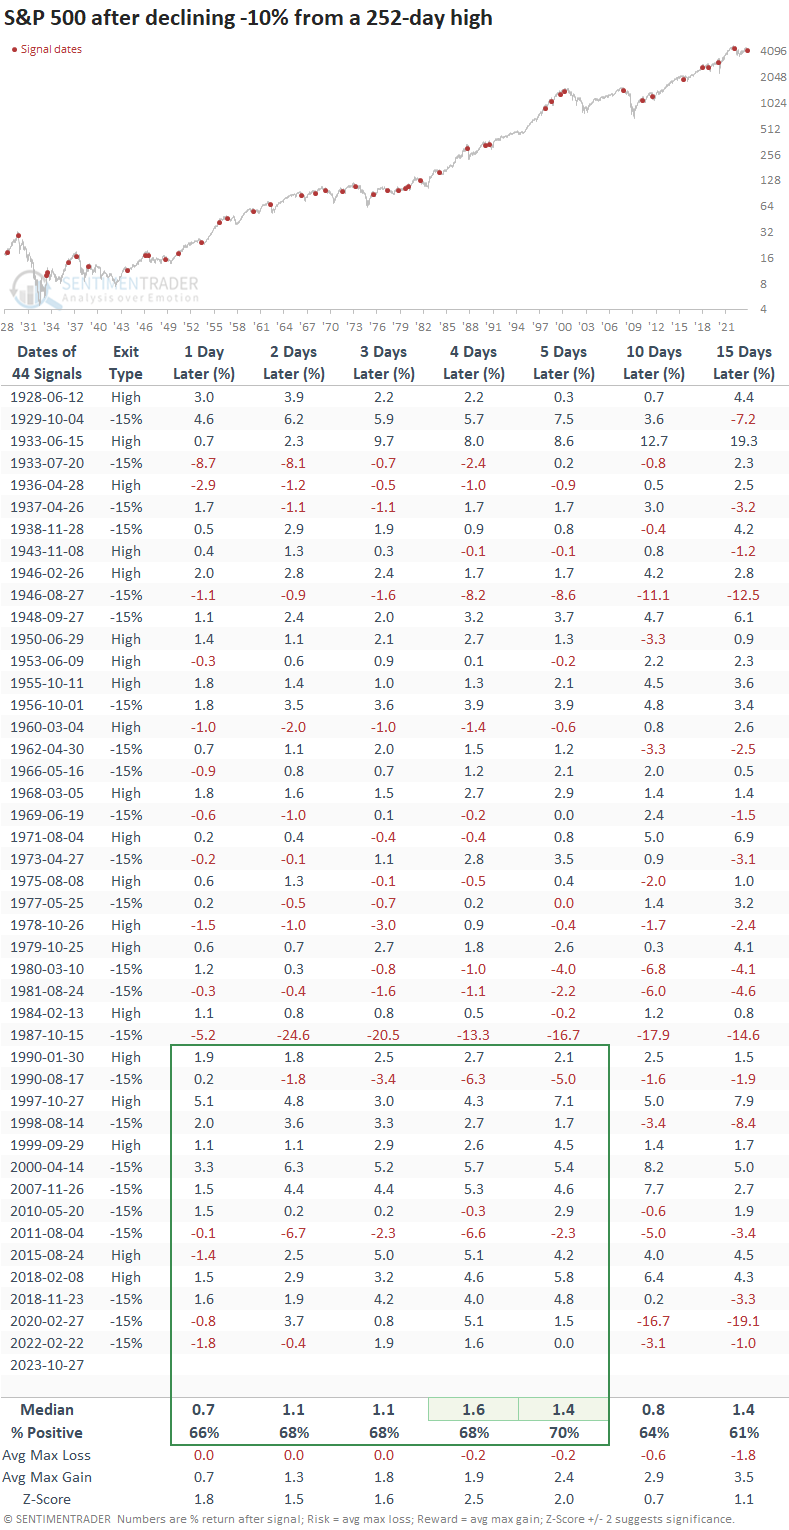
Since 1990, there has been a gain in the S&P 500 at some point in the first five trading sessions in all but one instance, albeit August 1990 was marginally profitable.
Signals that coincide with weak long-term uptrend conditions from index members
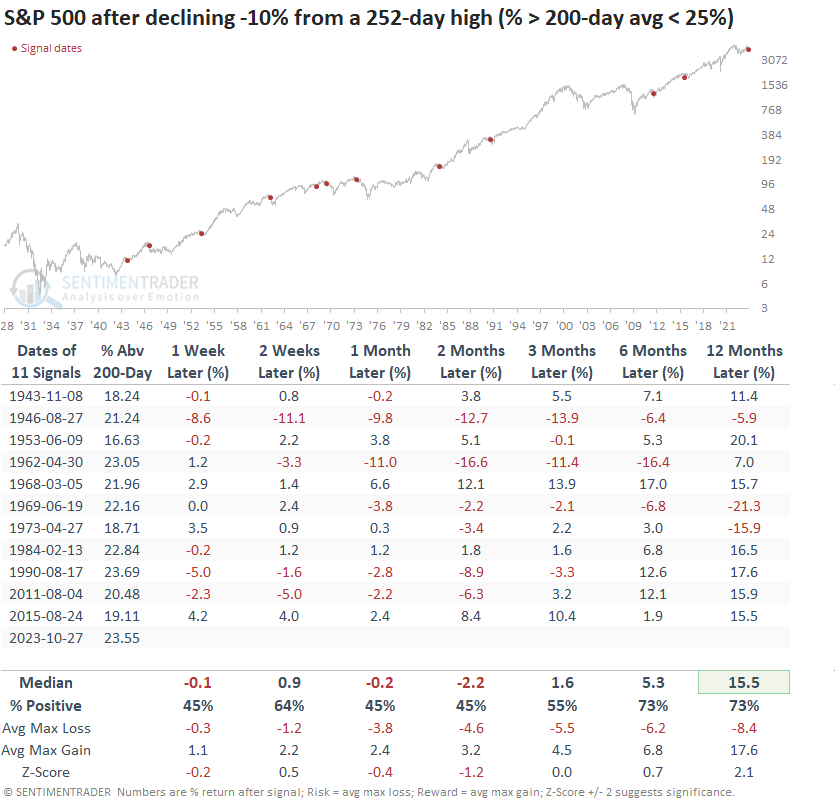
Last week, I published a research note highlighting the deteriorating long-term uptrend backdrop for S&P 500 stocks. On Friday, when the S&P 500 fell into correction territory, only 23.55% of S&P 500 stocks were trading above their 200-day average, representing the 11th-lowest reading in history at the time of a correction signal.
Correction signals associated with weak long-term uptrend conditions display unfavorable results over the subsequent two months.
What the research tells us...
The S&P 500 recently crossed into correction territory, with a decline of over -10% from its 252-day high. Historically, such corrections led to a healthy rebound over the following week. However, this time could be different as long-term participation trends among member stocks are unfavorable, a condition that has historically led to subpar performance over the next two months. When the S&P 500 falls into correction territory, like it is doing now, it tends to undergo a more extensive decline exceeding -15% rather than closing at a new 252-day high.