
The world's most benchmarked index exhibits bullish price momentum

Key points:
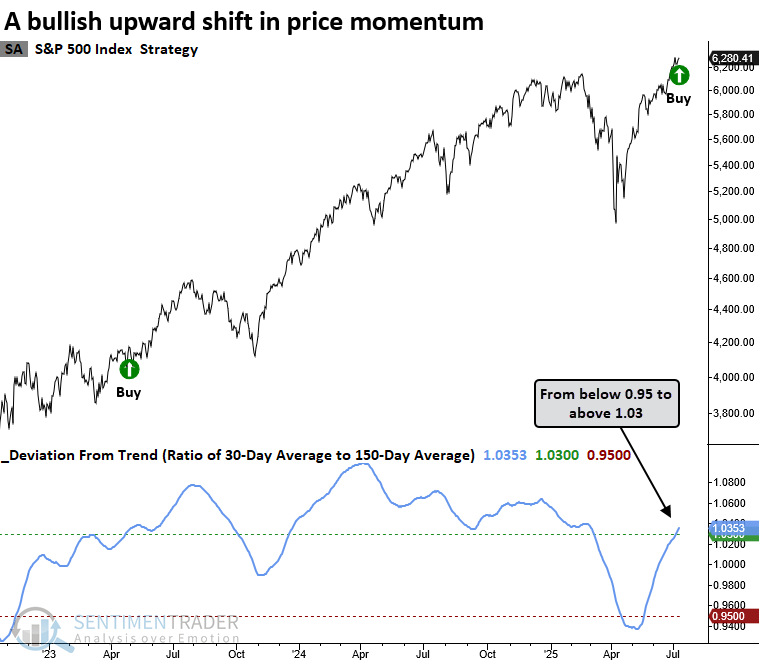
- The S&P 500 generated a deviation-from-trend signal, indicating bullish price action
- Similar shifts in momentum suggest the cyclical upswing in the S&P 500 will persist over the next year
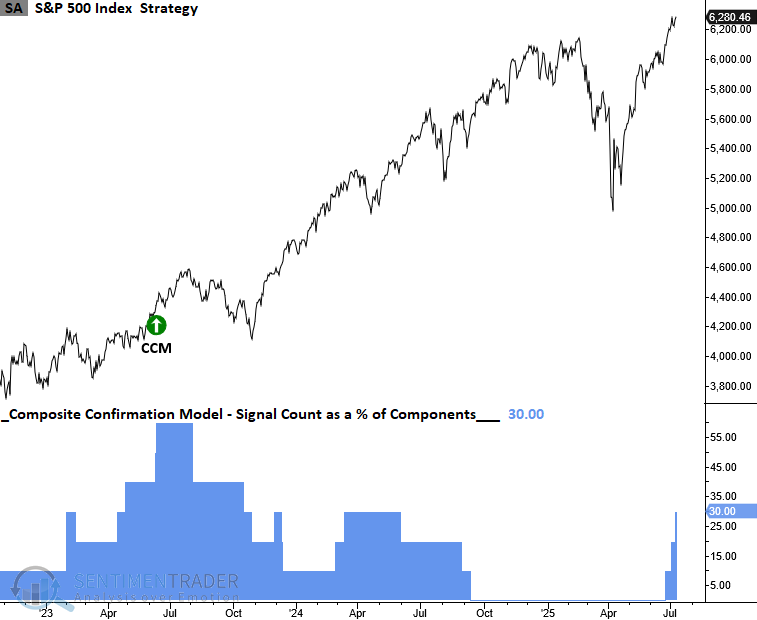
- With the new alert, the TCTM Composite Confirmation Model signal count increased to 30%
Bullish momentum tends to beget more bullish momentum
A few weeks ago, I published a report highlighting that both the S&P 500 Technology sector and the Nasdaq 100 had triggered deviation-from-trend signals, pointing to a favorable shift in price momentum. Now, the world's most benchmarked index, the S&P 500, has followed suit, generating a similar alert, which strengthens the case for a sustained rally in stocks.
The deviation-from-trend indicator identifies momentum shifts by tracking the ratio of the 30-day to 150-day average. A signal occurs when the ratio cycles from below 0.95 to above 1.03, and the index registers a 42-day high.
Similar price momentum shifts suggest the uptrend will persist
An upward shift in price momentum, as signaled by the deviation-from-trend indicator, often marked a favorable period for the S&P 500 over the following year, with the index displaying a median gain of 14%. Furthermore, results post the 1929-42 secular bear market were even more impressive, with several time frames experiencing only a few losses.
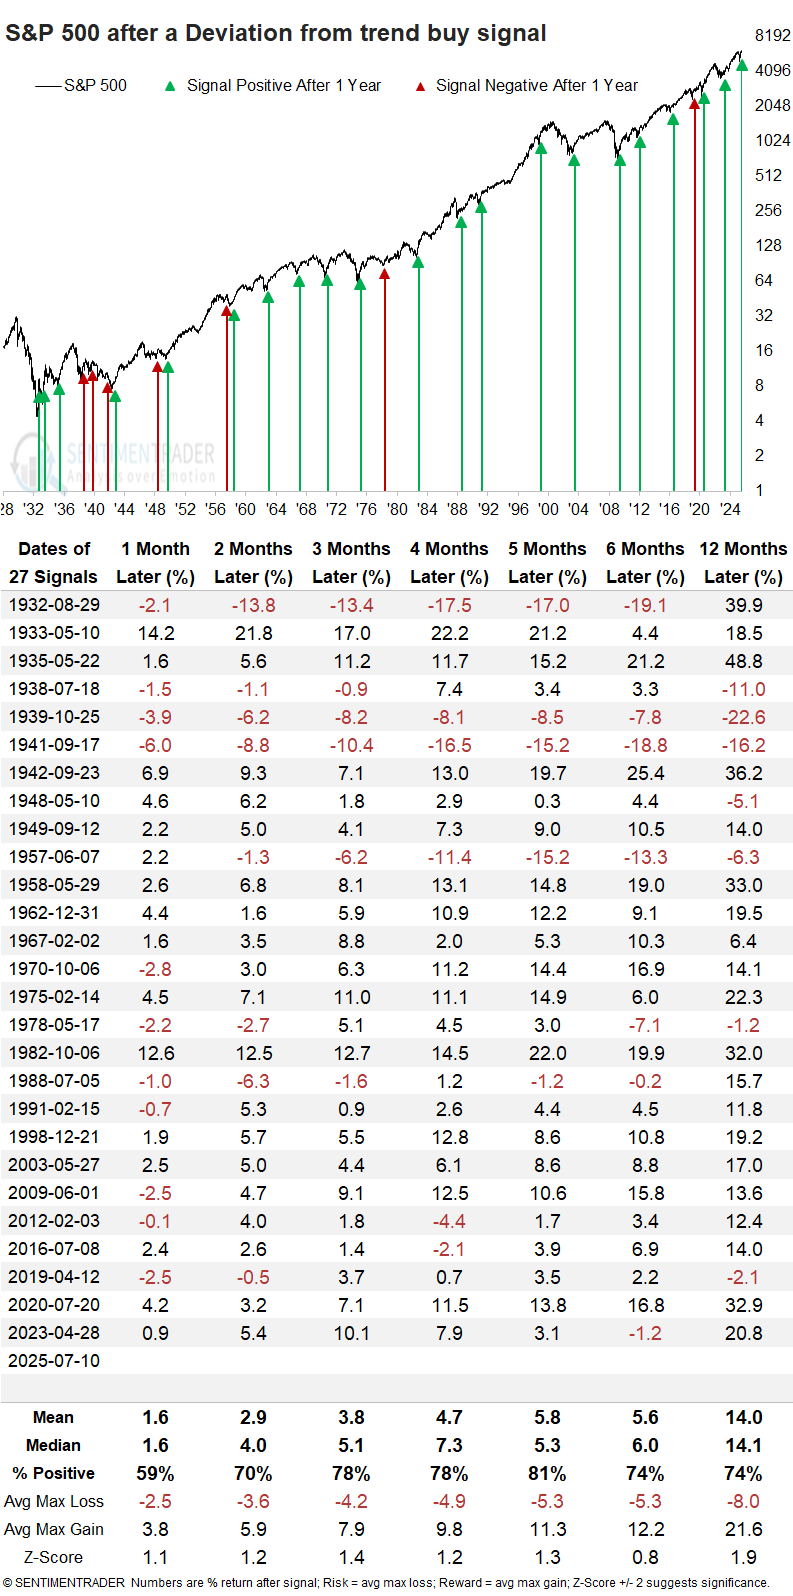
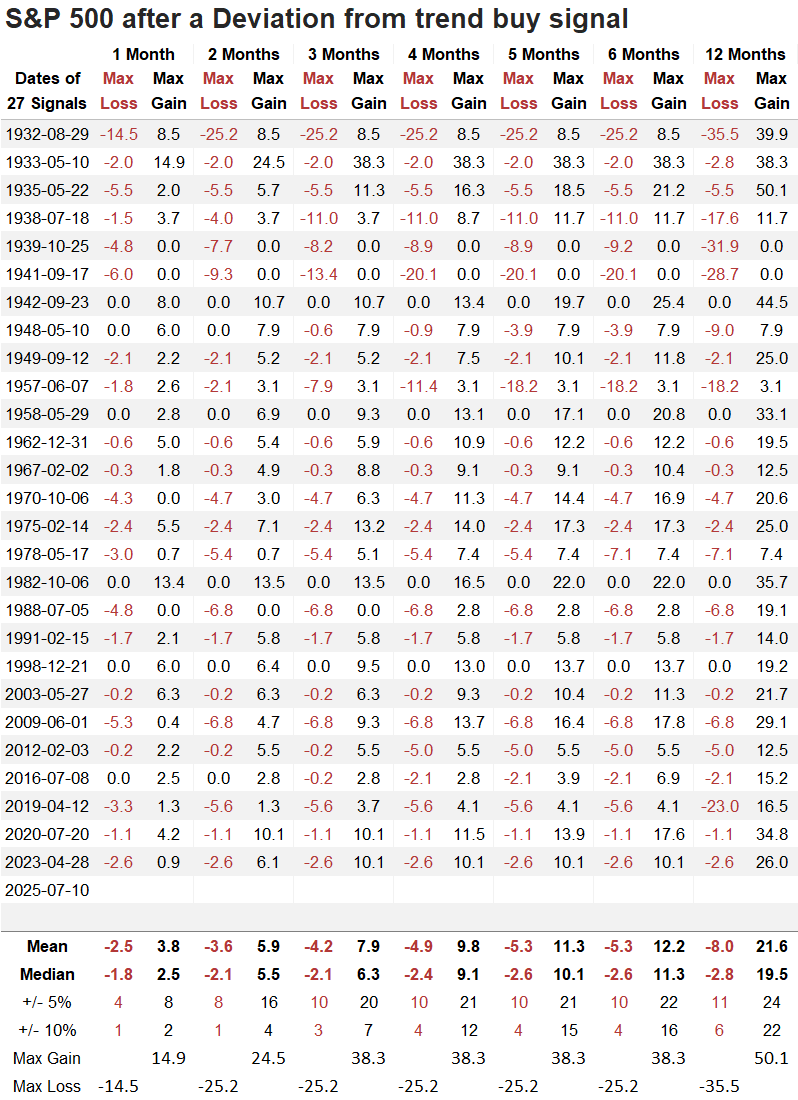
Over the following year, the S&P 500 experienced a decline of more than 10% on six occasions, while it rose by more than 10% in 22 instances, indicating a favorable risk/reward scenario.
The TCTM Composite Confirmation Model has moved higher again
With stocks and indexes steadily rising, components in the Composite Confirmation Model, which identify long-term bearish-to-bullish shifts in breadth and price momentum indicators, are consistently signaling conditions aligned with sustained uptrends.
Weight of the evidence
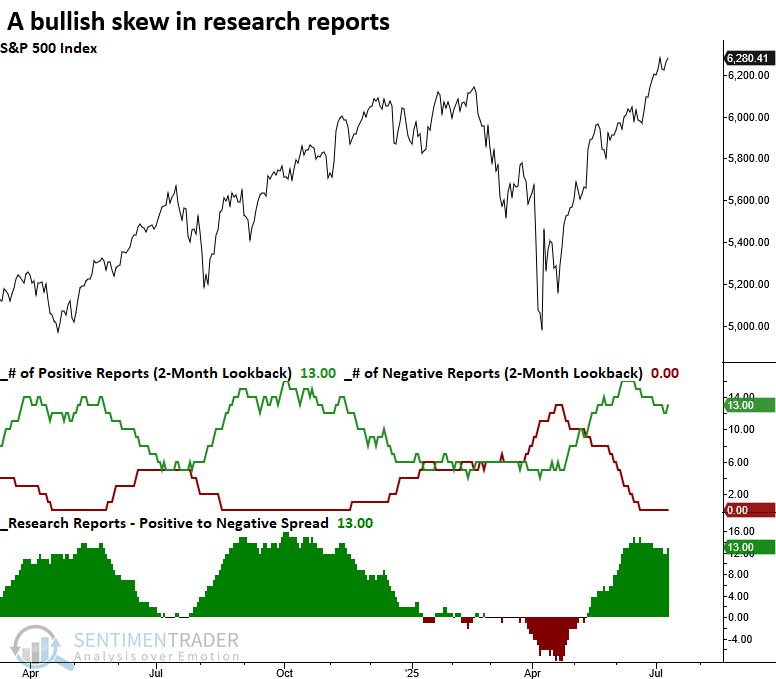
The spread between bullish and bearish research reports remains elevated, suggesting the weight of the evidence favors a bullish outlook.
What the research tells us...
The S&P 500 triggered a deviation-from-trend buy signal, indicating bullish price momentum. This signal now aligns the broader market with earlier signals from the S&P 500 Technology sector and the Nasdaq 100, both of which have been leadership benchmarks in the current advance. Similar instances preceded favorable returns and win rates for the S&P 500 over the following 12 months. With the new alert, the TCTM Composite Confirmation Model signal count increased to 30%, providing additional evidence that market conditions continue to mirror historical tendencies seen in sustained uptrends.