
The warnings are stacking

Key points
- NASDAQ Hindenburg Omen and Titanic Syndrome have triggered eight combined times in the past three weeks
- When the three-week sum crossed above eight historically, the Nasdaq's future return isn‘t good
- SPX sits within 1% of a three-year high while a fewer participation in the breadth
- The breadth setup that was concerning two weeks ago has only deteriorated
The warnings are stacking
Last weeks, we flagged that the Hindenburg Omen had triggered simultaneously across both NYSE and NASDAQ. The composite Titanicburg indicator often told a contrarian read, extreme breadth deterioration had been more capitulation than start-of-something-worse. Worth paying attention to, but the track record leaned the other way.
Since then, the warnings have increased. The NASDAQ versions of both indicators have triggered eight times in three weeks. These names get eye rolls, if you can get past the hyperbole, what they flag is real, internal deterioration while the surface holds up. And right now they are flagging it repeatedly.
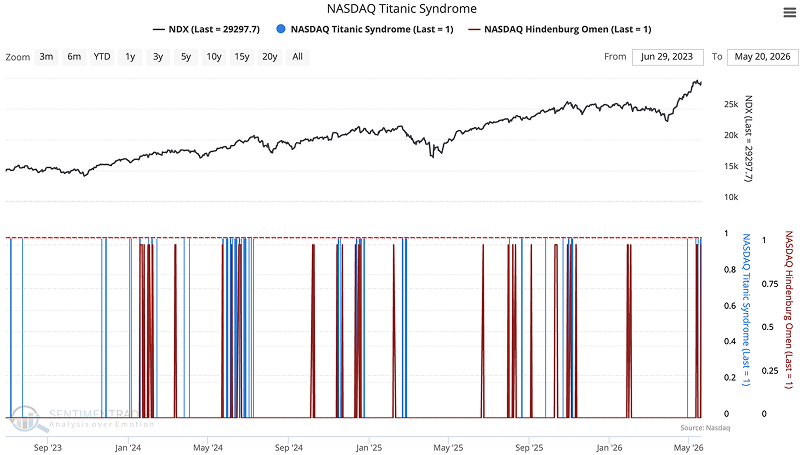
No single trigger is alarming by itself. The clustering is what matters. When the three-week rolling sum of combined warnings crosses above seven, only 4% of all weeks in the data set have looked like this. During those weeks, the Nasdaq Composite annualized at -24%. When warnings sit at zero, the case three-quarters of the time, the annualized return was nearly 18%. The gradient is not subtle. More warnings, worse returns.
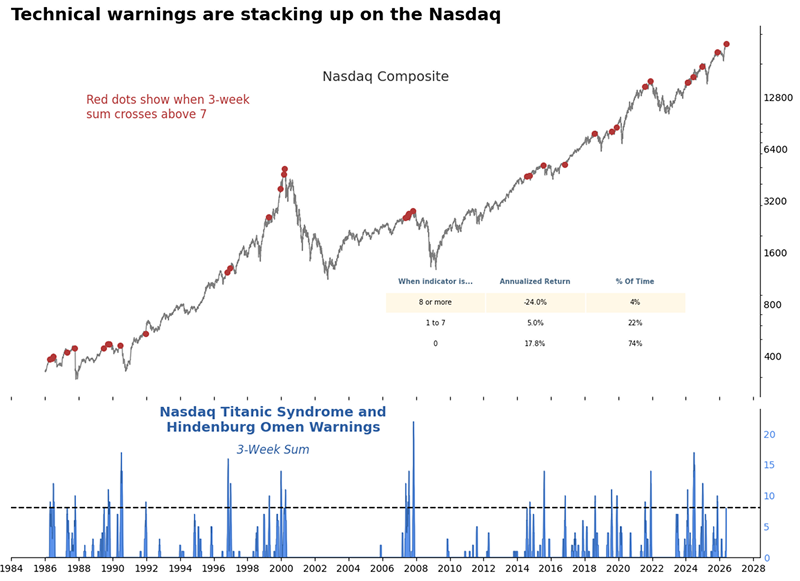
Taking a signal-based approach, the table below shows Nasdaq Composite returns after the 37 times the three-week sum cycled from zero to eight or more. There was almost no forward edge. One month later: -0.3% on average, higher 58% of the time. Six months -2.4%, a coin flip. A year out +0.2% average, median +2.7%. The average loss was 24%. The average gain was 20%. Wide tails, no reliable center.
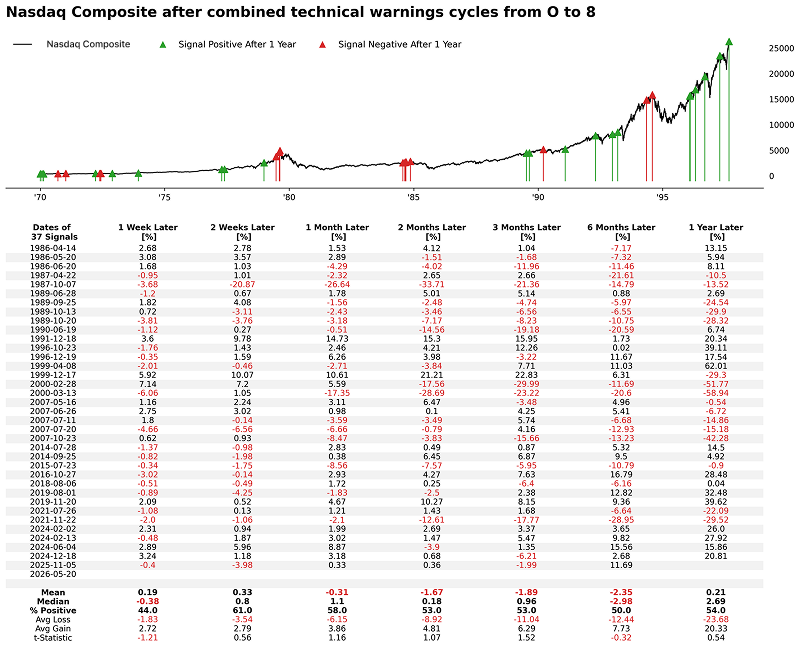
The S&P 500 held up less badly, but "less badly" is doing a lot of work. Six months later, it averaged +0.7% and was higher 53% of the time. A year out, +2.7% with a 54% hit rate. Across every window beyond a month, the average loss routinely exceeded 7%. Some recoveries, no reliability.
Below the surface
The warnings are not just on the Nasdaq. The S&P 500 sits at 7,433, within a percent of a three-year high. Below it, participation is crumbling. Fewer than 60% of SPX members are above their 10-day moving average. Fewer than 55% above their 50-day. Fewer than 60% above their 200-day. All three gauges slipped below their thresholds together while the index barely moved.
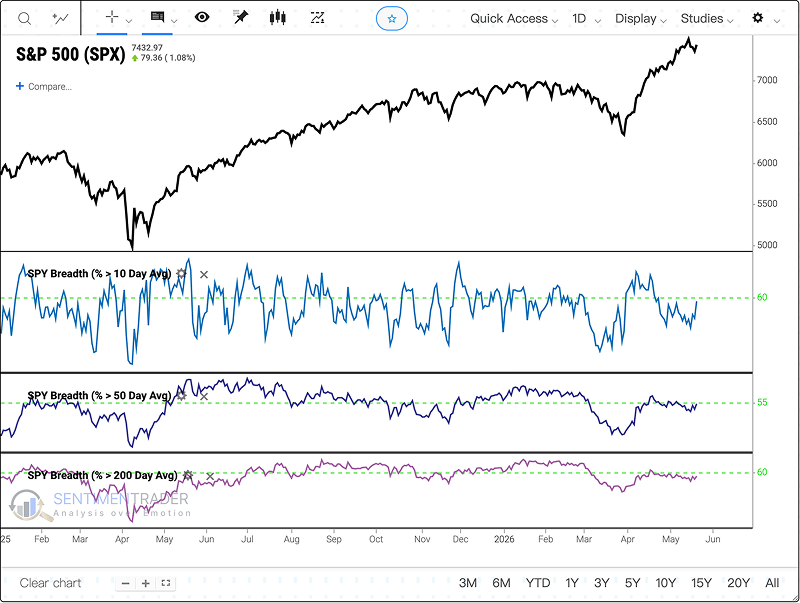
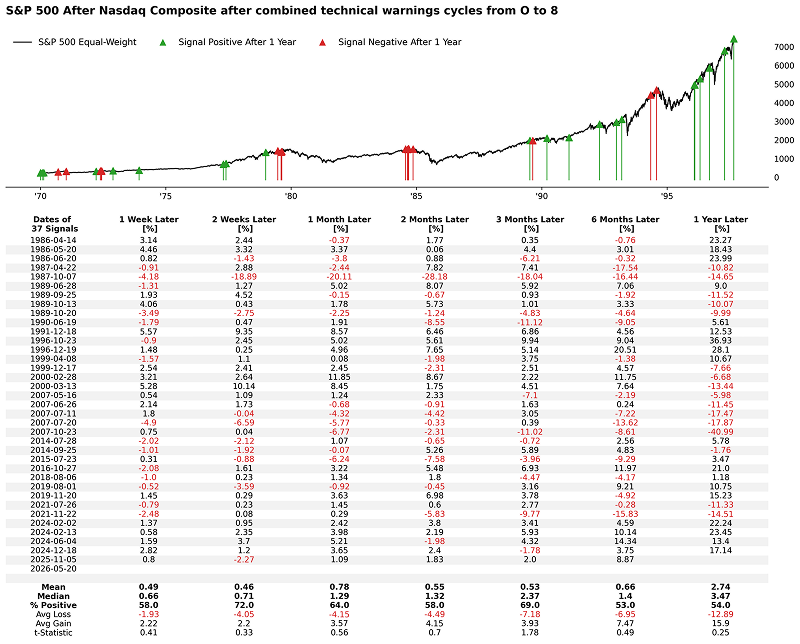
This kind of comprehensive divergence, index at a high, participation at a low, does not happen often. We have to relax the parameters to build any sample at all. The table below shows SPX Equal-Weight returns when the index was within 1% of a three-year high with fewer than 60% of stocks above their 10-day, 55% above their 50-day, and 60% above their 200-day averages. Fourteen signals. The short-term outcomes were ugly, two weeks later, the index was higher just 31% of the time. One month out, returns were flat and the hit rate barely cleared half.
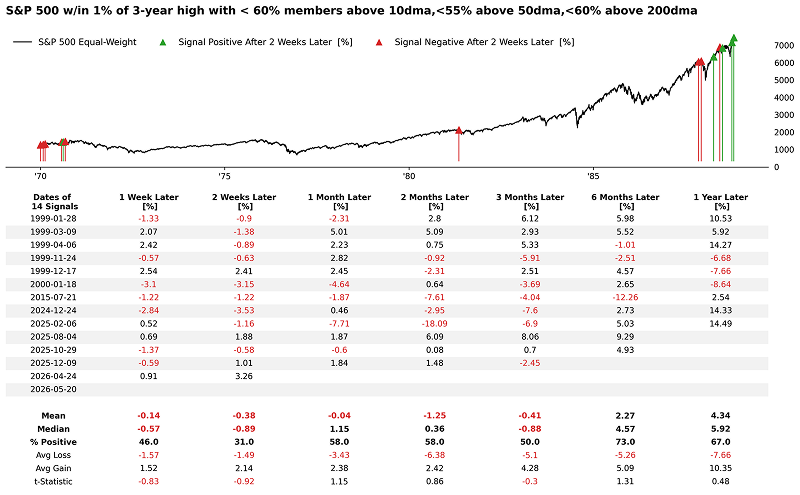
For what it is worth, the longer-term numbers do improve. Six months was 73% positive, averaging +2.3%. A year out, 67% with +4.3%. But the sample is thin and clustered. Seven of the fourteen signals fall in two periods: 1999-2000 and late 2024 through 2025. The 1999 group preceded the dot-com unwind. The 2024-2025 signals have mostly worked out so far. Which bucket this one lands in is the open question.
What the research tells us...
Two weeks ago, the breadth warning was a single event, concerning but carrying a contrarian read worth respecting. At this level of warning intensity, the historical record is not ambiguous. Returns are worse than random, tails are wide, and the edge leans toward caution. The bull case has not been disproven. It has just been losing the argument.