Products
SentimenTrader Trading Tools
‍
Backtest Engine
My Trading Toolkit
Correlation Analysis
Seasonality
Market Prediction
Indicators & Data API
‍
Proprietary Indicators & Charts
Market Data API
Strategies & Scanner
‍
50+ Trading Strategies
Smart Stock Scanner
Smart Option Scanner
Research Reports
‍
Research Solutions
Reports Library
Free Resources
Simple Backtest Calculator
Simple Seasonality Calculator
The Kelly Criterion Calculator
Sentiment Geo Map
Public Research Reports
Education
Sentiment Indicators
Technical Indicators
Pricing
Company
About
In the News
Testimonials
Client Success Stories
Contact
Log inLoginSign up
< BACK TO ALL REPORTS

The VIX Index meets the month of October

Jay Kaeppel
2024-09-27
As we approach October, should investors expect an increase in market volatility? The history of presidential election years offers a potential clue.

Key points

  • October has a reputation as being a volatile month for stocks and a time of supposed danger
  • Actually, despite seeing several significant market declines (1929, 1978, 1979, 1987, 1997, 2008), overall, October has been a favorable month for stocks
  • Nevertheless, presidential election year history suggests being prepared for a spike in volatility - and whatever might accompany it - during October 2024

The VIX Index

The VIX Index measures the implied volatility (i.e., estimated future volatility) of near-term at-the-money SPX (S&P 500) index options. If the SPX moves significantly, new strike prices are used to calculate the VIX. Since there is a skew to options prices and implied volatility changes with the strikes, the VIX will typically rise when the market drops and fall when the market rises. This is not always the case, but the correlation is clear.

The standard interpretation of VIX movements is that the VIX will rise when fear or uncertainty does since there will be a greater demand for put options. Conversely, traders typically become complacent when the market rises, and the VIX will fall as the demand for put options decreases.

While the range within which the VIX tends to travel can change over time, when it drops below 12%, it can show excessive optimism, and when it is above 30%, it shows excessive pessimism.

The VIX Index meets the month of October

So, how does volatility behave during the month of October? Well, it's volatile. The chart below shows the hypothetical fluctuations of the VIX Index (using $1.00 as a baseline starting point) during the month of October since 1986.

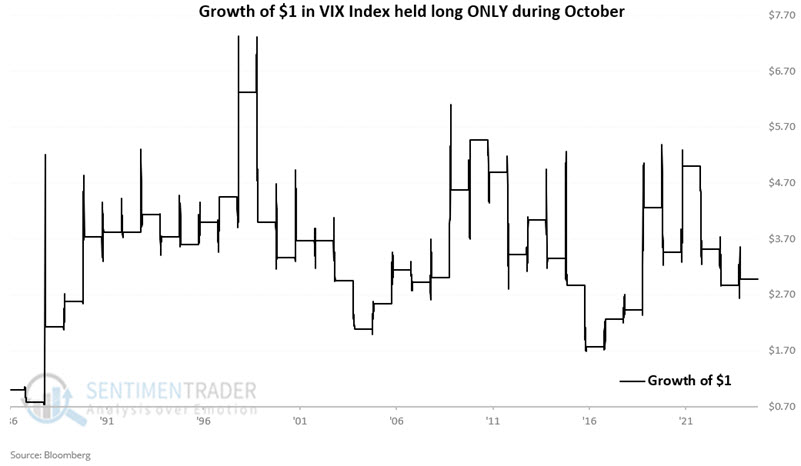
See a pattern? Me neither.

Now, let's consider presidential election years versus all others. The chart below shows the hypothetical fluctuations of the VIX Index (using $1.00 as a baseline starting point) during the month of October since 1986, excluding presidential election years (.i.e., 1988, 1992, 1996, etc., are excluded).

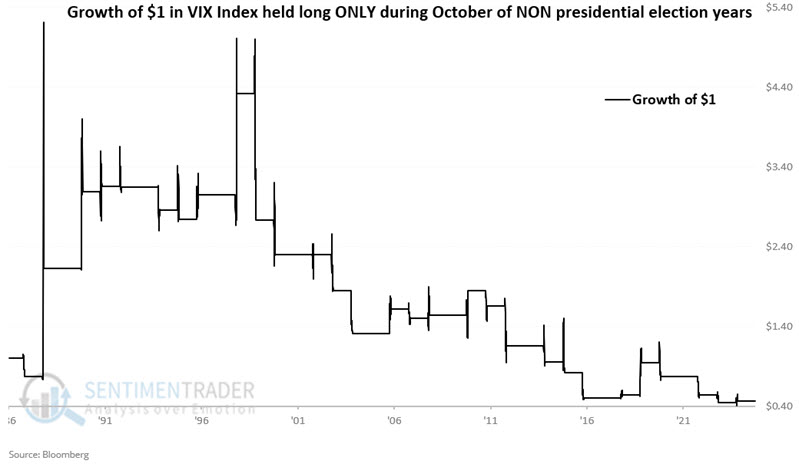
This chart appears to have a much more unfavorable bias. Now, let's look at October VIX performance only during presidential election years.

The chart below shows the hypothetical fluctuations of the VIX Index (using $1.00 as a baseline starting point) during the month of October since 1986, only during presidential election years (i.e., only 1988, 1992, 1996, etc. are considered).

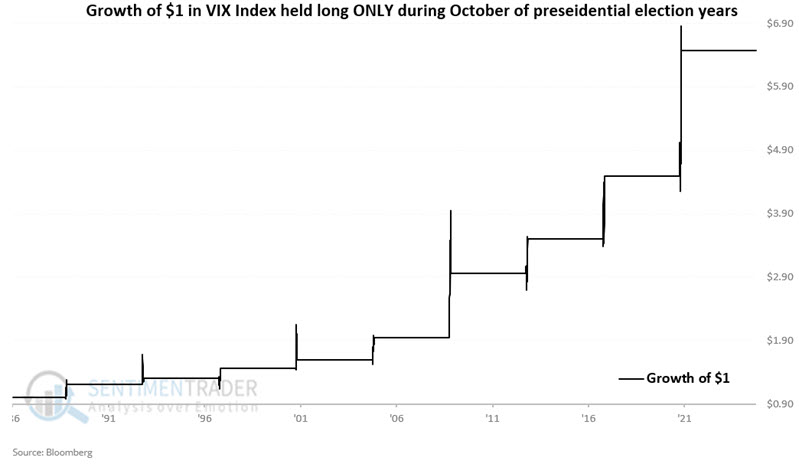
Notice anything different about this chart?

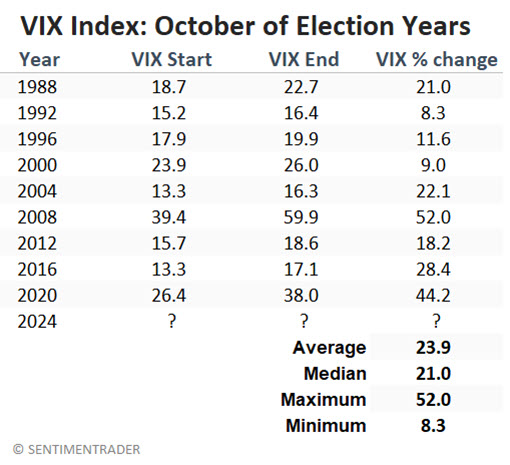
The table below summarizes the VIX Index performance during October of presidential election years.

What the research tells us…

So is the implication that volatility is going to soar during October 2024 - and, by extension, that the stock market is likely to pull back since sharp spikes in volatility and market declines tend to go hand-in-hand? Not necessarily. In fact, there is absolutely no guarantee that the VIX Index will rise during the month ahead. Still, when we combine the historical tendency for higher volatility during October of election years with the fact that it has gotten awfully easy to make money in the stock market lately, a pullback in the market would not come as a surprise.

PRODUCTS
SentimenTrader
Trading Tools
Indicators & Data API
‍
Strategies & Scanner
‍
Research Reports
FREE
RESOUrCES
Simple Backtest
Calculator
Simple Seasonality
Calculator
The Kelly Criterion
Calculator
Sentiment Geo Map
‍
Public Research Reports
‍
Education
Sentiment Indicators
‍
Technical Indicators
‍
Pricing
Bundle pricing
‍
FAQ
‍
Announcements
‍
COMPANY
‍
About
‍
In the News
‍
Testimonials
‍
Client Success Stories
CONTACT
‍
General Inquiries
‍
Media Inquiries
‍
Financial Professionals Inquiries
‍
© 2026 Sundial Capital Research Inc. All rights reserved.
Setsail Marketing
TermsPrivacyAffiliate Program
Risk Disclosure: The information and tools provided are for research and analytical purposes only and are not intended as investment advice. Market analysis involves uncertainty, and outcomes may differ from expectations. Users should conduct their own due diligence and consider their individual circumstances before making any financial decisions. Past performance is not necessarily indicative of future results.

Hypothetical Performance Disclosure: Hypothetical performance results have many inherent limitations, some of which are described below. No representation is being made that any account will or is likely to achieve profits or losses similar to those shown; in fact, there are frequently sharp differences between hypothetical performance results and the actual results subsequently achieved by any particular trading program. One of the limitations of hypothetical performance results is that they are generally prepared with the benefit of hindsight. In addition, hypothetical trading does not involve financial risk, and no hypothetical trading record can completely account for the impact of financial risk of actual trading. for example, the ability to withstand losses or to adhere to a particular trading program in spite of trading losses are material points which can also adversely affect actual trading results. There are numerous other factors related to the markets in general or to the implementation of any specific trading program which cannot be fully accounted for in the preparation of hypothetical performance results and all which can adversely affect trading results.

Testimonial Disclosure: Testimonials appearing on this website may not be representative of other clients or customers and is not a guarantee of future performance or success.