
The VIX Index meets the month of November

Key points
- October ended with a market sell-off and a spike in volatility - the spike in volatility was not unexpected
- November has a history of being a bullish month for stocks, and a decrease in options volatility often accompanies this
- Presidential election year history suggests being prepared for a decline in volatility as November unfolds
The VIX Index
The VIX Index measures the implied volatility (i.e., estimated future volatility) of near-term at-the-money SPX (S&P 500) index options. If the SPX moves significantly, new strike prices are used to calculate the VIX. Since there is a skew to options prices and implied volatility changes with the strikes, the VIX will typically rise when the market drops and fall when the market rises. This is not always the case, but the correlation is clear.
The standard interpretation of VIX movements is that the VIX will rise when fear or uncertainty does since there will be a greater demand for put options. Conversely, traders typically become complacent when the market rises, and the VIX will fall as the demand for put options decreases.
While the range within which the VIX tends to travel can change over time, when it drops below 12%, it can show excessive optimism, and when it is above 30%, it shows excessive pessimism.
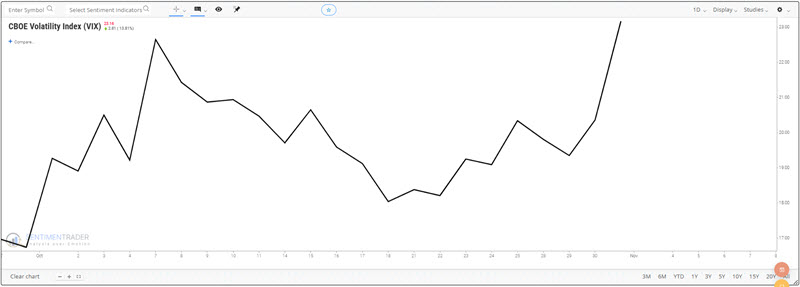
October unfolded as expected
In this article dated 2024-09-27, we highlighted the tendency for the VIX Index to rise during October of election years. October 2024 held to form as the VIX Index rose from 16.73 to 23.16, or +38.4%, from the end of September through the end of October.
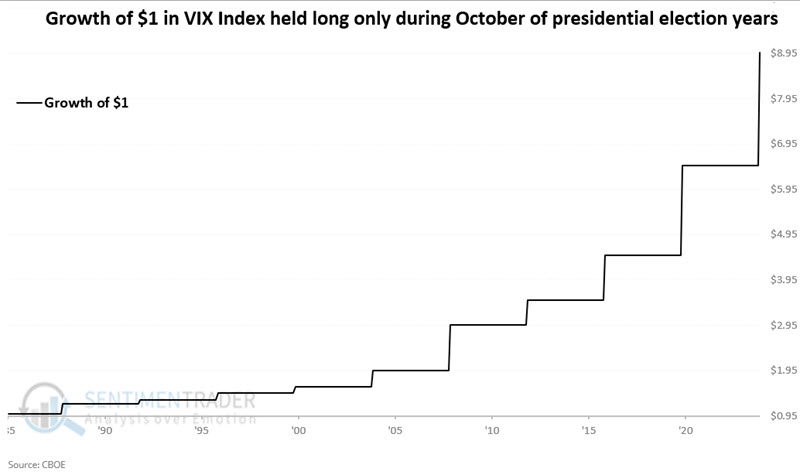
The chart below displays the hypothetical growth of $1 in the VIX Index only during October of presidential election years, updated to include October 2024.
The VIX Index meets the month of November
So, how does volatility behave during November? The chart below shows the hypothetical fluctuations of the VIX Index (using $1.00 as a baseline starting point) during October since 1986.
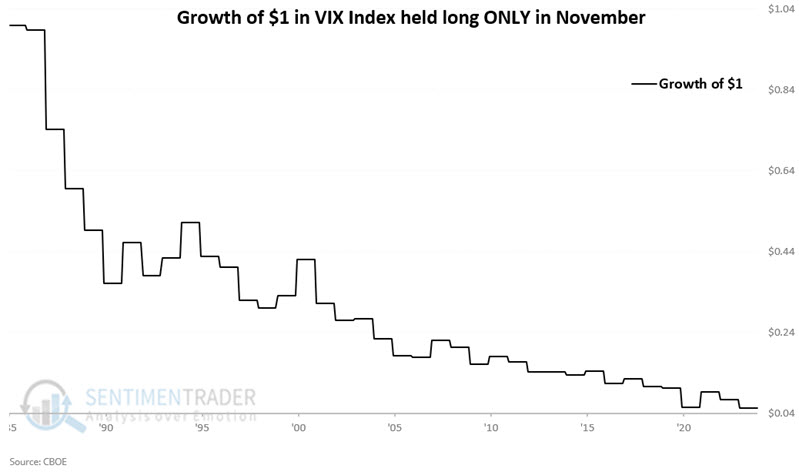
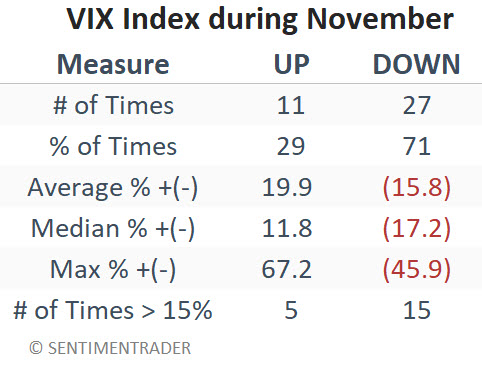
Notice anything? It's pretty simple to notice the tendency for volatility to decline during November. The table below summarizes VIX Index performance only during the month of November.
A closer look at presidential election years
Now, let's consider VIX's November performance during the presidential election years.
The chart below shows the hypothetical fluctuations of the VIX Index (using $1.00 as a baseline starting point) during the month of November since 1986, only during presidential election years (i.e., only 1988, 1992, 1996, etc. are considered).
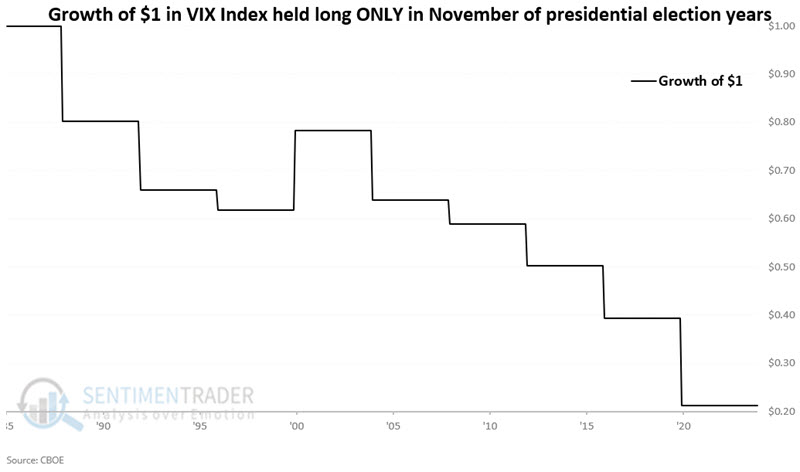
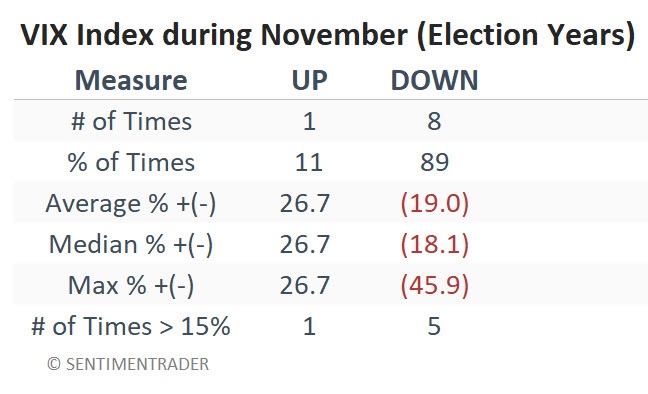
The table below summarizes the VIX Index performance during November of presidential election years.
One (albeit risky) way to play volatility
One potential way to play lower expected volatility is by buying ETF shares of the -1x Short VIX Futures ETF (ticker SVIX). That is not a recommendation, just providing the info.
Per the sponsor VolatilityShares website:
The -1x Short VIX Futures ETF (Ticker: SVIX) is an inverse VIX-linked ETF that seeks to provide daily investment results, before fees and expenses, that correspond generally to the Short VIX Futures Index (Ticker: SHORTVOL).
The Short VIX Futures Index expresses the daily inverse performance of a theoretical portfolio of first-and second-month VIX futures contracts that are rolled daily. The Index determines its daily settlement price from the Time-Weighted Average Price (TWAP) of its theoretical portfolio over the last 15 minutes of the regular equity trading session.
Investors should note that SVIX price movements are extremely volatile and prone to massive swings in price. When the VIX Index rose from 12.46 to 38.57 from July into August of this year, SVIX lost 62.5% of its value. So, any foray into inverse volatility funds such as SVIX must be treated as extremely high-risk, high-reward endeavors. Conservative position sizing should be the foremost consideration.
What the research tells us…
So is the implication that volatility will plummet during November 2024 - and, by extension, that the stock market is likely to rally - since sharp declines in volatility and market rallies tend to go hand-in-hand? Not necessarily. There is absolutely no guarantee that the VIX Index will fall during the month ahead. Still, when we consider the historical tendency for declining volatility during November of election years, it seems reasonable to continue to give the market the benefit of the doubt.