Products
SentimenTrader Trading Tools
‍
Backtest Engine
My Trading Toolkit
Correlation Analysis
Seasonality
Market Prediction
Indicators & Data API
‍
Proprietary Indicators & Charts
Market Data API
Strategies & Scanner
‍
50+ Trading Strategies
Smart Stock Scanner
Smart Option Scanner
Research Reports
‍
Research Solutions
Reports Library
Free Resources
Simple Backtest Calculator
Simple Seasonality Calculator
The Kelly Criterion Calculator
Sentiment Geo Map
Public Research Reports
Education
Sentiment Indicators
Technical Indicators
Pricing
Company
About
In the News
Testimonials
Client Success Stories
Contact
Log inLoginSign up
< BACK TO ALL REPORTS

The venerable ARMS Index flashes green

Jay Kaeppel
2024-01-19
The ARMs Index measures buying and selling pressure in stocks. It recently reached an oversold reading while the broader market is in an uptrend. Does this matter? Herein, we examine history to help traders decide for themselves.

Key points

  • The ARMS Index measures buying and selling pressure in the broader stock market
  • Oversold signals often highlight decent buying opportunities
  • Signals are typically best acted upon when the market is already in an established uptrend

The NYSE ARMS Index

Technician Richard Arms developed the TRIN (TRading INdex) which has become a staple of almost all technicians' cadre of indicators. It is more appropriately referred to as the Arms Index.

It is calculated as follows:

(Advancing Issues / Declining Issues) / (Up Volume / Down Volume)

For example, say we have 1500 issues that closed a given day higher, and there was a total of 1.2 billion shares traded in those issues. Also, 700 issues closed lower on a total of 500 million shares. The Arms Index would be:

(1500 / 700) / (1,200,000,000 / 500,000,000) = 2.14 / 2.40 = .89

A reading of 1.0 typically shows that there is even pressure between buying and selling. As selling pressure increases, the Arms Index increases. As buying pressure takes over, the Arms Index drops. Therefore, one usually sees very high readings near market lows and extended bouts of low readings near market peaks.

There have been many interpretations and twists on the Arms Index over the years. We have found that using the 10-day average of daily readings provides an effective counter-trend indication of probable turning points.

The index is most effective when giving counter-trend signals - overbought in the context of a longer-term downtrend or oversold within an uptrend. Like most contrary indicators, oversold readings during a declining market can continue to become more oversold as the trend persists.

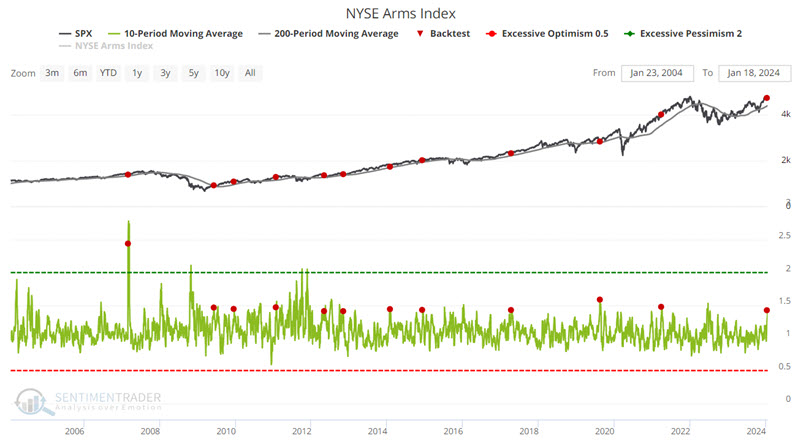
10-day ARMS Index average crosses above 1.40

The chart below highlights all dates in the last 20 years when - for the first time in six months - the 10-day average of the ARMs Index crossed above 1.40 while the S&P 500 Index was above its 200-day moving average. The intention is to highlight a potentially oversold situation in the context of an established uptrend. The most recent signal occurred on 2024-01-17.

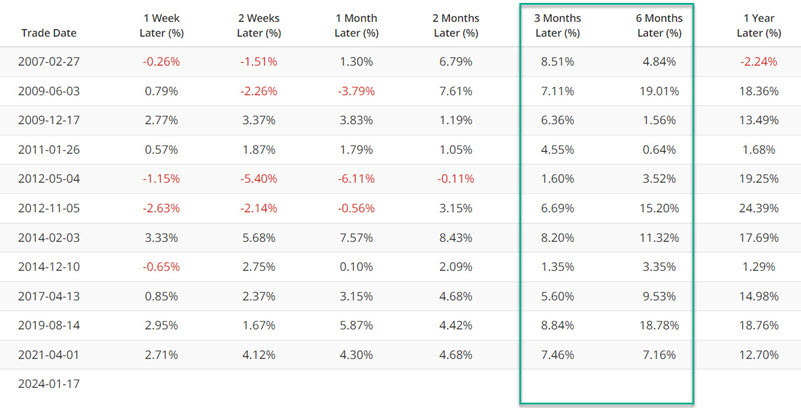
The tables below highlight the S&P 500 Index performance following previous signals and signal-by-signal results.

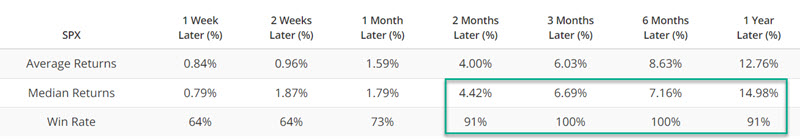
The critical thing to note is the 100% Win Rates for 3-month and 6-month periods. 2-month and 1-Year periods show a Win Rate above 90%, and the 1-Year Median Return has been 14.98%.

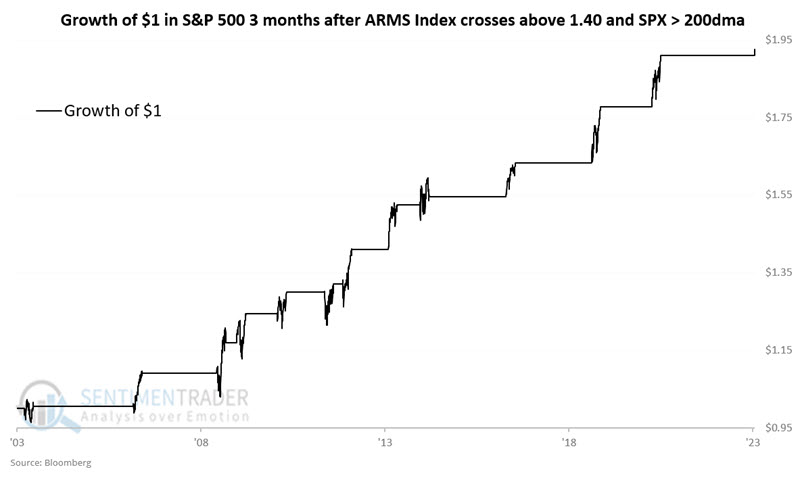
To put results into another perspective, the chart below displays the hypothetical growth of $1 invested in the S&P 500 Index for three months after each signal date listed in the table above. The "lower left to upper right" nature of the equity curve is evident.

What the research tells us…

As always, no one indicator serves as the be-all, end-all of trading. Likewise, high historical Win Rates never guarantee future success. As such, the recent signal from the NYSE ARMS Index should be viewed as a favorable weight of the evidence arguing for a continuation of the bull market in the months ahead.

PRODUCTS
SentimenTrader
Trading Tools
Indicators & Data API
‍
Strategies & Scanner
‍
Research Reports
FREE
RESOUrCES
Simple Backtest
Calculator
Simple Seasonality
Calculator
The Kelly Criterion
Calculator
Sentiment Geo Map
‍
Public Research Reports
‍
Education
Sentiment Indicators
‍
Technical Indicators
‍
Pricing
Bundle pricing
‍
FAQ
‍
Announcements
‍
COMPANY
‍
About
‍
In the News
‍
Testimonials
‍
Client Success Stories
CONTACT
‍
General Inquiries
‍
Media Inquiries
‍
Financial Professionals Inquiries
‍
© 2026 Sundial Capital Research Inc. All rights reserved.
Setsail Marketing
TermsPrivacyAffiliate Program
Risk Disclosure: The information and tools provided are for research and analytical purposes only and are not intended as investment advice. Market analysis involves uncertainty, and outcomes may differ from expectations. Users should conduct their own due diligence and consider their individual circumstances before making any financial decisions. Past performance is not necessarily indicative of future results.

Hypothetical Performance Disclosure: Hypothetical performance results have many inherent limitations, some of which are described below. No representation is being made that any account will or is likely to achieve profits or losses similar to those shown; in fact, there are frequently sharp differences between hypothetical performance results and the actual results subsequently achieved by any particular trading program. One of the limitations of hypothetical performance results is that they are generally prepared with the benefit of hindsight. In addition, hypothetical trading does not involve financial risk, and no hypothetical trading record can completely account for the impact of financial risk of actual trading. for example, the ability to withstand losses or to adhere to a particular trading program in spite of trading losses are material points which can also adversely affect actual trading results. There are numerous other factors related to the markets in general or to the implementation of any specific trading program which cannot be fully accounted for in the preparation of hypothetical performance results and all which can adversely affect trading results.

Testimonial Disclosure: Testimonials appearing on this website may not be representative of other clients or customers and is not a guarantee of future performance or success.