Products
SentimenTrader Trading Tools
‍
Backtest Engine
My Trading Toolkit
Correlation Analysis
Seasonality
Indicators & Data API
‍
Proprietary Indicators & Charts
Market Data API
Strategies & Scanner
‍
50+ Trading Strategies
Smart Stock Scanner
Research Reports
‍
Research Solutions
Reports Library
Free Resources
Simple Backtest Calculator
Simple Seasonality Calculator
The Kelly Criterion Calculator
Sentiment Geo Map
Public Research Reports
Pricing
Company
About
In the News
Testimonials
Client Success Stories
Contact
Log inLoginSign up
< BACK TO ALL REPORTS

The value thesis

Troy Bombardia
2020-11-06
Growth continues to outperform value as some traders eye a repeat of the past 10 years.

Being 100% honest, I have no idea when tech stocks will underperform/outperform. Just because “value” outperformed in the past does not mean “value” will outperform in the future. Herein lies the biggest problem with factor investing: once a factor has become widely accepted as gospel truth, it usually stops working. But this won’t stop factor ETF companies from selling you their version of the gospel ????

One of the gospel truths these days is that “innovative tech companies will always beat non-innovative non-tech companies” and that “this bull market is still very young”.

For starters, bull markets do not die of age. They die of excess. This is why bull markets can range anywhere from a few months to a decade. Just because “the last bull market was 10 years” DOES NOT mean that the next one will be 10 years. The “next one” is almost never “like the last one”, even though humans have a very strong tendency to extrapolate recent events into the future.

With that being said, the strongest argument for why this bull market will not be like 2009-2020 is that valuations today are much higher than they were 10 years ago:

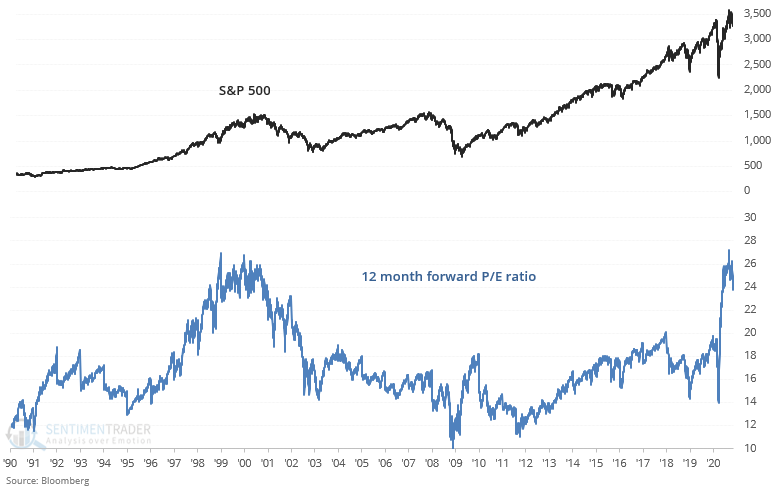
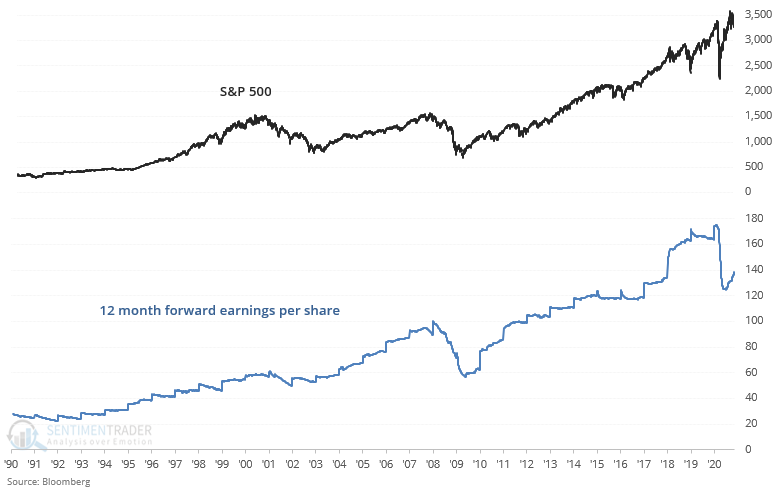
Granted, part of the jump in P/E is because forward earnings collapsed earlier this year. Earnings are now rising back up, meaning if that stock prices don’t move from here, forward P/E will still fall:

One may look at the above P/E ratio chart and think “P/E jumped as well in 2009! High P/E is perfectly normal for the start of an economic expansion!”. Well yes, that is normal. But not this high. Forward P/E today is a third higher than it was in 2009! Moreover, most of the “innovative” tech companies that IPO these days are not profitable. The smart insiders are unloading their high valuations onto public markets.

In my opinion, the next 5 years will be very choppy for markets. Years of high volatility is perfectly normal – something that public market investors outside of the U.S. are completely used to.

So what does this mean? What worked in the past will not work in the future. Trend following and momentum might have been fantastic over the past 2 years – years in which the market went straight up and straight down. But in a choppy market, trend followers are badly hurt by a thousand small losses. In other words, do not blindly follow your trading strategy in all market environments. Nothing works forever.

On that note, here’s the Russell 1000 Value/Growth ratio:

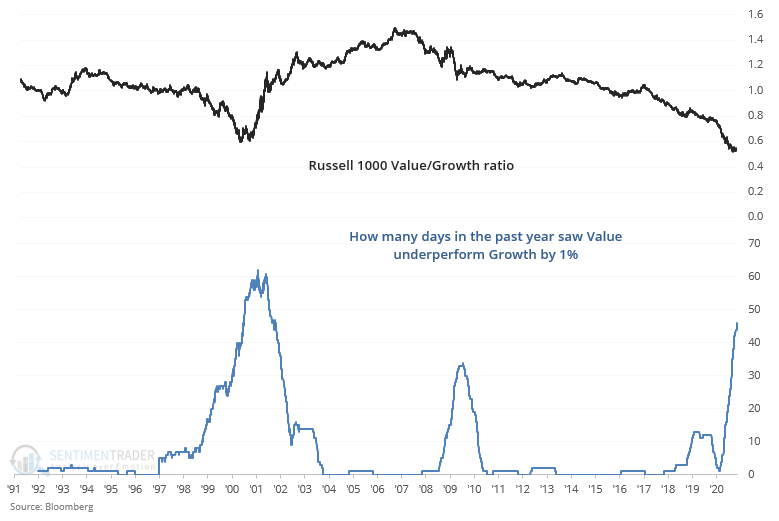
The # of days over the past year in which Value significantly underperformed Growth is on par with that of 2000. Does that mean today is “just like 2000 all over again”? No. It just means that value *could* outperform the future. But I’m not willing to bet on that.

Sorry, you don't have access to this report

Upgrade your subscription plan to get access
Go to Dasboard
PRODUCTS
SentimenTrader
Trading Tools
Indicators & Data API
‍
Strategies & Scanner
‍
Research Reports
FREE
RESOUrCES
Simple Backtest
Calculator
Simple Seasonality
Calculator
The Kelly Criterion
Calculator
Sentiment Geo Map
‍
Public Research Reports
‍
Pricing
Bundle pricing
‍
Announcements
‍
FAQ
COMPANY
‍
About
‍
In the News
‍
Testimonials
‍
Client Success Stories
CONTACT
‍
General Inquiries
‍
Media Inquiries
‍
Financial Professionals Inquiries
‍
© 2025 Sundial Capital Research Inc. All rights reserved.
Setsail Marketing
TermsPrivacyAffiliate Program
Risk Disclosure: Futures and forex trading contains substantial risk and is not for every investor. An investor could potentially lose all or more than the initial investment. Risk capital is money that can be lost without jeopardizing ones’ financial security or life style. Only risk capital should be used for trading and only those with sufficient risk capital should consider trading. Past performance is not necessarily indicative of future results.

Hypothetical Performance Disclosure: Hypothetical performance results have many inherent limitations, some of which are described below. No representation is being made that any account will or is likely to achieve profits or losses similar to those shown; in fact, there are frequently sharp differences between hypothetical performance results and the actual results subsequently achieved by any particular trading program. One of the limitations of hypothetical performance results is that they are generally prepared with the benefit of hindsight. In addition, hypothetical trading does not involve financial risk, and no hypothetical trading record can completely account for the impact of financial risk of actual trading. for example, the ability to withstand losses or to adhere to a particular trading program in spite of trading losses are material points which can also adversely affect actual trading results. There are numerous other factors related to the markets in general or to the implementation of any specific trading program which cannot be fully accounted for in the preparation of hypothetical performance results and all which can adversely affect trading results.

Testimonial Disclosure: Testimonials appearing on this website may not be representative of other clients or customers and is not a guarantee of future performance or success.