Products
SentimenTrader Trading Tools
‍
Backtest Engine
My Trading Toolkit
Correlation Analysis
Seasonality
Market Prediction
Indicators & Data API
‍
Proprietary Indicators & Charts
Market Data API
Strategies & Scanner
‍
50+ Trading Strategies
Smart Stock Scanner
Smart Option Scanner
Research Reports
‍
Research Solutions
Reports Library
Free Resources
Simple Backtest Calculator
Simple Seasonality Calculator
The Kelly Criterion Calculator
Sentiment Geo Map
Public Research Reports
Education
Sentiment Indicators
Technical Indicators
Pricing
Company
About
In the News
Testimonials
Client Success Stories
Contact
Log inLoginSign up
< BACK TO ALL REPORTS

The Utility sector signals risk-on

Dean Christians
2024-05-29
A trading model that measures relative performance trends between utility stocks and the broad market to identify periods when investors' risk appetite shifted from risk-off to risk-on triggered a new buy signal. Similar alerts displayed excellent returns and win rates for the world's most benchmarked index.

Key points:

  • Following a notable spike in outperformance, relative trends for the utility sector suddenly collapsed 
  • Similar shifts in relative performance for the defensive-oriented group often foreshadow a risk-on backdrop
  • Utilities and other defensive groups underperform the broad market and more aggressive sectors

The Utility sector signals a shift in investors' risk appetite 

During periods of market turbulence, investors frequently gravitate toward the utility sector, strategically positioning their portfolios defensively to cushion potential losses. As market fears subside, they tend to move away from utilities' perceived safety, seeking opportunities in more aggressive groups.

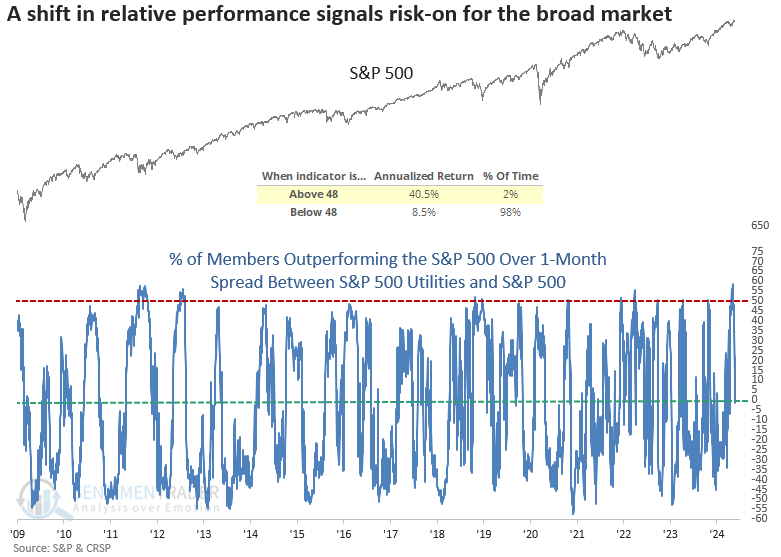
To capture this shift in investors' risk appetite, I calculate the difference between the percentage of S&P 500 Utility sector members outperforming the S&P 500 Index and the percentage of overall S&P 500 members outperforming the Index on a rolling one-month basis. 

During the April drawdown, this spread surged to the 19th-highest level ever recorded, a peak not observed since 1990.

A component in the TCTM Composite Master New Bull Market Model triggered a new alert when the spread cycled from above 48% to below 0%. The previous signal occurred in November 2023, leading to a 20% rally in the S&P 500 over six months.

Similar shifts in utility relative performance preceded positive returns

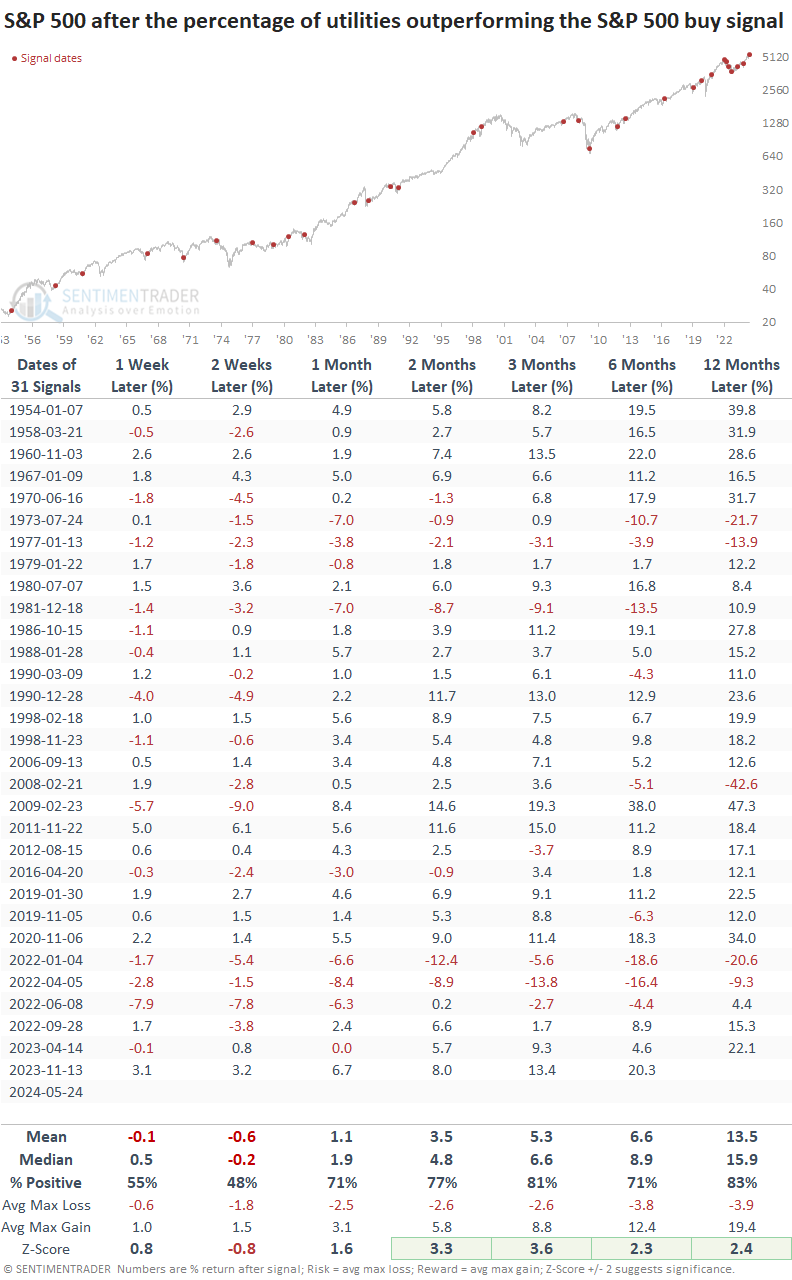
Whenever the spread between S&P 500 Utility sector stocks outperforming the S&P 500 and all S&P 500 stocks outperforming the benchmark cycled from greater than 48% to less than 0%, the world's most benchmarked index displayed some short-term weakness, likely due to volatility that usually accompanies a transition out of a drawdown period.

Once the near-term sluggishness subsided, the outlook for the S&P 500 was excellent, with performance showing significance relative to random returns from two to twelve months later.

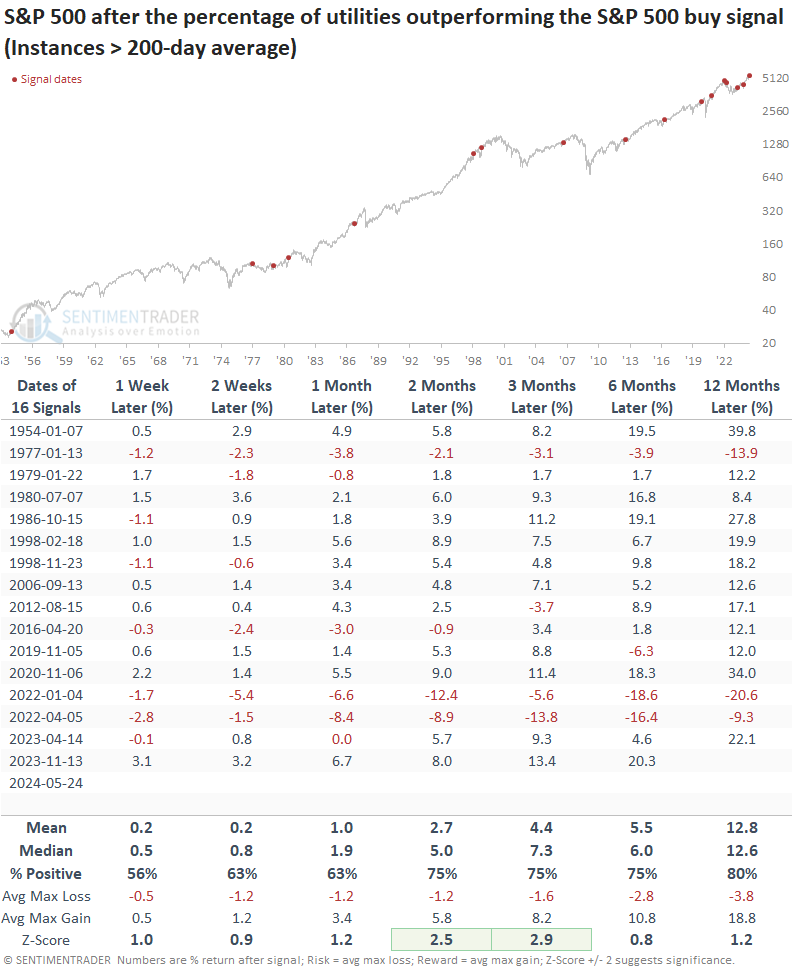
Precedents that were triggered when the S&P 500 traded above its 200-day average, context similar to now, displayed solid returns and consistency, notwithstanding the signals at the outset of the 2022 bear market.

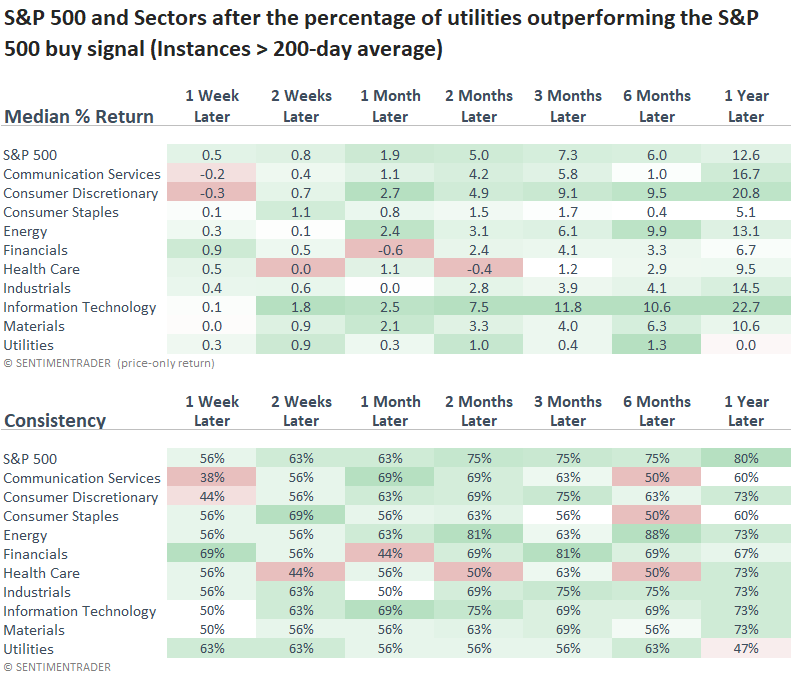
As expected, Utilities and other defensive sectors underperform relative to the S&P 500 and more aggressive groups like Technology and Consumer Discretionary. 

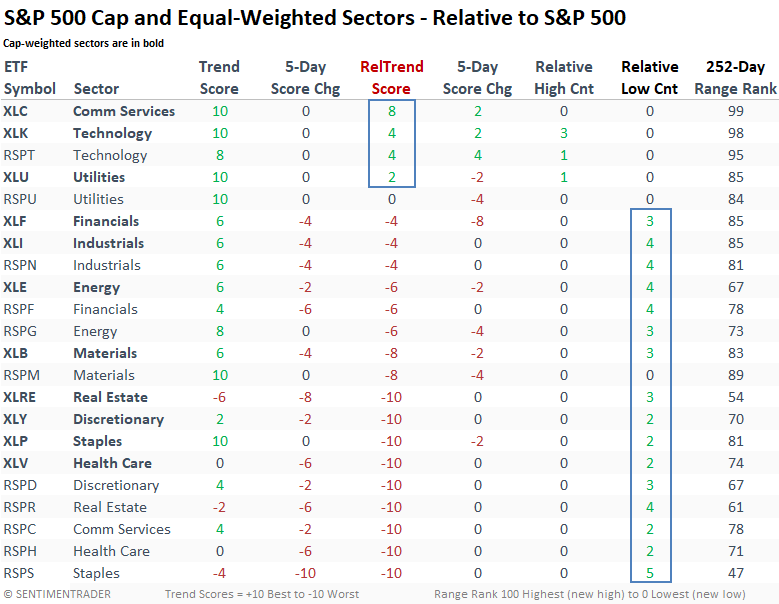
Absolute and relative trend scores

Following risk-on signals from Utilities, the Technology sector was the best-performing sector a year later, which aligns with present-day relative trend scores on both a cap and equal-weighted basis. 

What the research tells us...

Typically, the traditionally defensive utility sector outperforms the S&P 500 during a market correction. A trading model that measures the one-month rolling return spread between S&P 500 Utility stocks and all S&P 500 stocks increased to one of the highest levels in history and subsequently collapsed, triggering a risk-on signal for the broad market. Similar shifts in investors' risk appetite sometimes led to choppy conditions in the first few weeks, a regular occurrence for a market in transition. Investors who took advantage of this backing and filling to boost their market exposure reaped the rewards, as medium and long-term returns for the world's most benchmarked index were outstanding. From a relative perspective, defensive groups underperformed offensive-oriented ones.

PRODUCTS
SentimenTrader
Trading Tools
Indicators & Data API
‍
Strategies & Scanner
‍
Research Reports
FREE
RESOUrCES
Simple Backtest
Calculator
Simple Seasonality
Calculator
The Kelly Criterion
Calculator
Sentiment Geo Map
‍
Public Research Reports
‍
Education
Sentiment Indicators
‍
Technical Indicators
‍
Pricing
Bundle pricing
‍
FAQ
‍
Announcements
‍
COMPANY
‍
About
‍
In the News
‍
Testimonials
‍
Client Success Stories
CONTACT
‍
General Inquiries
‍
Media Inquiries
‍
Financial Professionals Inquiries
‍
© 2026 Sundial Capital Research Inc. All rights reserved.
Setsail Marketing
TermsPrivacyAffiliate Program
Risk Disclosure: The information and tools provided are for research and analytical purposes only and are not intended as investment advice. Market analysis involves uncertainty, and outcomes may differ from expectations. Users should conduct their own due diligence and consider their individual circumstances before making any financial decisions. Past performance is not necessarily indicative of future results.

Hypothetical Performance Disclosure: Hypothetical performance results have many inherent limitations, some of which are described below. No representation is being made that any account will or is likely to achieve profits or losses similar to those shown; in fact, there are frequently sharp differences between hypothetical performance results and the actual results subsequently achieved by any particular trading program. One of the limitations of hypothetical performance results is that they are generally prepared with the benefit of hindsight. In addition, hypothetical trading does not involve financial risk, and no hypothetical trading record can completely account for the impact of financial risk of actual trading. for example, the ability to withstand losses or to adhere to a particular trading program in spite of trading losses are material points which can also adversely affect actual trading results. There are numerous other factors related to the markets in general or to the implementation of any specific trading program which cannot be fully accounted for in the preparation of hypothetical performance results and all which can adversely affect trading results.

Testimonial Disclosure: Testimonials appearing on this website may not be representative of other clients or customers and is not a guarantee of future performance or success.