
The U.S. Dollar is at the crossroads

Key Points
- The U.S. Dollar is attempting to break through a significant zone of price resistance - one that it has spent very little time above in the past 36 years
- Dollar Seasonality is presently unfavorable
- Dollar Optix is reaching a potential turning point
- Where the dollar goes from here can have a profound impact across the financial markets, particularly in the case of commodities
Price
The chart below (courtesy of Barchart.com) displays U.S. dollar futures back to 1986. Note that over 36 years, the price of the dollar has traded above 106 only about 7.8% of the time.
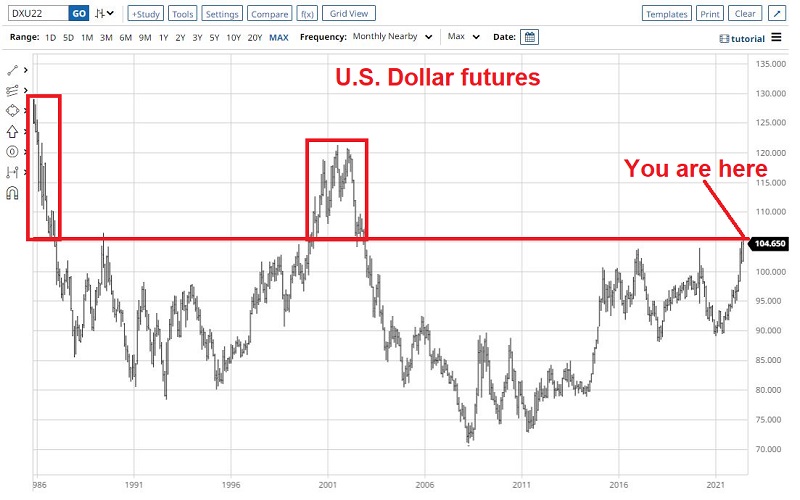
Intuitively, one might view this chart as a negative for the dollar - i.e., "it is running into resistance that it probably won't break through." But there is no prediction implied here. We are merely pointing out that:
- Yes, it is a significant hurdle for the dollar to clear
- If it DOES trade above 106, we are entering into rarified air
A sharply rising or falling U.S. dollar can have a broad ripple effect across the financial markets and world economy. At the very least, an upside breakout would likely cause commodities to cool off dramatically from their torrid pace of the last several years. Conversely, commodities could be off to the races again if the dollar breaks down - especially if high inflation persists.
Seasonality
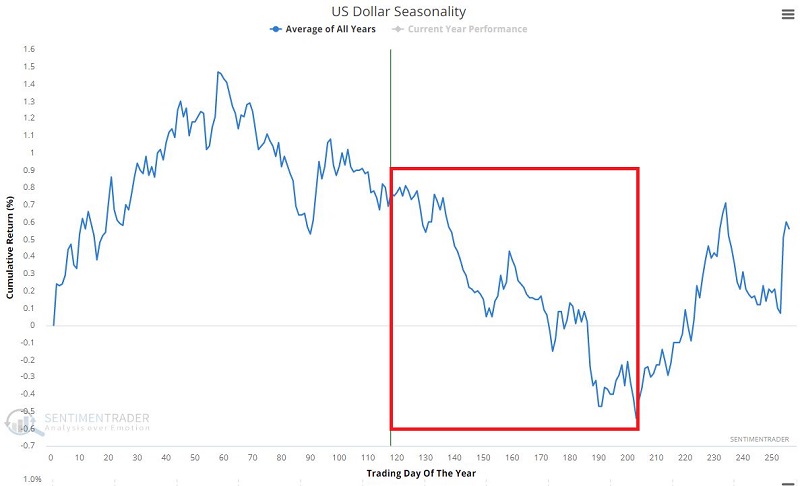
The chart below displays the annual seasonal trend for U.S. dollar futures. Note that the traditional period of seasonal weakness began a while ago - and extends through Trading Day of the Year (TDY) #203 (10/20/2022).
So far in 2022, the dollar has been robust, as shown in the chart below.
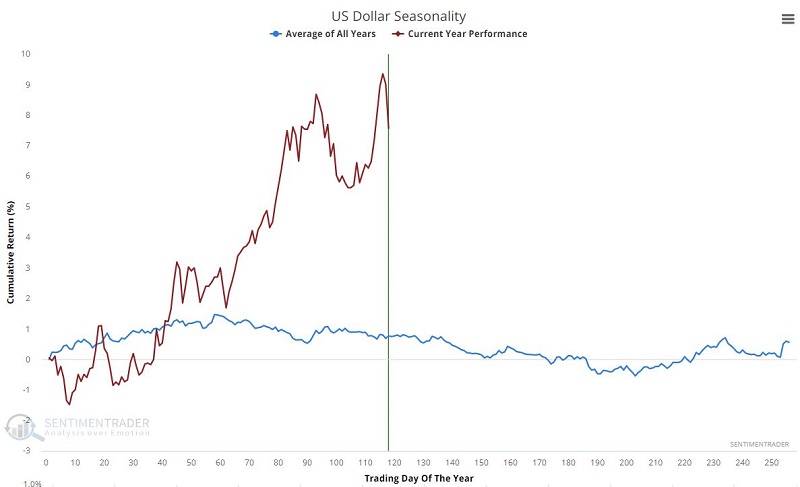
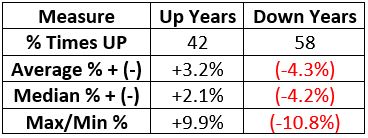
As discussed above, this strength may continue if the price breaks out to the upside. However, severe weakness may follow if the dollar does not break out to the upside. The chart below displays the cumulative % gain/loss for the U.S. dollar held long only from TDY #118 through TDY #203 each year starting in 1987.
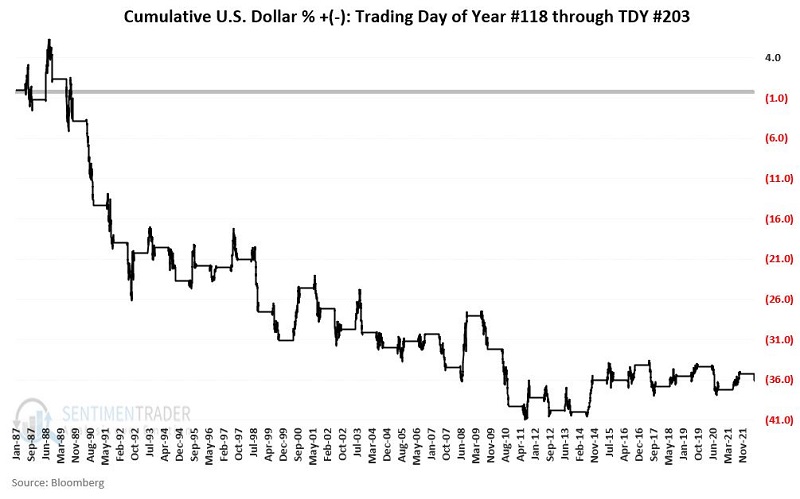
The table below summarizes the dollar's performance during this period.
Sentiment
The 50-day average for the U.S. Dollar Optix indicator just crossed above 72 for just the fifth time in the past 17 years. The chart below displays those occurrences.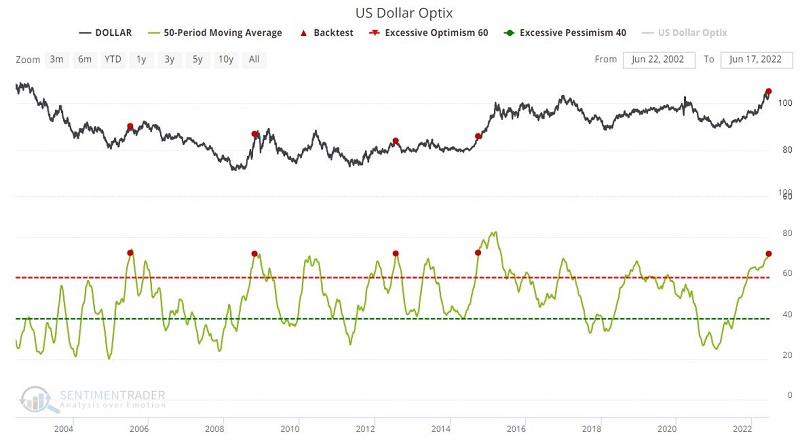
The table below displays a summary of U.S. Dollar performance following previous signals.
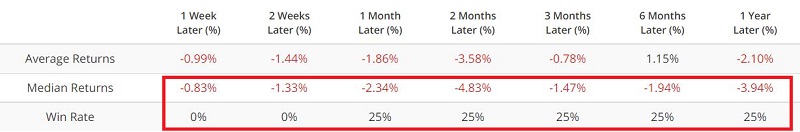
This is a tiny sample size, so it isn't easy to draw solid conclusions. Nevertheless, this does argue for the potential for price weakness if the dollar fails to break out above the price resistance level discussed above.
What the research tells us…
The stars "seem" to be aligning for a period of weakness for the U.S. Dollar. Seasonal weakness combined with overly bullish sentiment can be a very powerful drag on the price of any tradeable asset. Nevertheless, in the markets, price is king. All bets are off if the dollar breaks to the upside above 105/106. However, the longer the dollar goes without breaking out, the more likely the other seasonal and sentiment factors will weigh on the dollar - with the potential for significant weakness as the year progresses.