
The U.S. Dollar as a gold indicator

Key points
- Gold and the U.S. Dollar tend to move in an inverse fashion
- Gold appears to perform much better when it is outperforming the U.S. Dollar
- The current trend of this "weight of the evidence" indicator remains favorable for gold
Data used for testing
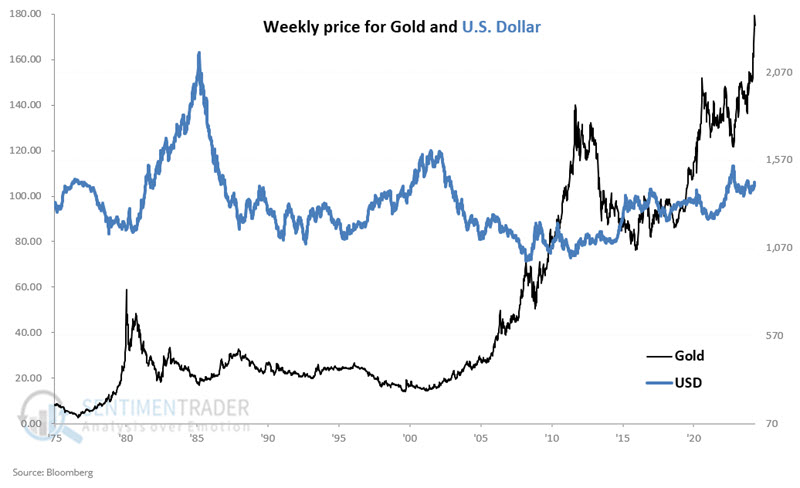
We will use weekly gold and U.S. Dollar (USD) futures data collected from Bloomberg for testing. The first week of data for each series was 1975-01-03. The chart below displays weekly prices for gold and USD over the past 49+ years. Note that the correlation coefficient for the two series is -0.28, meaning they tend to have an inverse relationship.
The Gold/USD Ratio
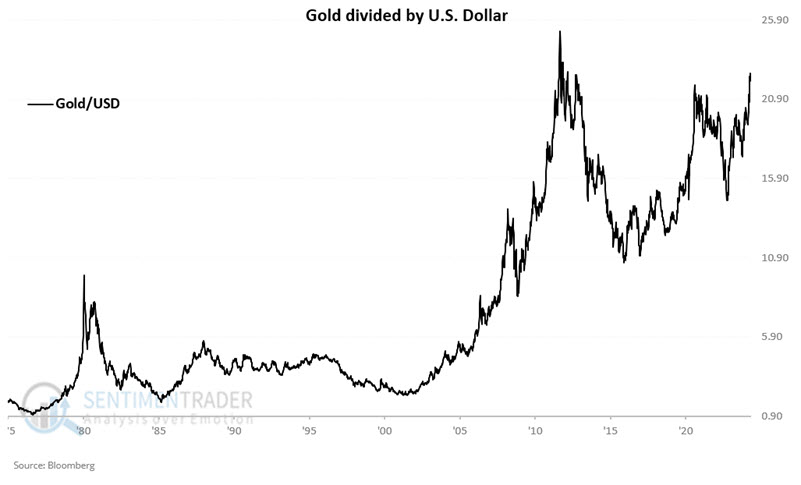
The chart below divides the price of gold futures by the price of USD futures every week since 1975. When the ratio rises, gold is outperforming USD and vice versa.
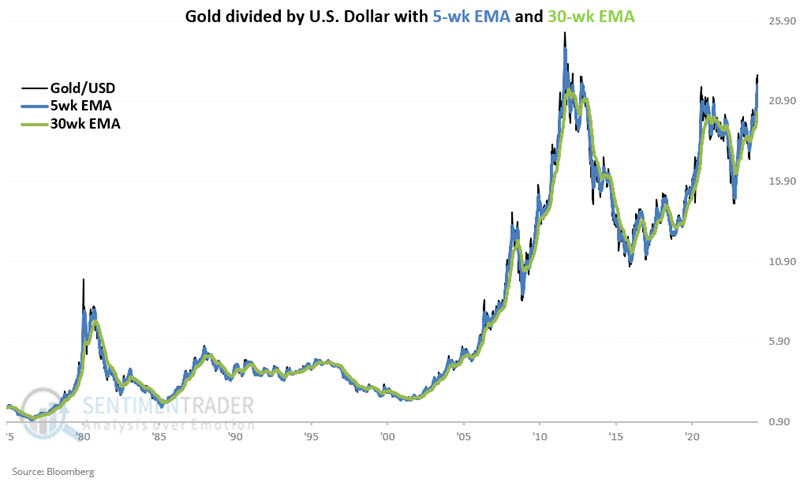
To objectively designate a trend for the ratio in the chart above, we will add a 5-week exponential moving average (blue line) and a 30-week exponential moving average (green line), as shown in the chart below.
Next, we subtract the 30-week EMA value from the 5-week EMA value, as shown in the chart below.
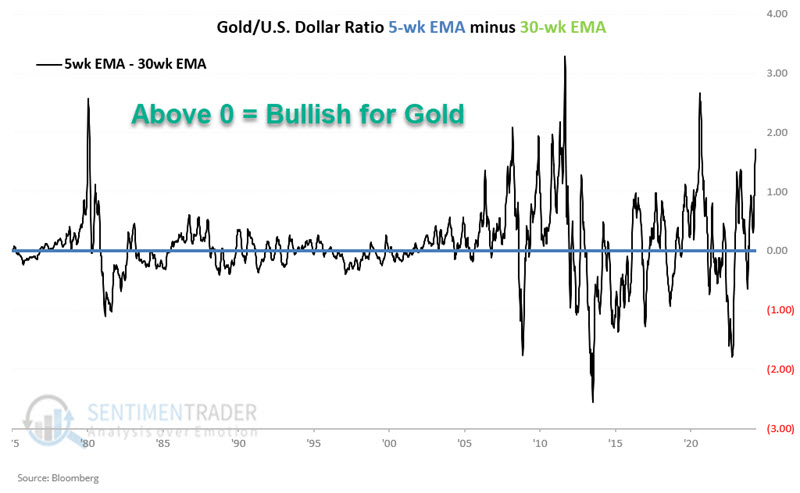
When the value in the chart above is greater than 0 (i.e., when the 5-week EMA is greater than the 30-week EMA), the Gold/USD Ratio is designated as "favorable" for gold. When the value in the chart above is less than 0, the Gold/USD Ratio is defined as "unfavorable" for gold.
Gold performance based on favorable and unfavorable readings
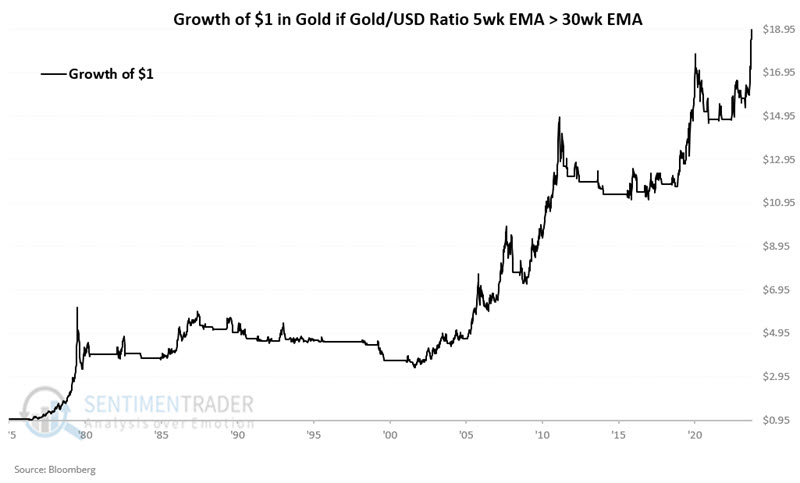
The chart below displays the hypothetical growth of $1 invested in gold only when the value in the chart above is greater than 0 (i.e., the 5-week EMA of the Gold/USD Ratio is above the 30-week EMA). $1 invested in this manner grew to $18.49, or +1,749.4%.
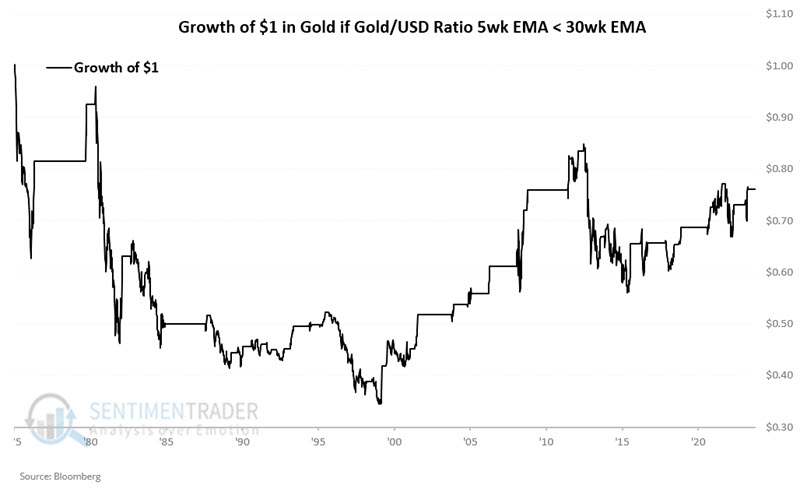
On the other hand, the chart below displays the hypothetical growth of $1 invested in gold only when the value in the chart above is less than 0 (i.e., the 5-week EMA of the Gold/USD Ratio is below the 30-week EMA). $1 invested in this manner shrank to $0.76, or 24.0%.
GLD as an ETF Alternative
The most straightforward alternative for non-futures traders is a gold ETF such as the SPDR Gold Shares Trust (ticker GLD), which started trading in 2004. The black line in the chart below displays the hypothetical growth of $1 invested in GLD only when the Gold/USD indicator above is "favorable." The blue line in the chart below displays the hypothetical growth of $1 invested in GLD only when the Gold/USD indicator above is "unfavorable."
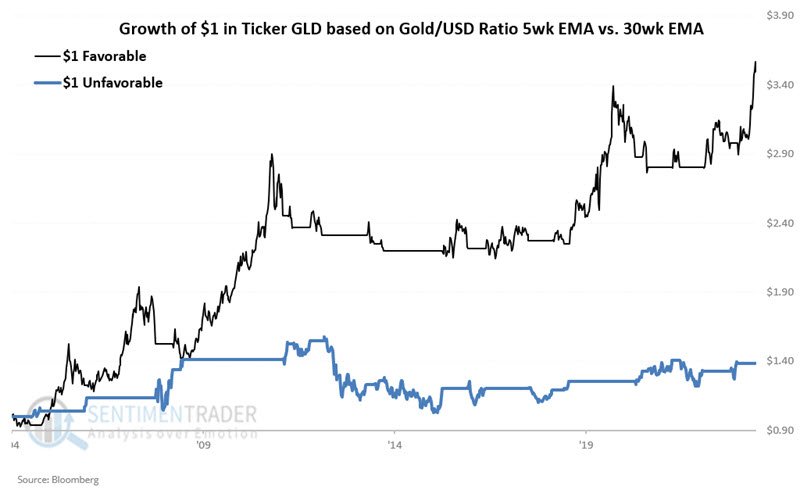
Since November 2004, GLD has gained +249.5% when the indicator was "favorable" and just +38.4% when the indicator was "unfavorable."
The most recent signal was favorable when the 5-week EMA crossed above the 30-week EMA on 2023-11-03. Through 2024-04-29, GLD has gained +17.2%.
What the research tells us…
The play between gold and the U.S. Dollar can be useful because gold and the U.S. Dollar are inversely correlated. As the results above demonstrate, gold performs much better when gold outperforms the U.S. Dollar. That said, the indicator above is not suggested as a standalone trading model. Nevertheless, it does appear to be quite helpful as part of a "weight of the evidence" approach to investing in gold. This particular piece of evidence remains a favorable factor for gold.