
The upward momentum of homebuilders

Key points
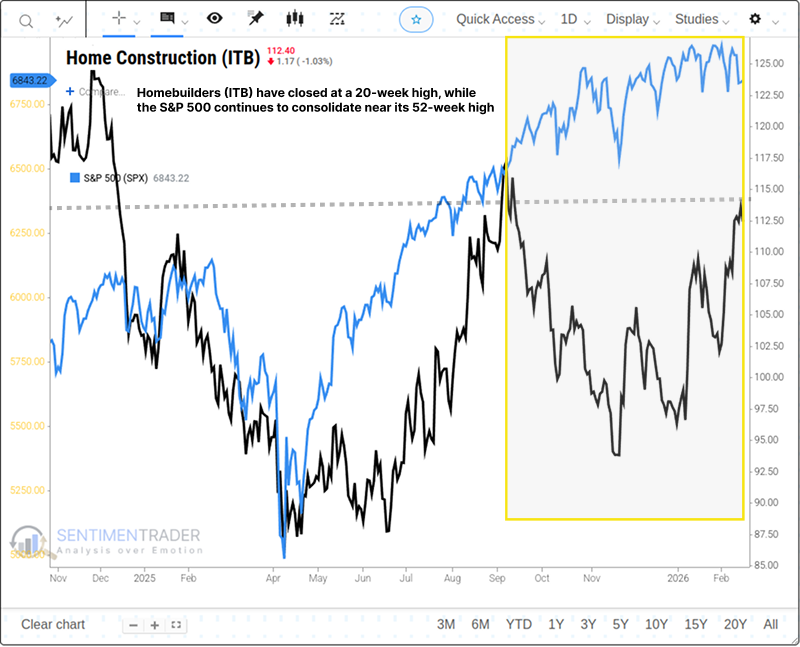
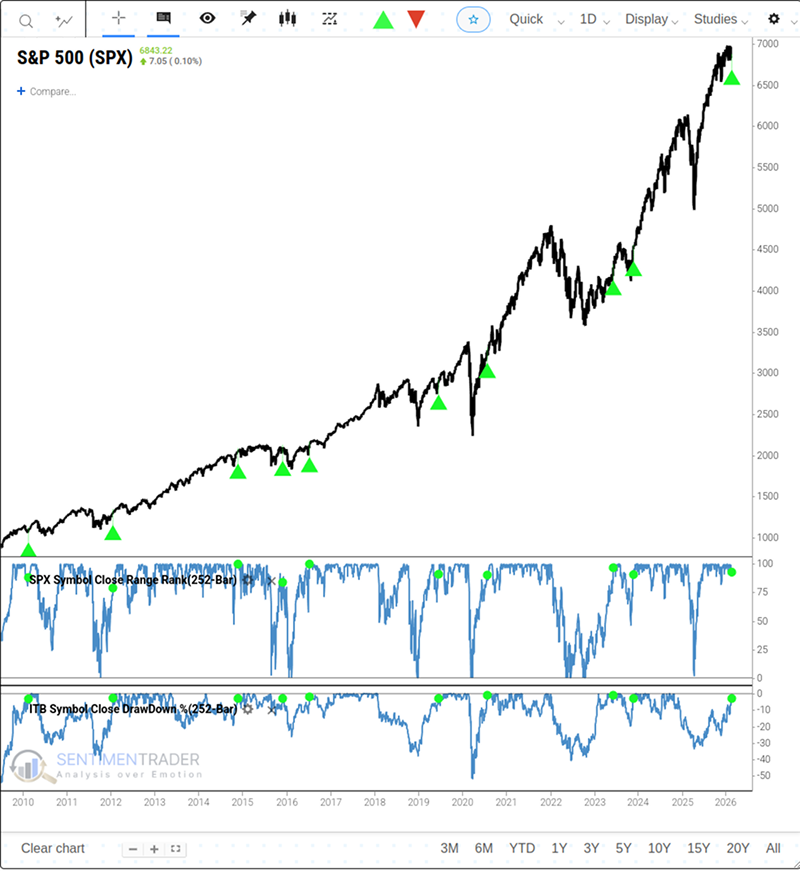
- Homebuilders (ITB) have closed at a 20-week high, while the S&P 500 continues to consolidate near its 52-week high.
- Historically, when Homebuilders rally near their highs while the broader market holds firm in its upper range, it signals a high probability of further gains for the sector (89% win rate).
- This specific setup-cyclical strength underneath a steady broad market-has historically been a perfect bullish signal for the S&P 500 over the subsequent 12 months.
Homebuilders advance while the market holds firm
Directly buoyed by last week's moderate CPI data (cooling inflation), the iShares U.S. Homebuilders ETF (ITB) closed above its 20-week high on Friday, resonating with the S&P 500 Index hovering near its 52-week peak. Despite the U.S. economy's structural shift toward asset-light operations, the rate-cut expectations triggered by receding inflation have precisely ignited the most interest-rate-sensitive sector of the real economy-homebuilders. The market is clearly pricing in a "real estate recovery amid low interest rates," and the key question now is: Can this recovery spill over to boost the broader macroeconomy?
Strength begets strength for Homebuilders
Whenever ITB closes within 3.5% of its 52-week high, while the S&P 500 maintains a position in the 90th percentile or higher of its own range (indicating high-level consolidation), ITB has historically shown a positive win rate. The chart below lists all dates when this signal occurred.
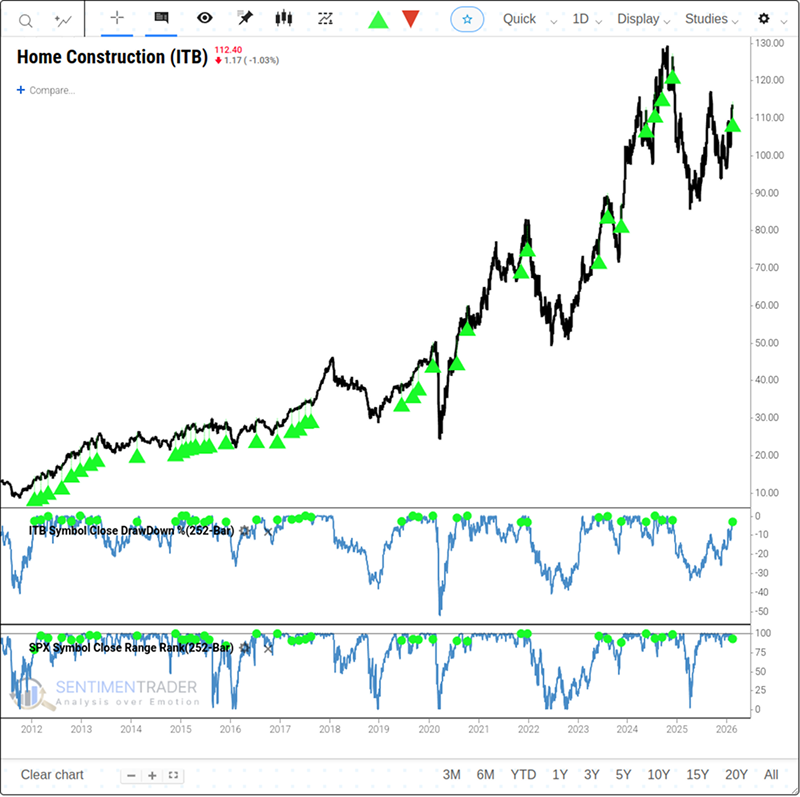
As we can see, win rates and returns tend to increase over time. For related backtest, click here.
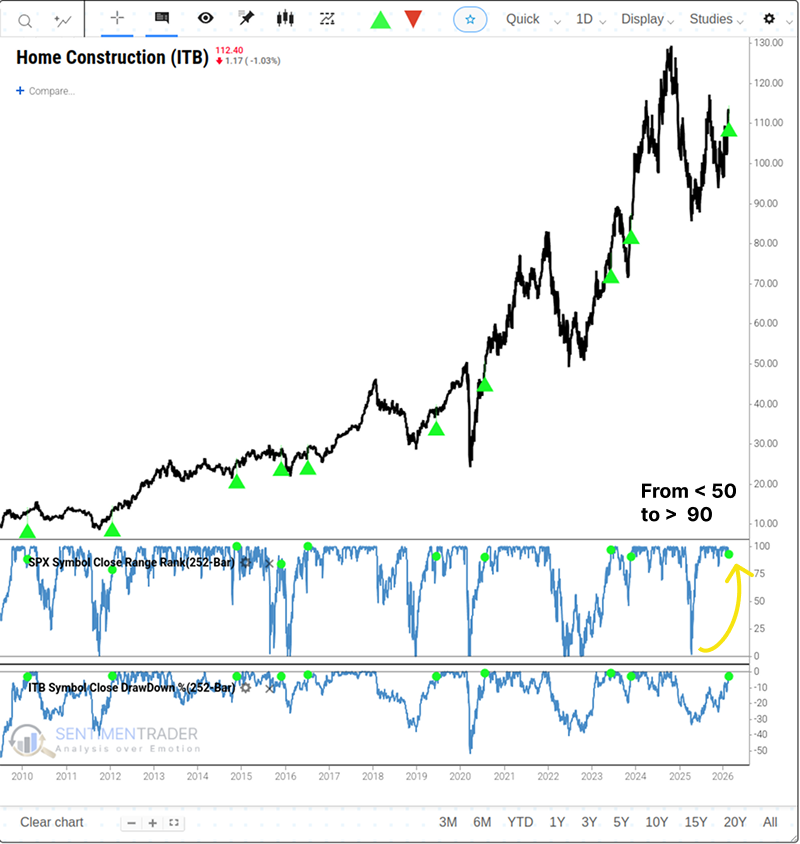
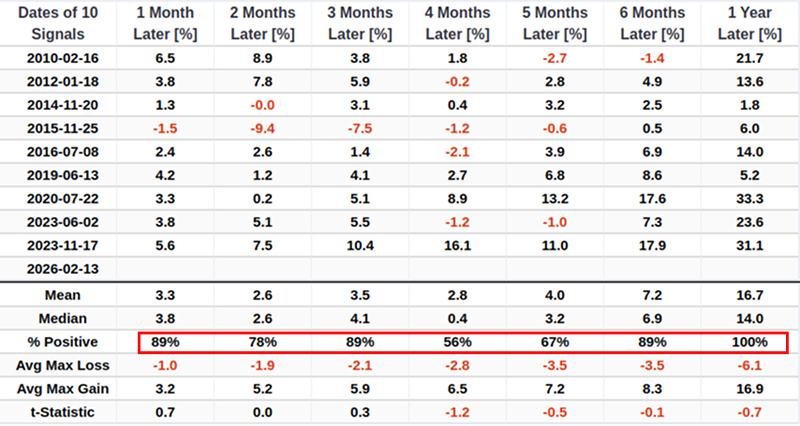
When we filter out duplicate signals by requiring the S&P 500's range rank to drop below 50% before a new alert can trigger, the signal's performance improves further.
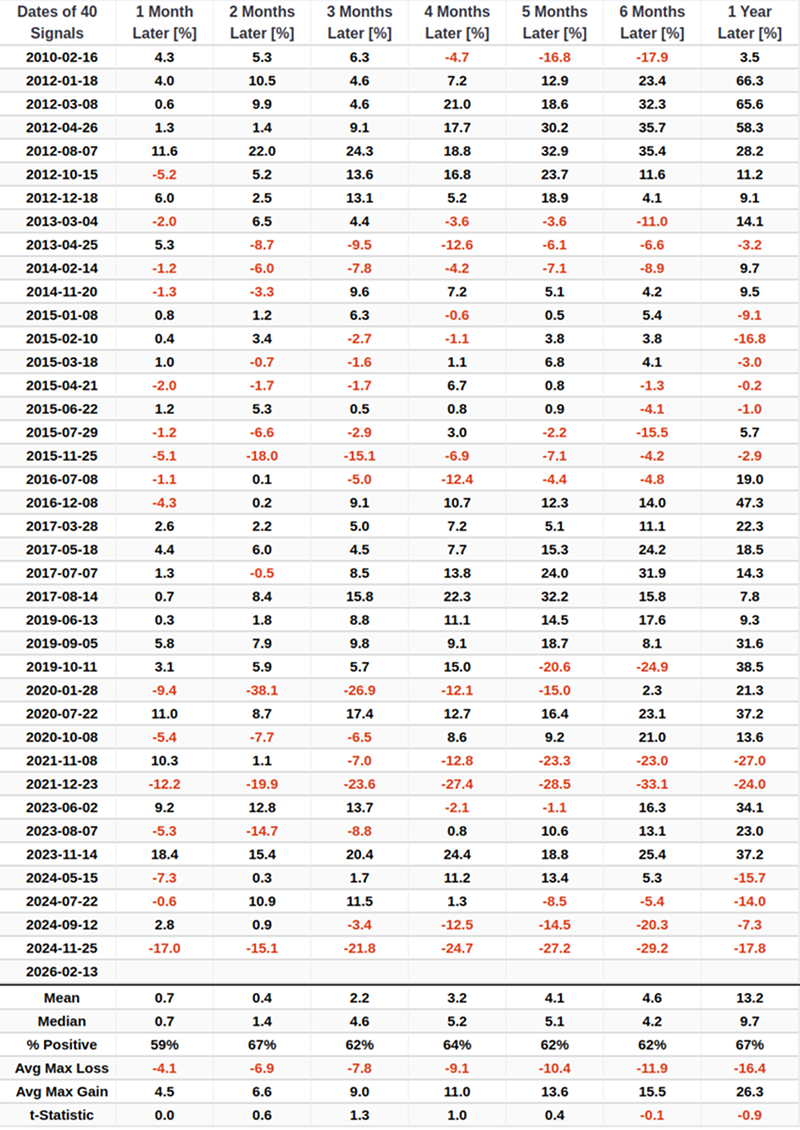
Although the sample size is small, the signal boasts an 89% win rate over the one-year timeframe.
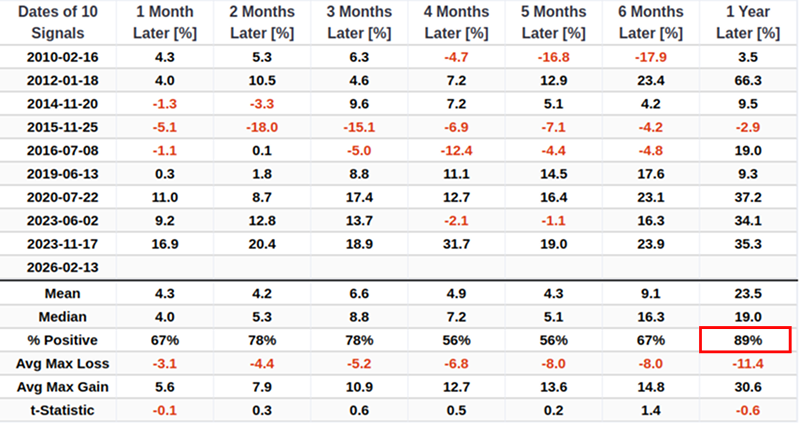
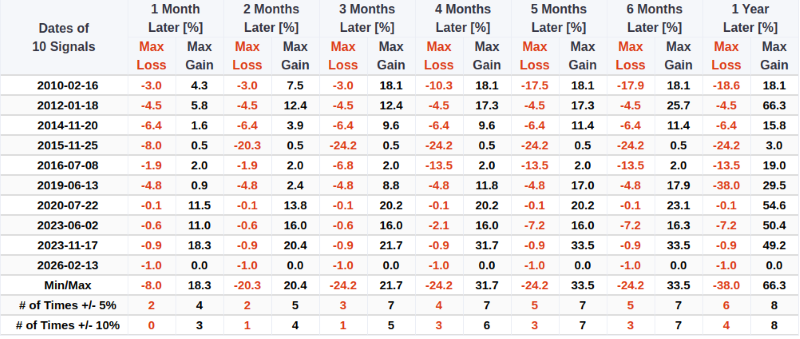
Over the 6-12 month window, this setup often delivers substantial upside potential (up to 66.3%), with the probability of significant gains far outweighing the risk of deep losses.
How about the S&P 500?
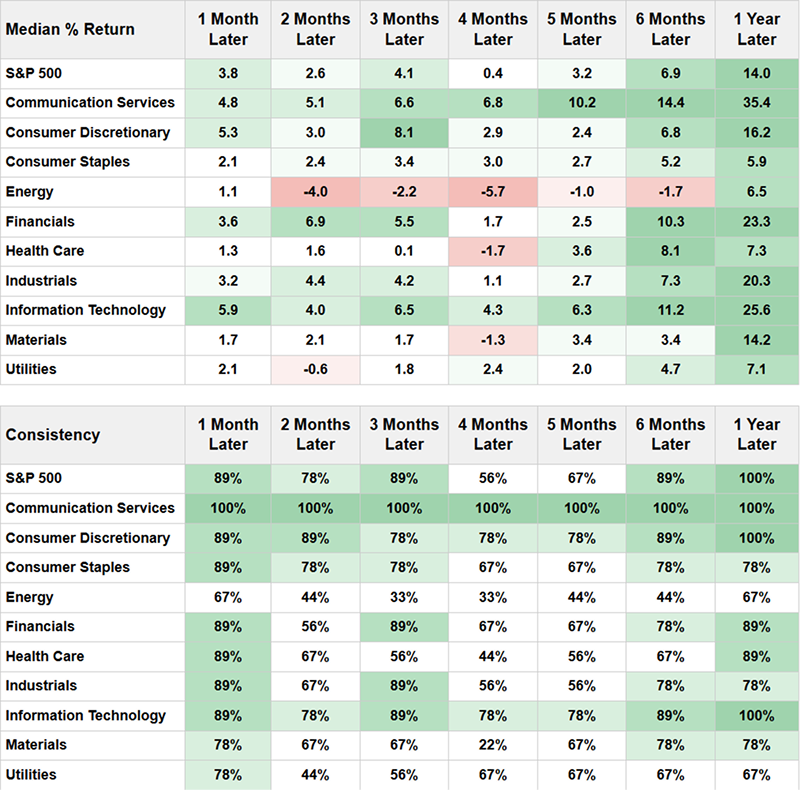
Similar rallies in ITB have often preceded or accompanied major advances in the broader market. The chart below shows the performance of the S&P 500 following this signal.
In the subsequent year, the world's most benchmarked index has maintained a perfect win rate.
Given the bright outlook for the broader market, it is not surprising to see cyclical sectors rallying and outperforming defensive sectors. The Financial sector, a key area for identifying potential market top issues, also shows a strong outlook and healthy trends.
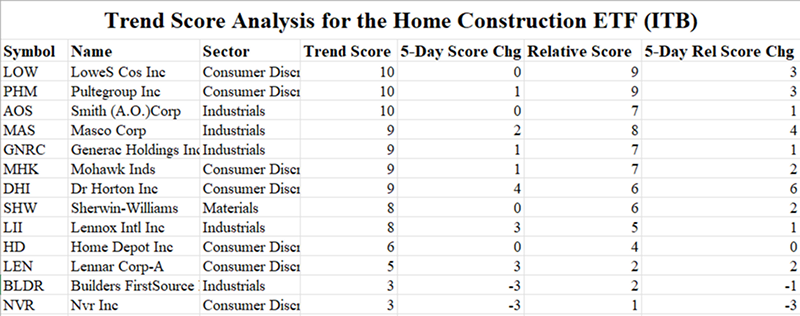
An favorable backdrop for stocks in the housing ecosystem
Analysis of trend and relative trend scores for select constituents of ITB indicates that most components exhibit favorable trends. Investors may be wise to pay attention to these stocks.
How can I recreate this signal in the Backtest Engine?
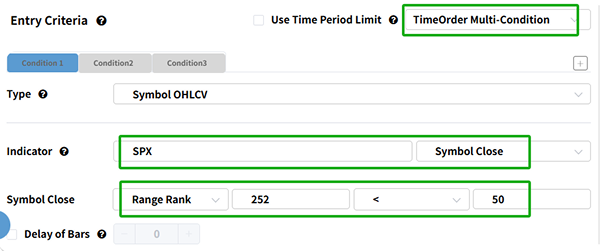
Complete the following tasks in the Entry Criteria section:
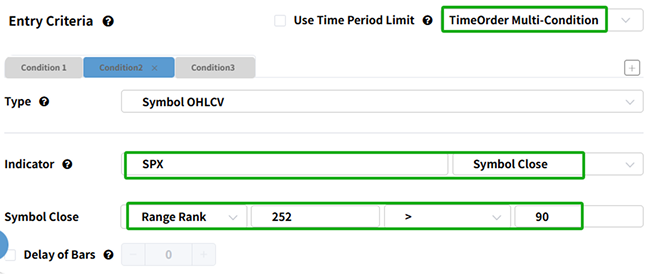
- Select TimeOrder Multi-Condition in the top right-hand corner and Select Symbol OHLCV.
- In the Indicator box, type SPX and select the Symbol Close.
- In the Symbol Close dropdown, set the Range Rank(252), select "<" and enter 50.
Click on the Condition2 tab and complete steps 2 from above. However, this time, select ">" and enter 90.
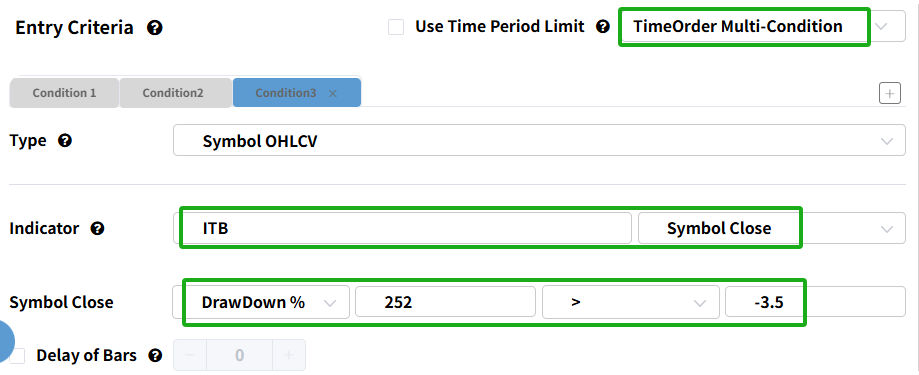
Click on the Condition3 tab and complete steps 1 from above.
- In the Indicator box, type ITB and select the Symbol Close.
- In the Symbol Close dropdown, set the DranDown %(252), select ">" and enter "-3.5".
Finally, click on the Run Backtest button.
What the research tells us...
The breakout of Homebuilders (ITB) to new local highs, occurring while the S&P 500 consolidates near its own peaks, serves as a powerful confirmation of market health. This specific interaction implies that underneath the broad market's steady surface, cyclical sectors are gathering momentum. Historically, when interest-rate-sensitive housing stocks surge while the broad market holds firm, it signals a favorable environment for equities over the next 6-12 months. With cyclical sectors outperforming defensives, the weight of evidence points to a continued bull market.