Products
SentimenTrader Trading Tools
‍
Backtest Engine
My Trading Toolkit
Correlation Analysis
Seasonality
Market Prediction
Indicators & Data API
‍
Proprietary Indicators & Charts
Market Data API
Strategies & Scanner
‍
50+ Trading Strategies
Smart Stock Scanner
Smart Option Scanner
Research Reports
‍
Research Solutions
Reports Library
Free Resources
Simple Backtest Calculator
Simple Seasonality Calculator
The Kelly Criterion Calculator
Sentiment Geo Map
Public Research Reports
Education
Sentiment Indicators
Technical Indicators
Pricing
Company
About
In the News
Testimonials
Client Success Stories
Contact
Log inLoginSign up
< BACK TO ALL REPORTS

The trend is your friend

Dean Christians
2023-07-05
A trend-following composite cycled from -10 to +10, triggering a bullish signal for the Consumer Discretionary and Industrials sectors. Similar composite trend model alerts led to positive returns that exceeded historical averages for both groups. With several other indexes and sectors having completed a bearish to bullish reversal, the trend is your friend.

Key points:

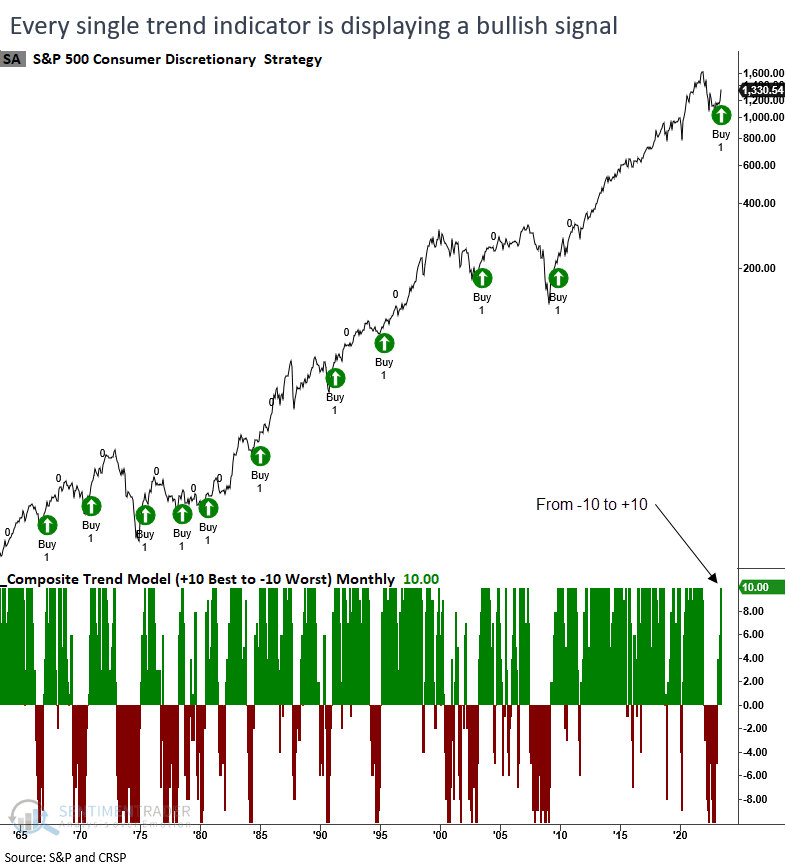
  • A trend-following composite cycled from -10 to +10, triggering a bullish signal for the Discretionary sector
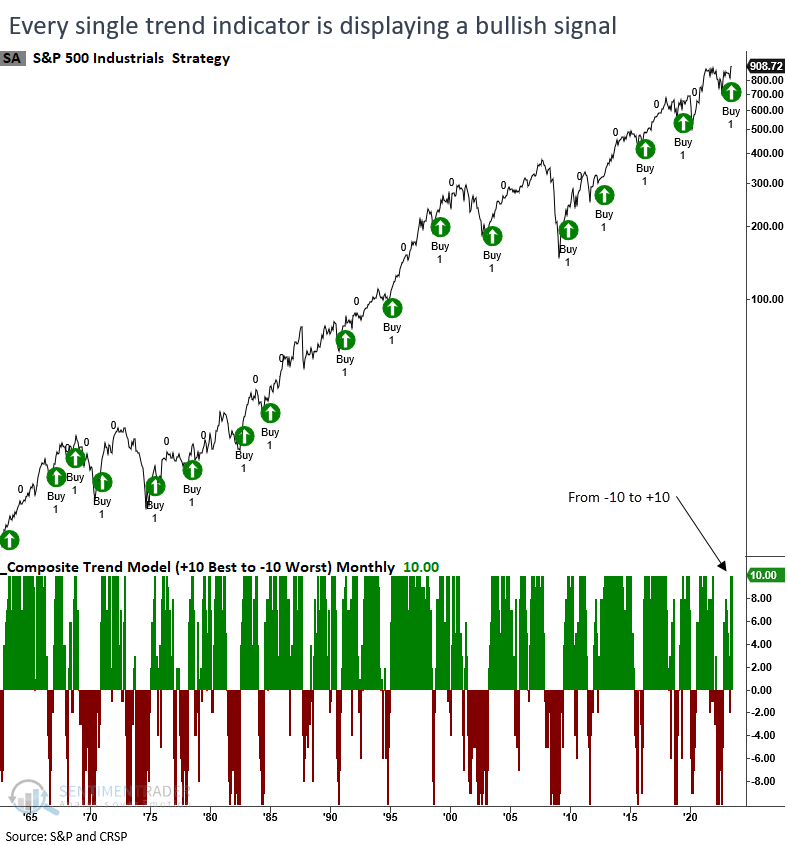
  • The same composite applied to the Industrials sector also registered a trend change reversal signal
  • Similar shifts in the trend-following composite led to above average returns for both sectors

Trend-following indicators are shifting to a bullish position

In a recent report, I highlighted a significant trend change reversal for the S&P 500, as indicated by a trend-following composite that ranges from a score of -10, worst, to +10, best. The system, a TCTM Composite Confirmation Model member, can be applied to any security to evaluate the strength or weakness of a trend based on ten indicators with varying durations.

With June coming to a close, the trend composite that assesses monthly data for the Consumer Discretionary and Industrials sectors completed a trend reversal signal when their respective scores cycled from -10 to +10, joining the bullish alert from S&P 500 that occurred in April.

With more and more indexes and sectors entering long-term uptrends, the weight of the evidence favors the bulls.

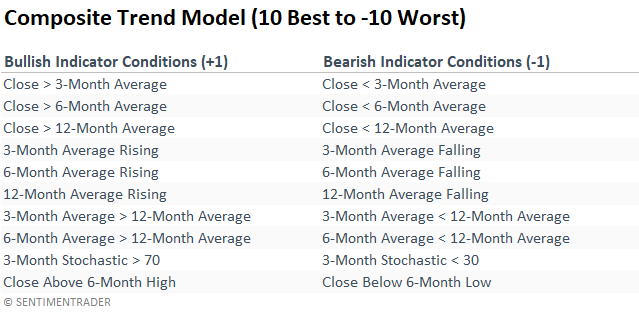
Composite construction

The composite assigns a score of +1 or -1 to each component in the model based on the following conditions.

Similar composite signals preceded positive returns

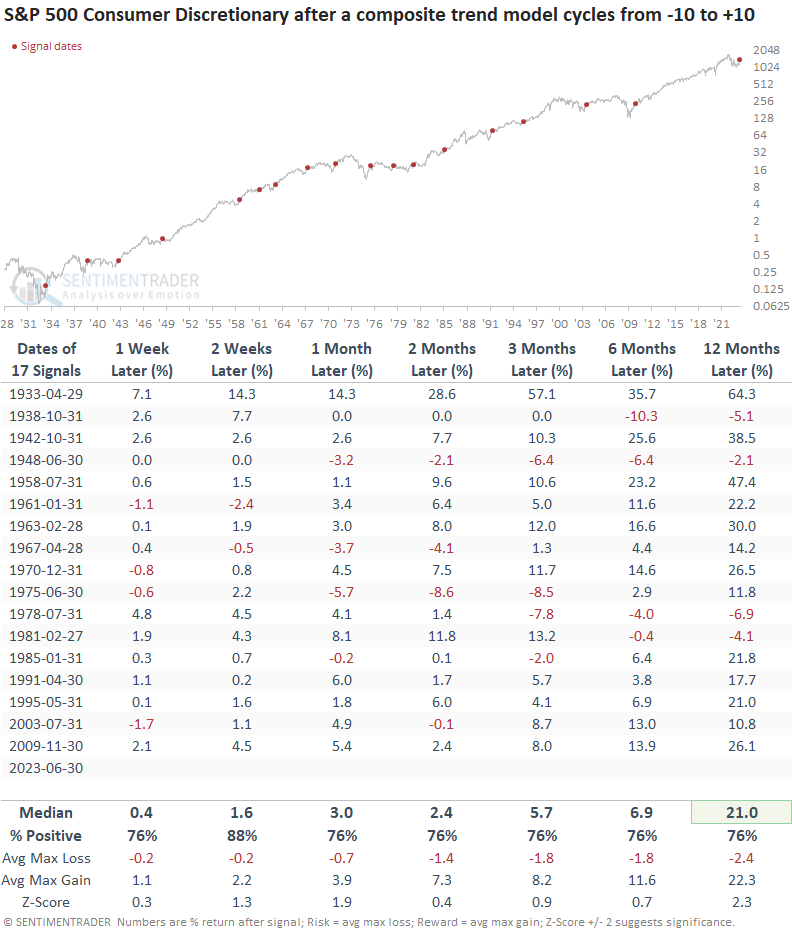
When the trend-following composite cycles from -10 to +10, the Consumer Discretionary sector rallies consistently across all time frames. And despite employing monthly data, which is less timely, the results consistently outperform average historical returns over all horizons.

Another cyclical sector with all ten indicators in a bullish position

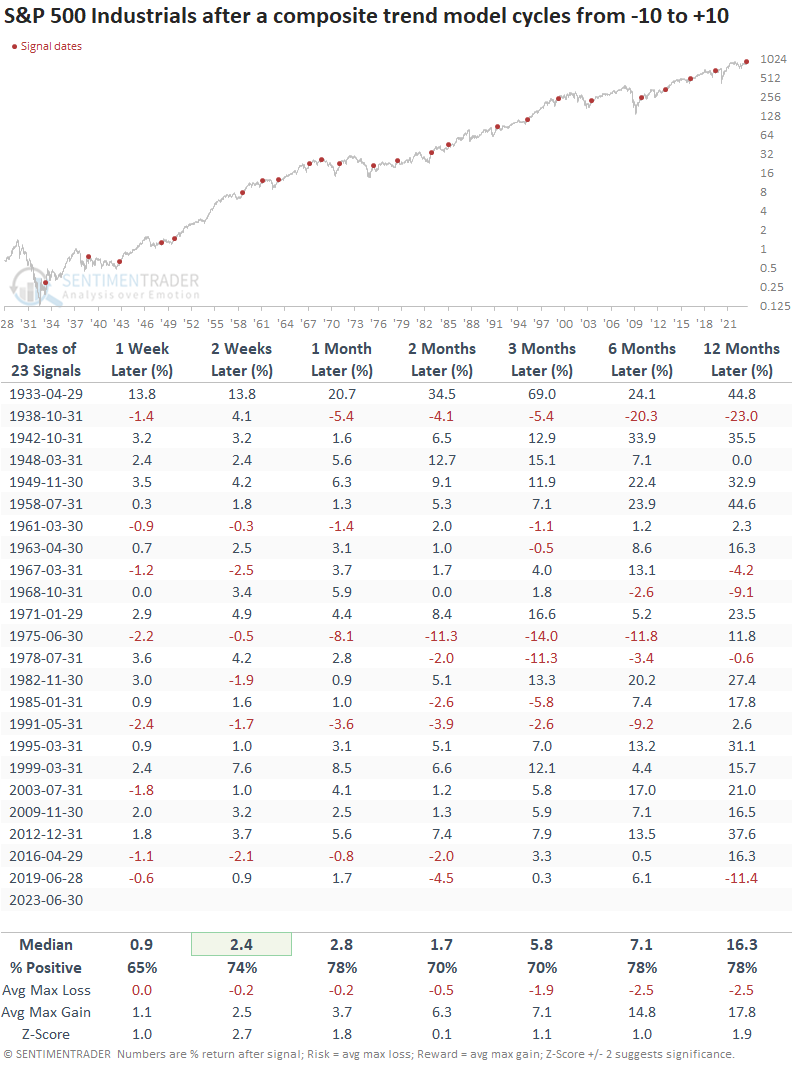
For only the 24th time since 1933, the Industrials sector composite trend model cycles from -10 to +10.

Comparable composite signals preceded positive returns

Like the Discretionary sector, the Industrials tend to trend upward across all time frames consistently. Although the sector outperformed historical averages in terms of returns, it experienced slightly more substantial drawdowns compared to the Discretionary group.

Other recent trend reversals

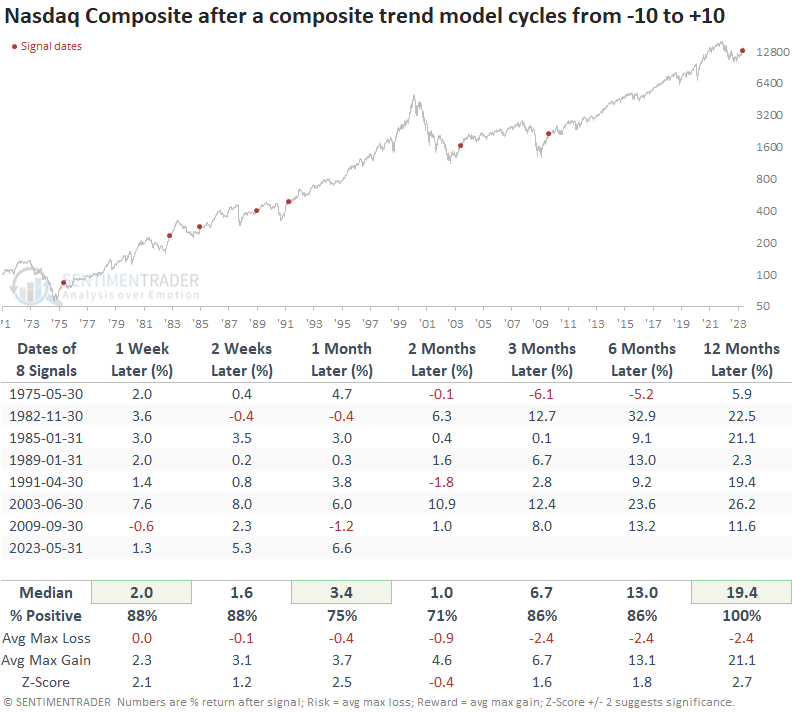
The Nasdaq Composite triggered its 9th composite reversal signal since 1975 at the end of May. Up to this point, that alert demonstrates the highest return after one month when evaluating results relative to historical outcomes. After similar precedents, the Nasdaq Composite was higher a year later every time.

What the research tells us...

The emerging uptrend for indexes and sectors continues to gather steam, with the Consumer Discretionary and Industrials sectors joining the S&P 500 on a long-term composite trend model buy signal. Similar precedents resulted in solid returns and an above-average outlook relative to history for both groups. Other trend change alerts in the last few months include the Nasdaq Composite, S&P 500 Technology, and Nasdaq 100.

Remember the following, "The trend is your friend until the end when it bends." - Ed Seykota

PRODUCTS
SentimenTrader
Trading Tools
Indicators & Data API
‍
Strategies & Scanner
‍
Research Reports
FREE
RESOUrCES
Simple Backtest
Calculator
Simple Seasonality
Calculator
The Kelly Criterion
Calculator
Sentiment Geo Map
‍
Public Research Reports
‍
Education
Sentiment Indicators
‍
Technical Indicators
‍
Pricing
Bundle pricing
‍
FAQ
‍
Announcements
‍
COMPANY
‍
About
‍
In the News
‍
Testimonials
‍
Client Success Stories
CONTACT
‍
General Inquiries
‍
Media Inquiries
‍
Financial Professionals Inquiries
‍
© 2026 Sundial Capital Research Inc. All rights reserved.
Setsail Marketing
TermsPrivacyAffiliate Program
Risk Disclosure: The information and tools provided are for research and analytical purposes only and are not intended as investment advice. Market analysis involves uncertainty, and outcomes may differ from expectations. Users should conduct their own due diligence and consider their individual circumstances before making any financial decisions. Past performance is not necessarily indicative of future results.

Hypothetical Performance Disclosure: Hypothetical performance results have many inherent limitations, some of which are described below. No representation is being made that any account will or is likely to achieve profits or losses similar to those shown; in fact, there are frequently sharp differences between hypothetical performance results and the actual results subsequently achieved by any particular trading program. One of the limitations of hypothetical performance results is that they are generally prepared with the benefit of hindsight. In addition, hypothetical trading does not involve financial risk, and no hypothetical trading record can completely account for the impact of financial risk of actual trading. for example, the ability to withstand losses or to adhere to a particular trading program in spite of trading losses are material points which can also adversely affect actual trading results. There are numerous other factors related to the markets in general or to the implementation of any specific trading program which cannot be fully accounted for in the preparation of hypothetical performance results and all which can adversely affect trading results.

Testimonial Disclosure: Testimonials appearing on this website may not be representative of other clients or customers and is not a guarantee of future performance or success.