Products
SentimenTrader Trading Tools
‍
Backtest Engine
My Trading Toolkit
Correlation Analysis
Seasonality
Indicators & Data API
‍
Proprietary Indicators & Charts
Market Data API
Strategies & Scanner
‍
50+ Trading Strategies
Smart Stock Scanner
Research Reports
‍
Research Solutions
Reports Library
Free Resources
Simple Backtest Calculator
Simple Seasonality Calculator
The Kelly Criterion Calculator
Sentiment Geo Map
Public Research Reports
Pricing
Company
About
In the News
Testimonials
Client Success Stories
Contact
Log inLoginSign up
< BACK TO ALL REPORTS

The transportation sector may be set to move

Jay Kaeppel
2021-11-10
The transportation sector has completed a setup with a median 9-month gain of over +30% in the past. If ticker IYT can take out recent resistance, the transportation sector may be set to move.

Key points:

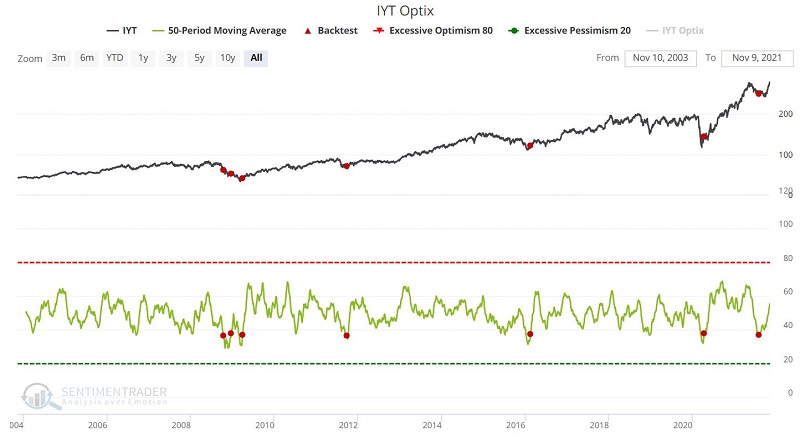
  • Several months ago, Optix on IYT reversed from a low level
  • Historically this setup has been followed by several months of churning followed by a strong rally
  • We have entered the period when transports could rally strongly

IYT underperforms, then reverses

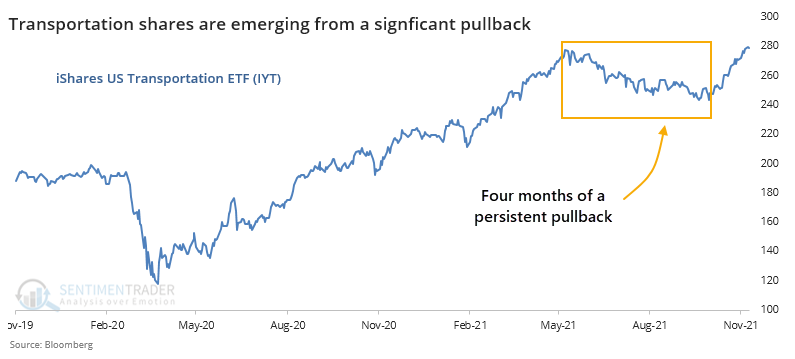
In mid-2021, the transportation sector experienced a significant pullback while the major market indexes made a series of new highs. The chart below shows how the iShares Transportation Average ETF (IYT) has finally rebounded after 4 months mired in a pullback.

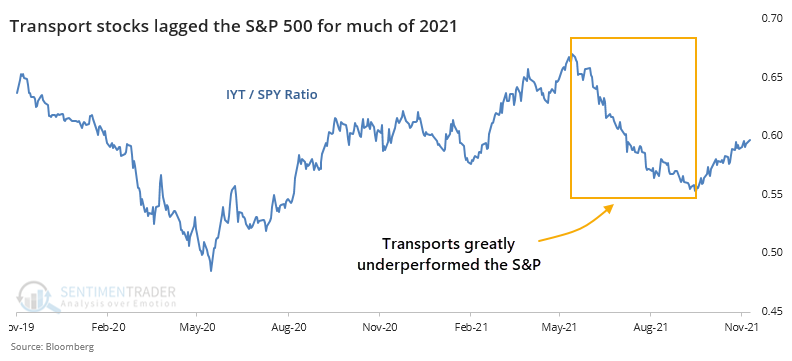
The IYT fund greatly underperformed the broader market from spring through the fall. The ratio between IYT and SPY plunged from May through September.

The subsequent powerful reversal in IYT may have set the stage for an even further advance. Let's consider the history of this setup.

IYT Optix improvement led to an 86% win rate

We will examine when the 50-day moving average for IYT Optix crosses above 36.5 for the first time in 21 days. You can run this test by clicking here. The input settings appear below.

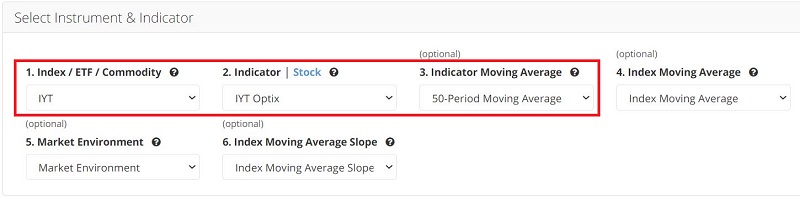
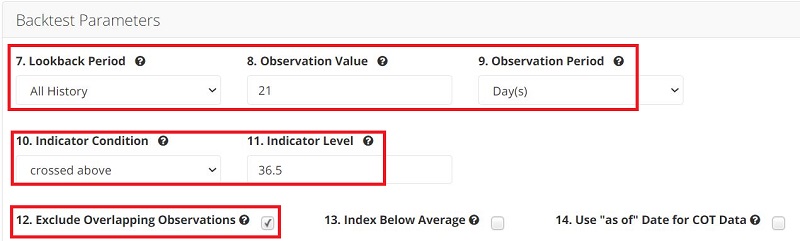
The chart below displays the output screen for the test above.

The returns following previous signals show that IYT rebounded over the next couple of weeks 86% of the time. Over the next year, it averaged a median return of more than 27%.

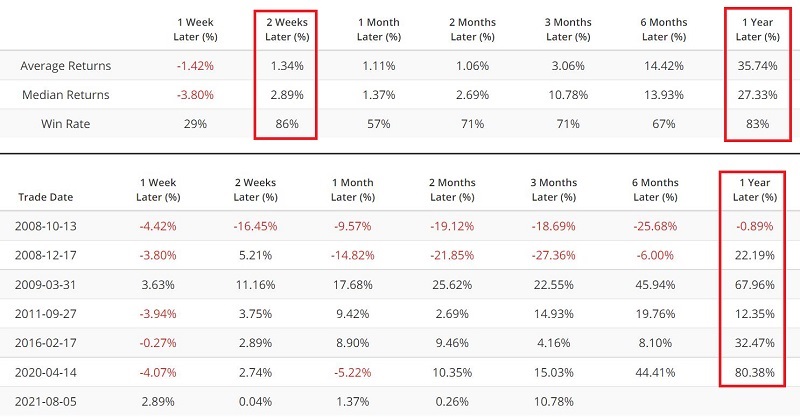
If we dig a little deeper, we find that the most reliable and powerful period for returns begins 3 months after a signal.

The table below displays the cumulative return for IYT during the 9-month period extending from 3 months after each signal through 12 months after each signal.

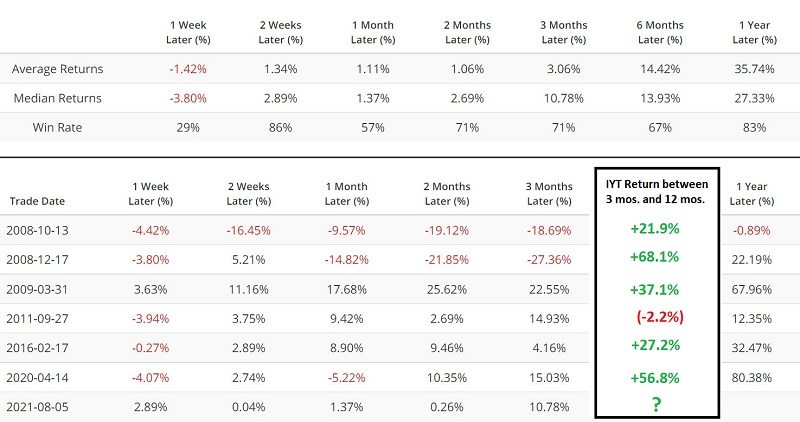
The sample size is relatively small, which is a concern. Nevertheless, the median return for the 9-month period starting 3 months after a signal is a robust +32.1%.

The favorable 9-month period following the most recent signal on August 5 began on November 5 and extends through August 5 of next year. Even though IYT has already rallied in recent weeks, this suggests there is more to go.

What the research shows…

A washout in sentiment for the transportation sector typically sets the stage for a powerful advance once the market has had some time to turn the tide. The IYT fund is facing a significant resistance level, but if it manages to break out again, history suggests it may be a move worth climbing aboard.

Sorry, you don't have access to this report

Upgrade your subscription plan to get access
Go to Dasboard
PRODUCTS
SentimenTrader
Trading Tools
Indicators & Data API
‍
Strategies & Scanner
‍
Research Reports
FREE
RESOUrCES
Simple Backtest
Calculator
Simple Seasonality
Calculator
The Kelly Criterion
Calculator
Sentiment Geo Map
‍
Public Research Reports
‍
Pricing
Bundle pricing
‍
Announcements
‍
FAQ
COMPANY
‍
About
‍
In the News
‍
Testimonials
‍
Client Success Stories
CONTACT
‍
General Inquiries
‍
Media Inquiries
‍
Financial Professionals Inquiries
‍
© 2025 Sundial Capital Research Inc. All rights reserved.
Setsail Marketing
TermsPrivacyAffiliate Program
Risk Disclosure: Futures and forex trading contains substantial risk and is not for every investor. An investor could potentially lose all or more than the initial investment. Risk capital is money that can be lost without jeopardizing ones’ financial security or life style. Only risk capital should be used for trading and only those with sufficient risk capital should consider trading. Past performance is not necessarily indicative of future results.

Hypothetical Performance Disclosure: Hypothetical performance results have many inherent limitations, some of which are described below. No representation is being made that any account will or is likely to achieve profits or losses similar to those shown; in fact, there are frequently sharp differences between hypothetical performance results and the actual results subsequently achieved by any particular trading program. One of the limitations of hypothetical performance results is that they are generally prepared with the benefit of hindsight. In addition, hypothetical trading does not involve financial risk, and no hypothetical trading record can completely account for the impact of financial risk of actual trading. for example, the ability to withstand losses or to adhere to a particular trading program in spite of trading losses are material points which can also adversely affect actual trading results. There are numerous other factors related to the markets in general or to the implementation of any specific trading program which cannot be fully accounted for in the preparation of hypothetical performance results and all which can adversely affect trading results.

Testimonial Disclosure: Testimonials appearing on this website may not be representative of other clients or customers and is not a guarantee of future performance or success.