Products
SentimenTrader Trading Tools
‍
Backtest Engine
My Trading Toolkit
Correlation Analysis
Seasonality
Market Prediction
Indicators & Data API
‍
Proprietary Indicators & Charts
Market Data API
Strategies & Scanner
‍
50+ Trading Strategies
Smart Stock Scanner
Smart Option Scanner
Research Reports
‍
Research Solutions
Reports Library
Free Resources
Simple Backtest Calculator
Simple Seasonality Calculator
The Kelly Criterion Calculator
Sentiment Geo Map
Public Research Reports
Education
Sentiment Indicators
Technical Indicators
Pricing
Company
About
In the News
Testimonials
Client Success Stories
Contact
Log inLoginSign up
< BACK TO ALL REPORTS

The tide may be turning in unleaded gas

Jay Kaeppel
2026-06-24
Unleaded gas enjoyed a meteoric rise of almost 125% from December 2025 into March 2026. But now a confluence of seasonality, sentiment, and price action strongly suggests the potential for lower prices in the months ahead. Details herein.

Key points:

  • The Iran War resulted in a sizeable increase in the price of unleaded gas futures
  • Now, however, a combination of factors suggest than unleaded gas futures could fall in the months ahead
  • The key factors influencing this crucial market are seasonality, price action, and sentiment

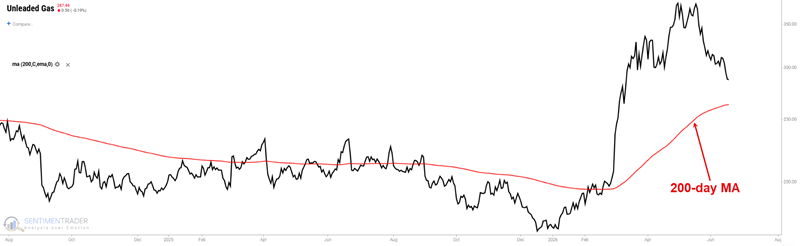
Unleaded Gas price action is threatening to drop back into a downtrend

From mid-December 2025 until the start of the Iran War, the price for unleaded gas futures rose from 168 to 207, or 24%. After the war began, unleaded soared to almost 308, an additional gain of 81%. Since that time, however, the price has declined by over 20%. In the chart below, we see that unleaded remains above its 200-day moving average. As long as that relationship holds, it is reasonable to still designate unleaded as being in "an uptrend."

The tide may be turning in unleaded gas

At the same time, looking at unleaded on a more of a "trading" basis, the price has dipped back below the 70-day exponential moving average, as shown in the chart below. There is nothing better or worse about using a 70-day EMA versus a simple 200-day average. Based on a somewhat subjective personal preference, I use a 200-day simple average to designate "the major trend," but I like the 70-day EMA for sh

Sorry, you don't have access to this report

Upgrade your subscription plan to get access
Go to Dasboard
PRODUCTS
SentimenTrader
Trading Tools
Indicators & Data API
‍
Strategies & Scanner
‍
Research Reports
FREE
RESOUrCES
Simple Backtest
Calculator
Simple Seasonality
Calculator
The Kelly Criterion
Calculator
Sentiment Geo Map
‍
Public Research Reports
‍
Education
Sentiment Indicators
‍
Technical Indicators
‍
Pricing
Bundle pricing
‍
FAQ
‍
Announcements
‍
COMPANY
‍
About
‍
In the News
‍
Testimonials
‍
Client Success Stories
CONTACT
‍
General Inquiries
‍
Media Inquiries
‍
Financial Professionals Inquiries
‍
© 2026 Sundial Capital Research Inc. All rights reserved.
Setsail Marketing
TermsPrivacyAffiliate Program
Risk Disclosure: The information and tools provided are for research and analytical purposes only and are not intended as investment advice. Market analysis involves uncertainty, and outcomes may differ from expectations. Users should conduct their own due diligence and consider their individual circumstances before making any financial decisions. Past performance is not necessarily indicative of future results.

Hypothetical Performance Disclosure: Hypothetical performance results have many inherent limitations, some of which are described below. No representation is being made that any account will or is likely to achieve profits or losses similar to those shown; in fact, there are frequently sharp differences between hypothetical performance results and the actual results subsequently achieved by any particular trading program. One of the limitations of hypothetical performance results is that they are generally prepared with the benefit of hindsight. In addition, hypothetical trading does not involve financial risk, and no hypothetical trading record can completely account for the impact of financial risk of actual trading. for example, the ability to withstand losses or to adhere to a particular trading program in spite of trading losses are material points which can also adversely affect actual trading results. There are numerous other factors related to the markets in general or to the implementation of any specific trading program which cannot be fully accounted for in the preparation of hypothetical performance results and all which can adversely affect trading results.

Testimonial Disclosure: Testimonials appearing on this website may not be representative of other clients or customers and is not a guarantee of future performance or success.