
The third Federal Reserve target rate increase

Key points:
- The Federal Open Market Committee increased the federal fund's target rate for the third time
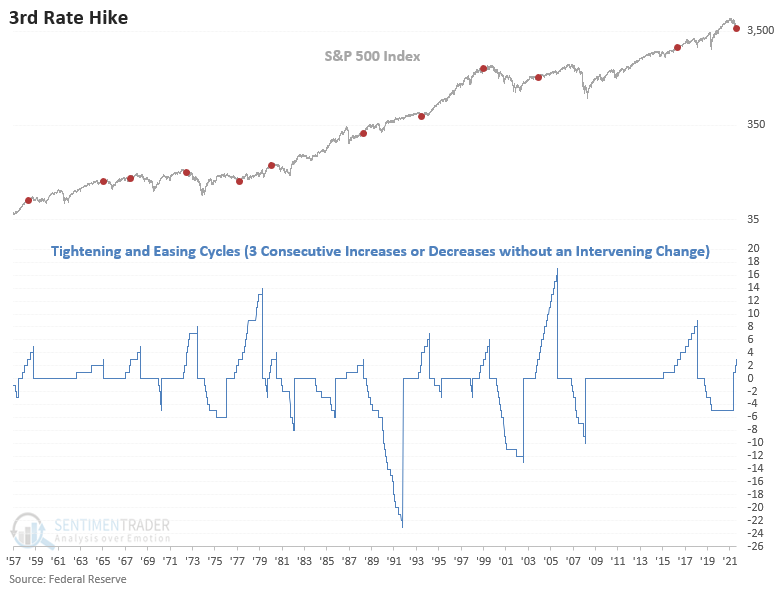
- With the new increase, a tightening cycle is now official
- A third target rate increase typically preceded negative returns in the near term for stocks
- Commodities look constructive, the Macro Index Model stumbles, and the yield curve contracts
Edson Gould's Three steps and a stumble Federal Reserve policy rule
From the CMT Association website:
"Similar to Zweig's Fed policy indicator and in line with the desire to measure when the Federal Reserve is tightening credit, Edson Gould, a legendary technical analyst from the 1930s through the 1970s, developed a simple rule about Federal Reserve policy that has an excellent record of foretelling a stock market decline. The rules state that "whenever the Federal Reserve raises either the federal fund's target rate, margin requirements, or reserve requirements three consecutive times without a decline, the stock market is likely to suffer a substantial, perhaps serious, setback."
Let's assess the outlook for stocks, commodities, the Macro Index Model, and the yield curve after the FOMC increases the target rate for a third time without intervening in the opposite direction. This study uses the fed funds target rate since 1989 and the discount rate in prior instances.
Stocks after the 3rd increase in the target rate
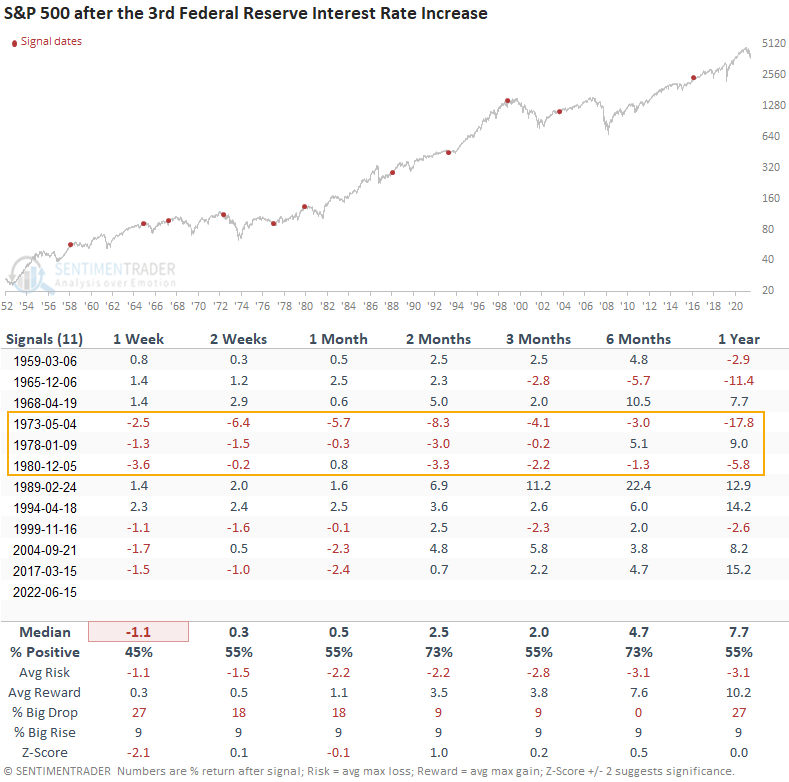
The third increase in the target rate preceded negative to somewhat flat returns with below-average win rates in the first month. While medium to long-term performance is positive, some win rates are less than historical averages. I highlighted the 1973-80 signals as that was the last time inflation levels were similar.
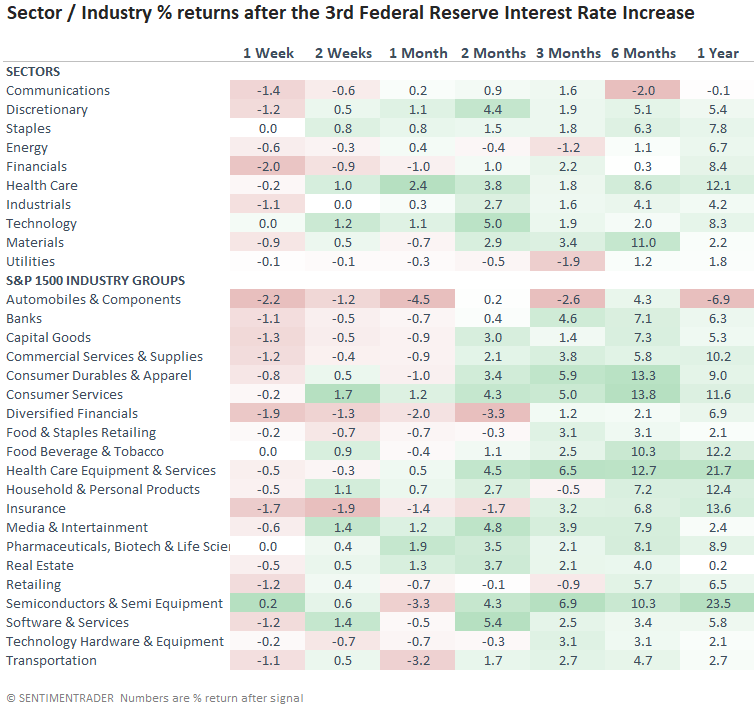
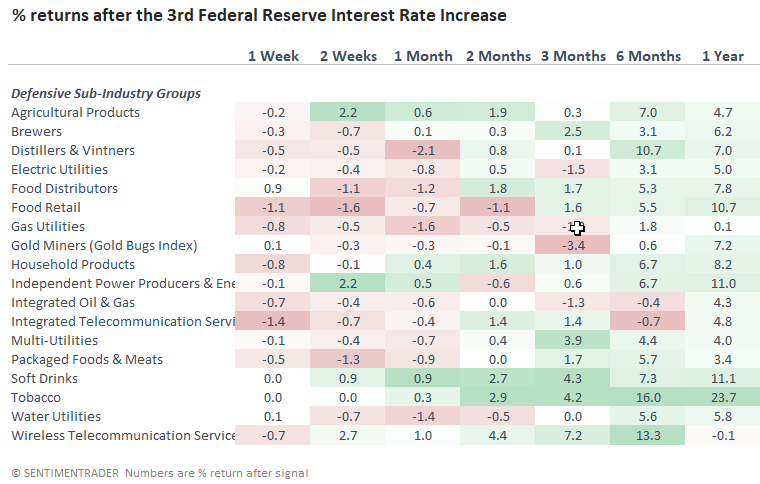
Interest rate-sensitive groups tend to struggle, especially the automobiles and components industry. One should keep a close eye on the financials as they typically provide a vital message concerning credit. Not surprisingly, defensive groups like staples and health care perform better.
The consumer discretionary sub-industry table shows a similar theme. Individual groups within autos and housing can't escape the impact of higher rates.
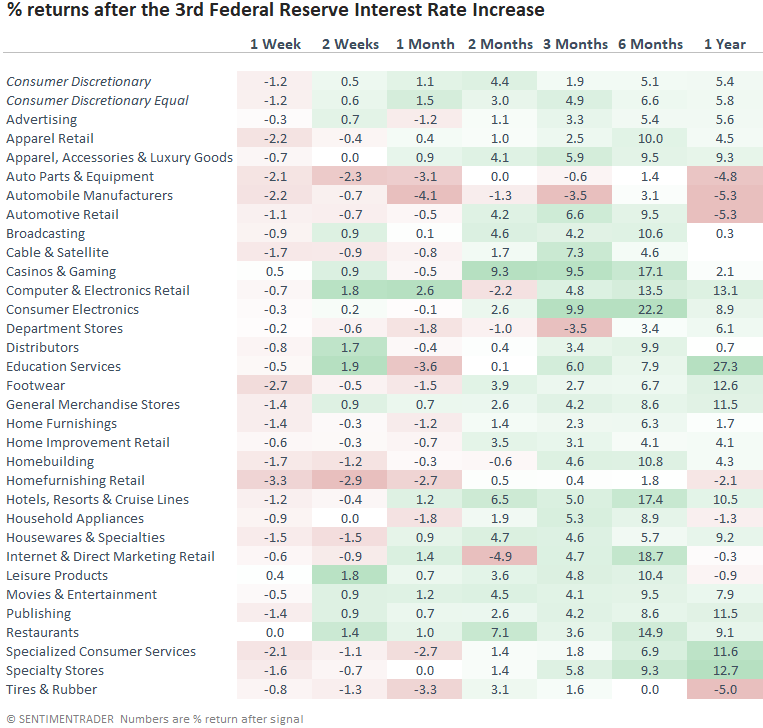
Except for soft drinks, tobacco, and agricultural products, most defensive sub-industry groups couldn't avoid the initial downdraft.
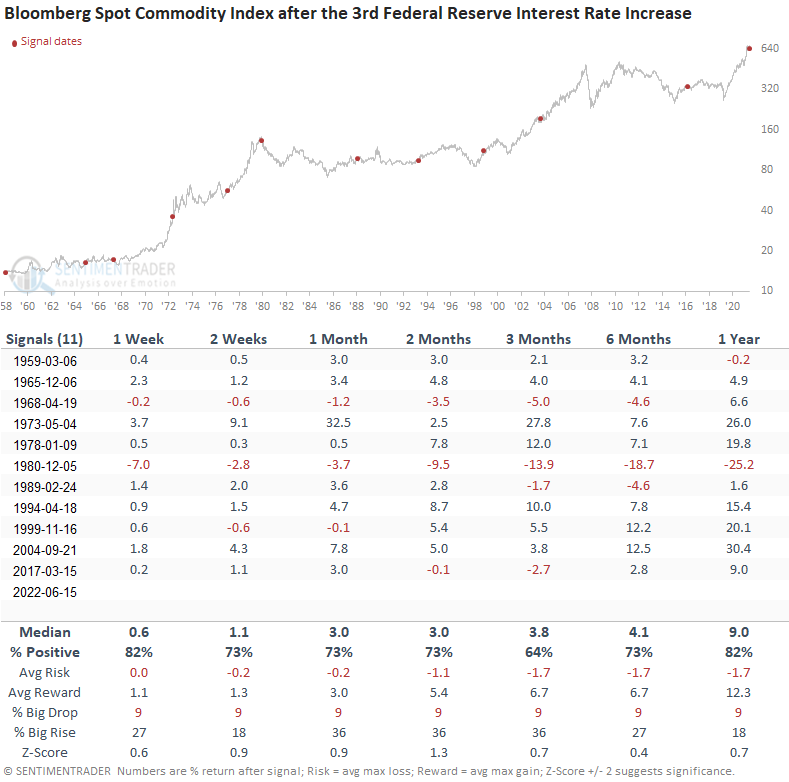
Commodities after the 3rd increase in the target rate
Interestingly, commodities performed well across all time frames. Except for 1980, the 1-year outlook is remarkable.
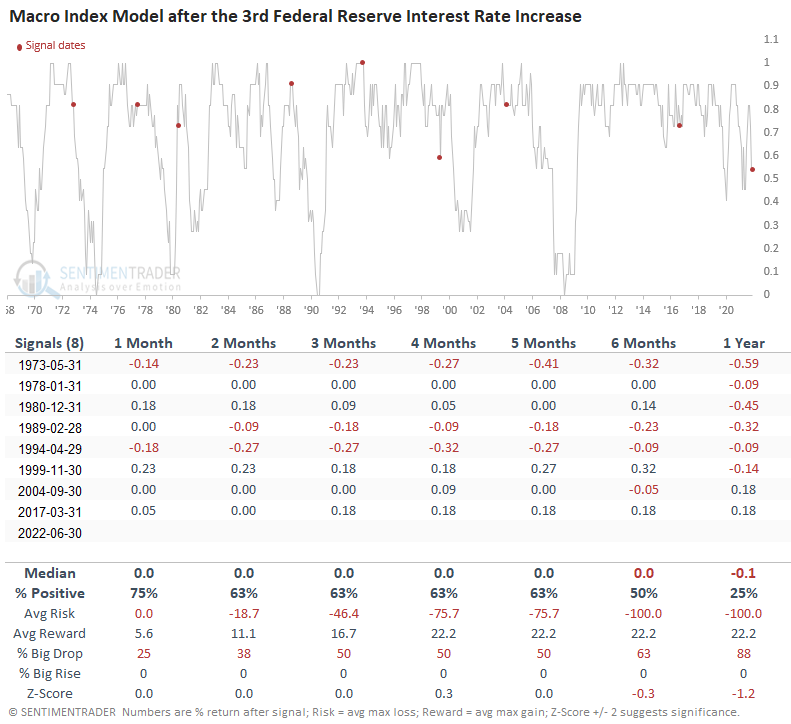
Macro Index Model after the 3rd increase in the target rate
If I apply the signal dates to the Macro Index Model, the 1-year win rate emphasizes why interest rate increases operate with a lag. Market participants are worried that the Federal Reserve is tightening policy in a decelerating growth environment. The concerns are well-founded as the SentimenTrader Macro Index Model is at the lowest level in history at the time of a 3rd target rate increase.
Due to data limitations, the outlook table contains 3 fewer signals.
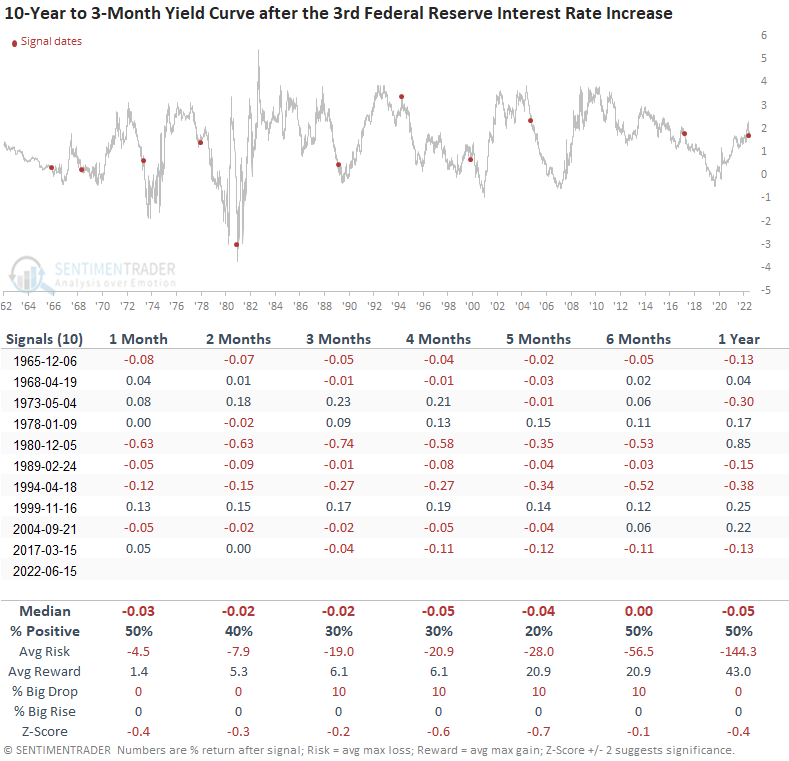
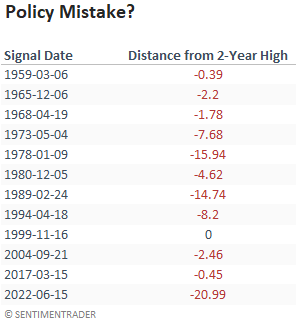
Yield curve after the 3rd increase in the target rate
I suspect a bet on a yield curve flattener makes sense at some point.
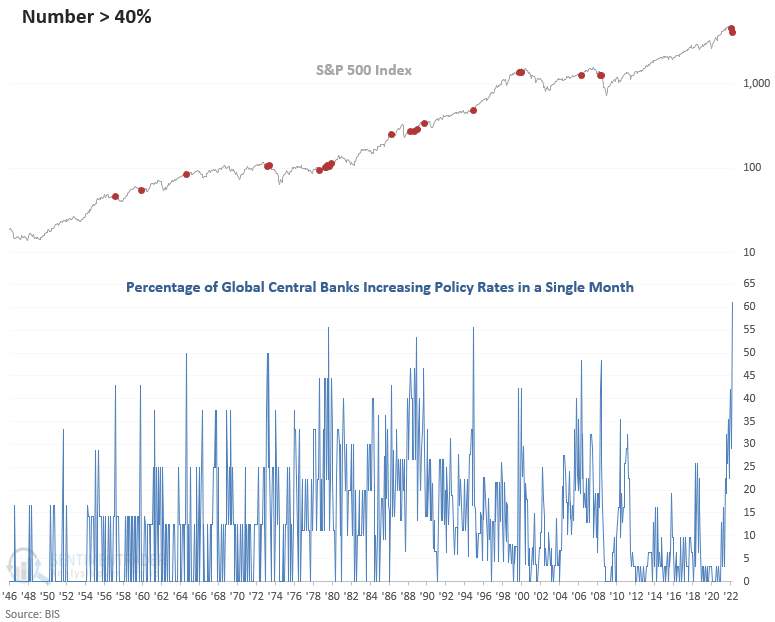
Global central bank policy is tight
The Federal Reserve is not acting alone. In May, the percentage of global central banks increasing policy rates in a single month surged to the highest in history.
Edit: I included the following table after publishing.
What the research tells us...
When the Federal Reserve increases the target rate for the third time, the policy shift tends to weigh on stocks in the near term. Interest-rate-sensitive groups experience the most significant impact from the new rate cycle. Interestingly, a commodity index shows positive returns across all times, with a remarkable record a year later. When I apply the signals to the Macro Index Model, the increase in interest rates impacts economic activity with a lag. I would keep in mind that the current level for the Macro Index Model has never been lower on a 3rd target rate increase. Finally, we should see the yield curve contract at some point.