
The Technology sector triggered a breadth thrust

Key points:
- The percentage of Technology stocks above their 10-day average cycled from oversold to overbought
- Similar thrusts in a positive trend environment produced robust returns and consistency over the next year
- Technology consistently outperformed the S&P 500 and all other sectors across most time horizons
A breadth thrust suggests the Technology sector is regaining momentum
When a sector exhibits strong leadership, it can often underperform during market corrections as traders rush to sell and lock in profits. This phenomenon is particularly true for cyclical sectors like Technology, which recently dropped by 16.34%, nearly double the S&P 500's decline of 8.49%.
Although leadership sectors often take the hardest hit during drawdowns, they recover swiftly if the selloff stems from sentiment or positioning rather than a wholesale change in fundamentals- an argument one could make in the case of Technology.
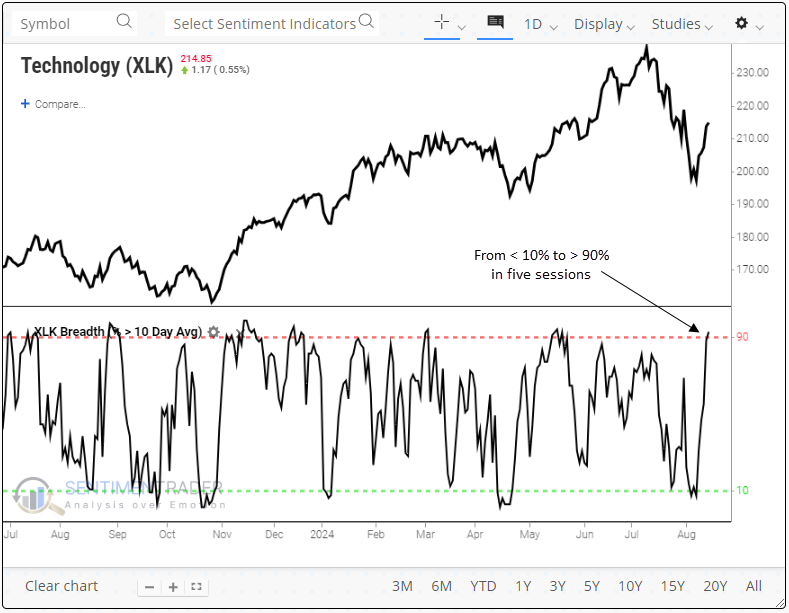
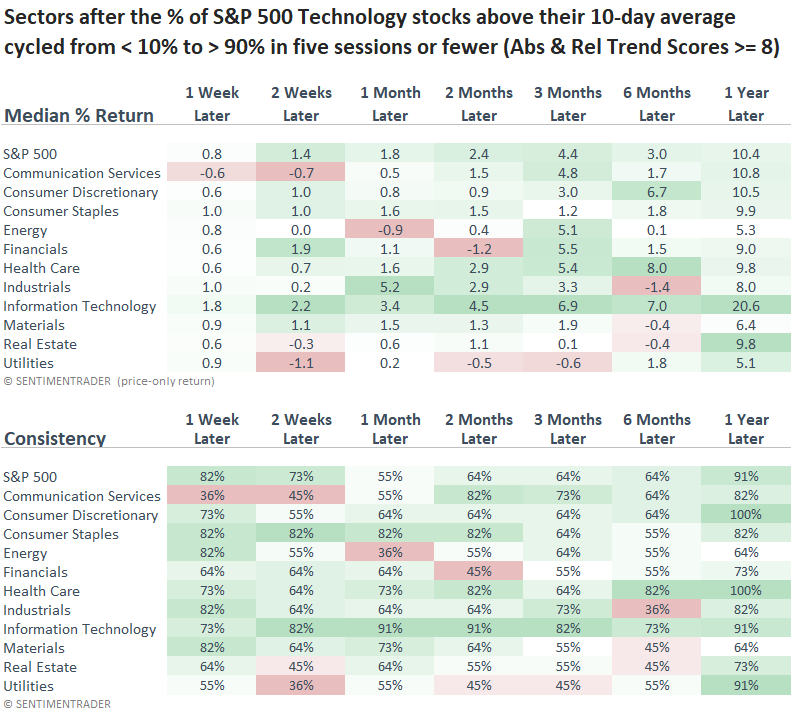
Over the last five sessions, the percentage of S&P 500 Technology sector stocks above their 10-day average cycled from below 10% to above 90%, triggering a breadth thrust signal.
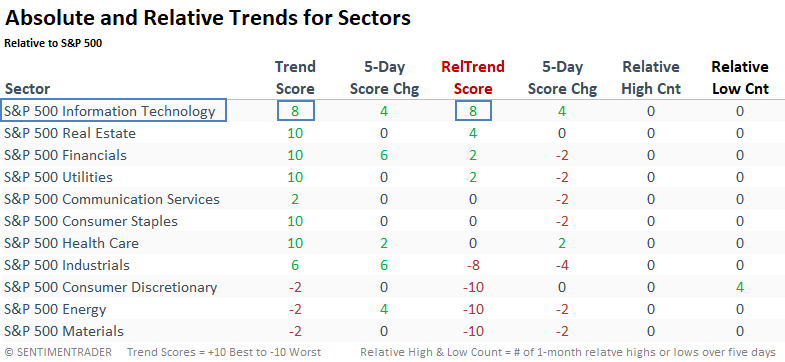
Considering the importance of context, I will include a condition for the thrust signal requiring a minimum trend score of eight across both absolute and relative trend-following indicators using my composite models. The table below demonstrates that only the S&P 500 Technology sector meets this criterion, confirming its leadership status.
Similar thrusts with favorable trend indicators preceded positive returns
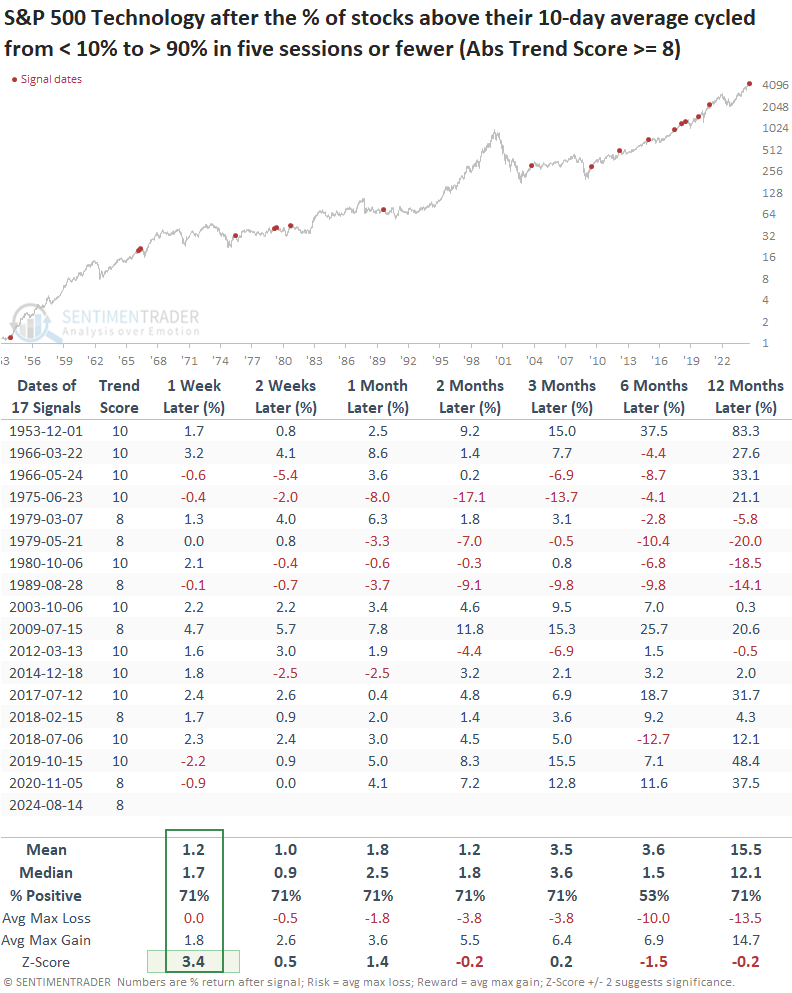
Whenever the percentage of S&P 500 Technology sector stocks above their 10-day average cycled from below 10% to above 90% in five sessions or fewer, and the sector maintained an absolute trend score of eight or higher, the industry typically rallied over the following month. During this period, gains were observed at some point in 15 of the 17 historical instances.
Although more extended time frames displayed positive results, none exhibited significance, as the signal struggled during the 1960s to 1980s, a period that favored value over growth.
Suppose I include a condition requiring both the absolute and relative trend composites for the S&P Technology sector to maintain a score of eight or higher at the time of a signal. In that case, when Technology displayed positive trends, like now, returns and consistency were outstanding, with several time frames exhibiting significance.
Interestingly, not a single instance occurred during the Technology boom in the 1990s.
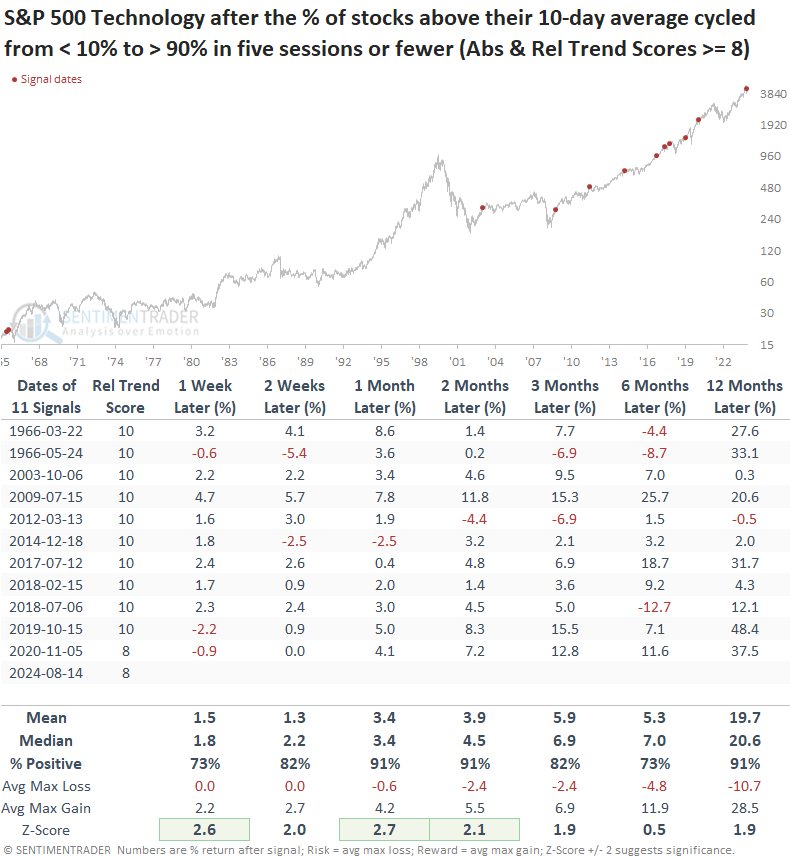
Not only did Technology exceed the performance of the S&P 500 across all time frames, but it also outperformed nearly every other sector over most intervals.
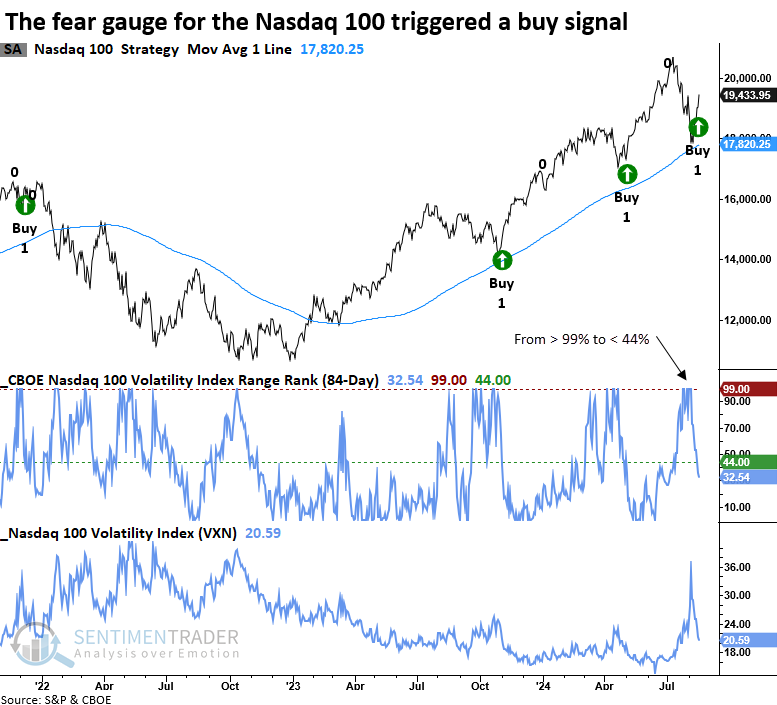
The Volatility Index (VXN) for the Nasdaq 100
In my research report on Tuesday, I noted the potential for a volatility range rank buy signal for the Nasdaq 100. At the close of trading on Wednesday, a new alert was triggered.
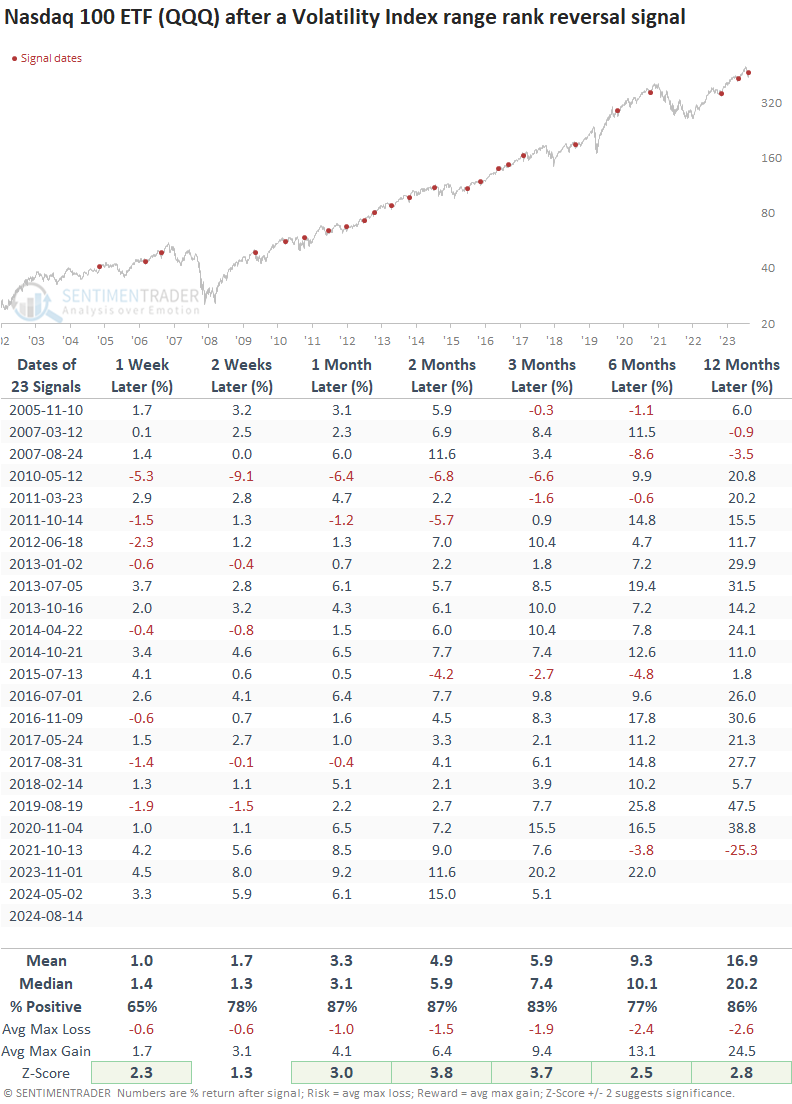
The Nasdaq 100 Volatility Index (VXN) 's historical data (since 2005) is not as extensive as the VIX's (since 1990), and most signals occurred during a growth-driven bull market led by Technology. Still, results are spectacular across all time frames.
Additionally, drawdowns were limited. Over the following three months, the signal experienced only three maximum losses exceeding -5%.
What the research tells us...
Technology stocks experienced a significant correction, leaving investors questioning its leadership status. Following this pullback, the sector surged, triggering a breadth thrust signal when the percentage of stocks above their 10-day average cycled from less than 10% to more than 90% in five sessions. Comparable thrusts when the sector exhibited bullish absolute and relative trend scores led to outstanding returns and consistency for the group. Should history rhyme, Technology should outpace the broad market and other sectors.