
The TCTM Long-Term Trend Model reverses from bearish to bullish

Key points:
- The Long-Term Trend Model, a component in the TCTM, shifted to a positive status
- Similar trend change signals preceded excellent results for the S&P 500 across all time frames
- A few TCTM Composite Risk Warning Model components triggered new alerts
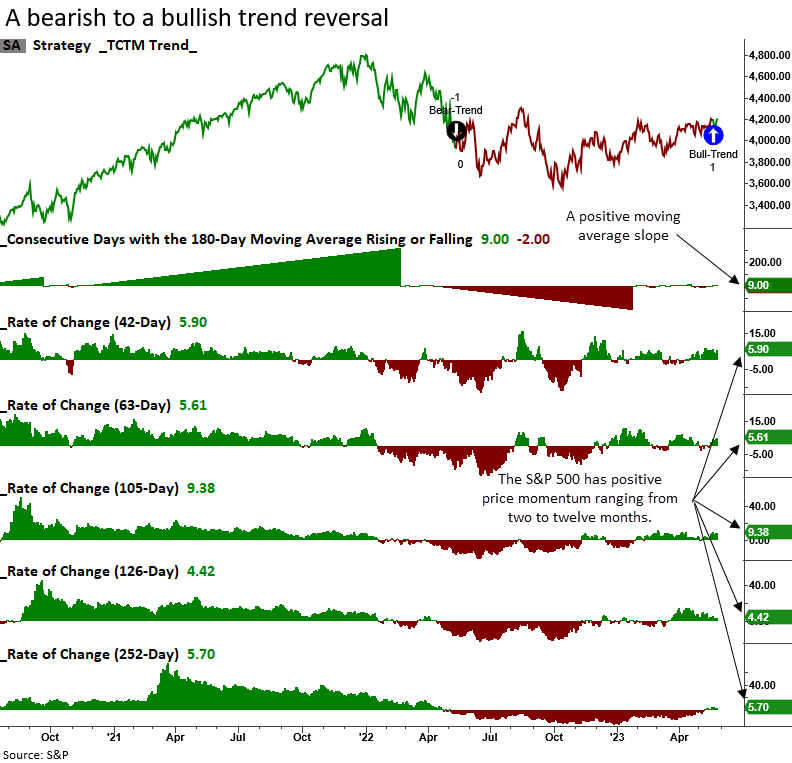
A bullish trend change for the TCTM Long-Term Trend Model
The Long-Term Trend Model, one of seven components in the broader Tactical Composite Trend Model (TCTM), reversed from bearish to bullish for the 26th time since 1932.
The model combines price momentum ranging from two to twelve months with the slope of the 180-day moving average to measure the trend for the S&P 500.
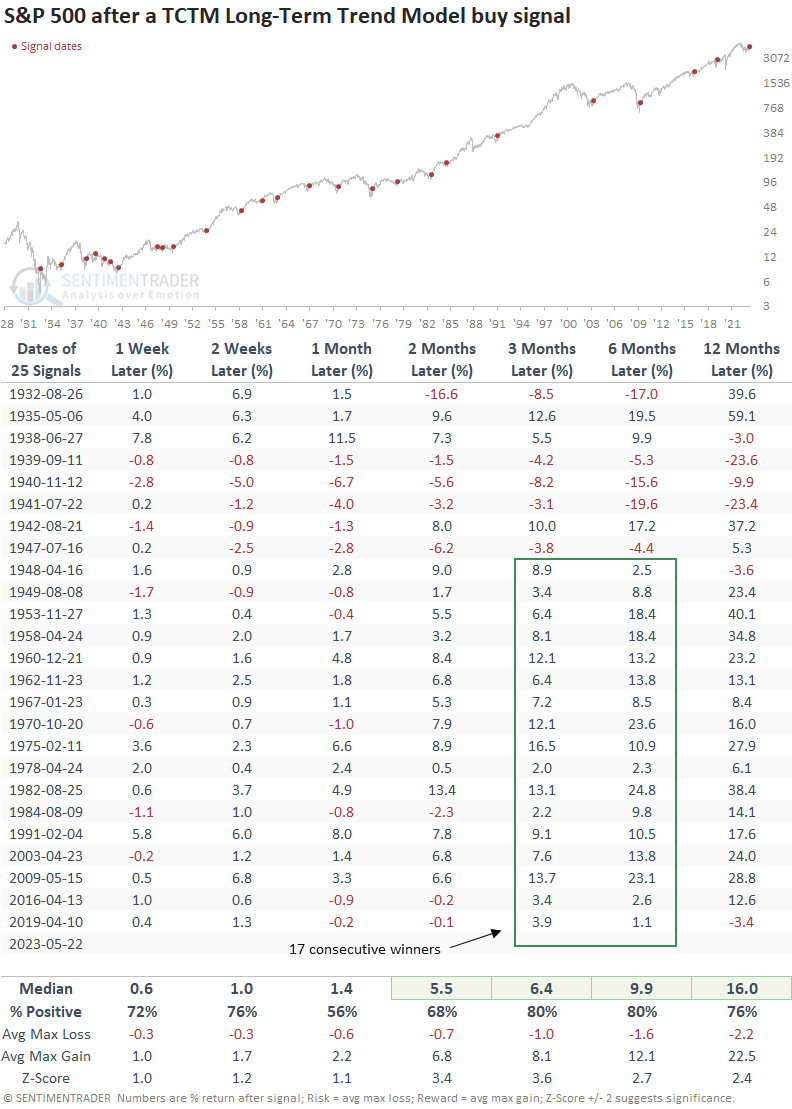
Similar trend change signals preceded excellent returns
When the Long-Term Trend Model reverses to a bullish status, the S&P 500 tends to rise consistently over the next twelve months. Not surprisingly, the 1929-42 period was challenging for a trend-following system. Since 1948, the model has shown a gain in the three and six-month time horizons for 17 consecutive signals.
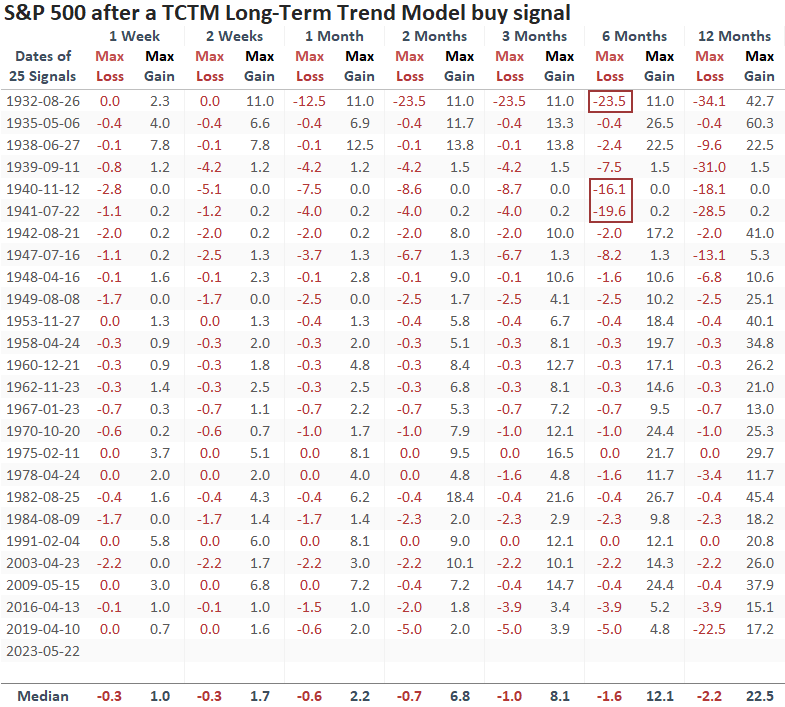
Over the next six months, a max loss of greater than -10% occurred only three times in history, all during the 1929-42 secular bear market.
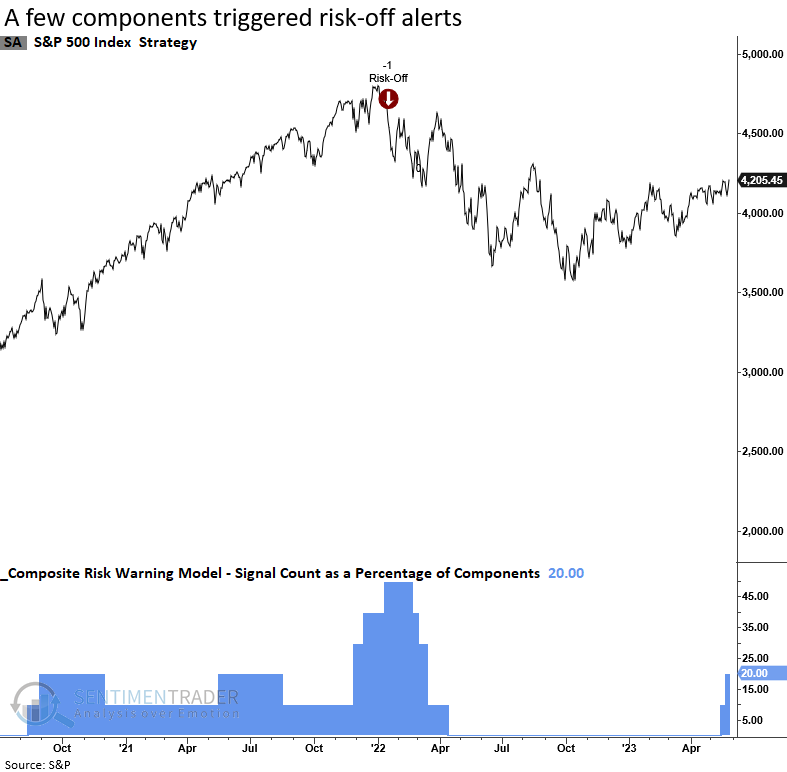
TCTM Composite Risk Warning Model
The TCTM Composite Risk Warning Model components contain conditions that require the S&P 500 to close at or near a 1-year high. In the last two weeks, that condition turned true, which triggered a few risk-off signals. However, the composite remains below the 50% threshold for an overall risk-off alert.
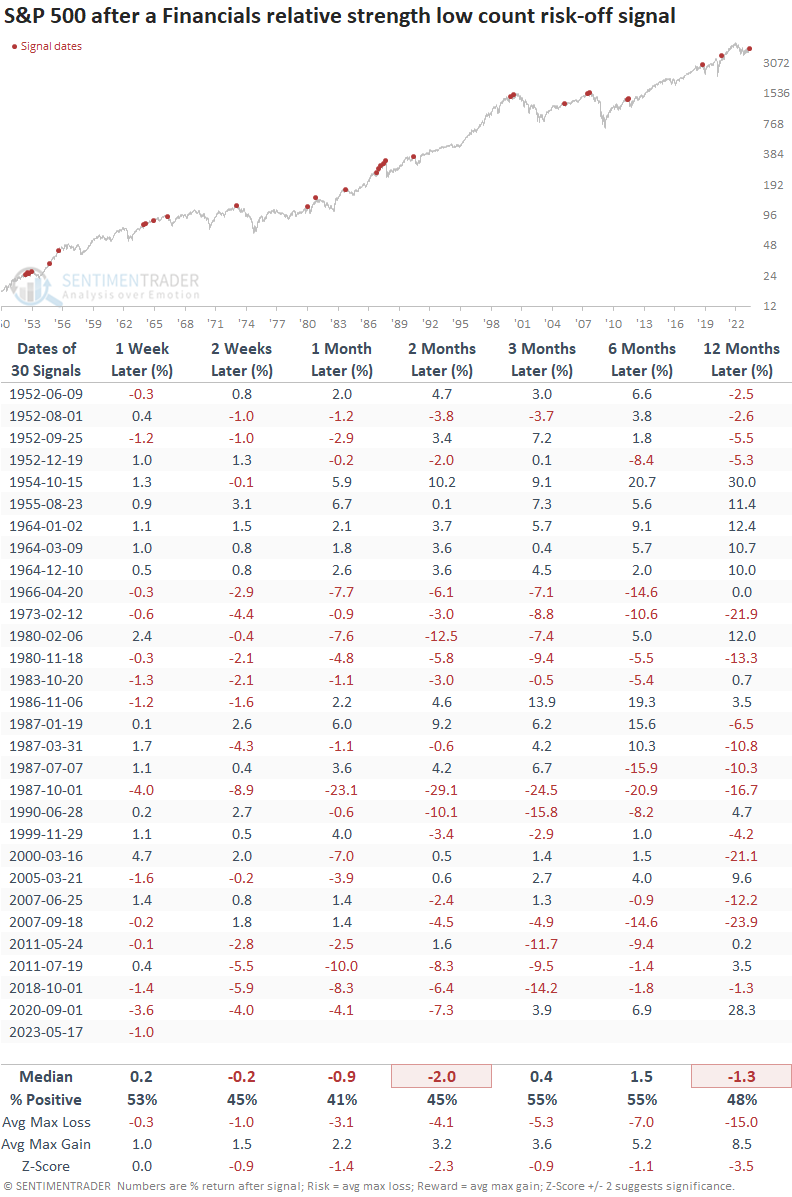
One of the Risk Warning Model components identifies when the S&P 500 Financial sector registers a significant number of 1-year relative lows versus the S&P 500. Historically, when financials are out of gear, the broad market struggles.
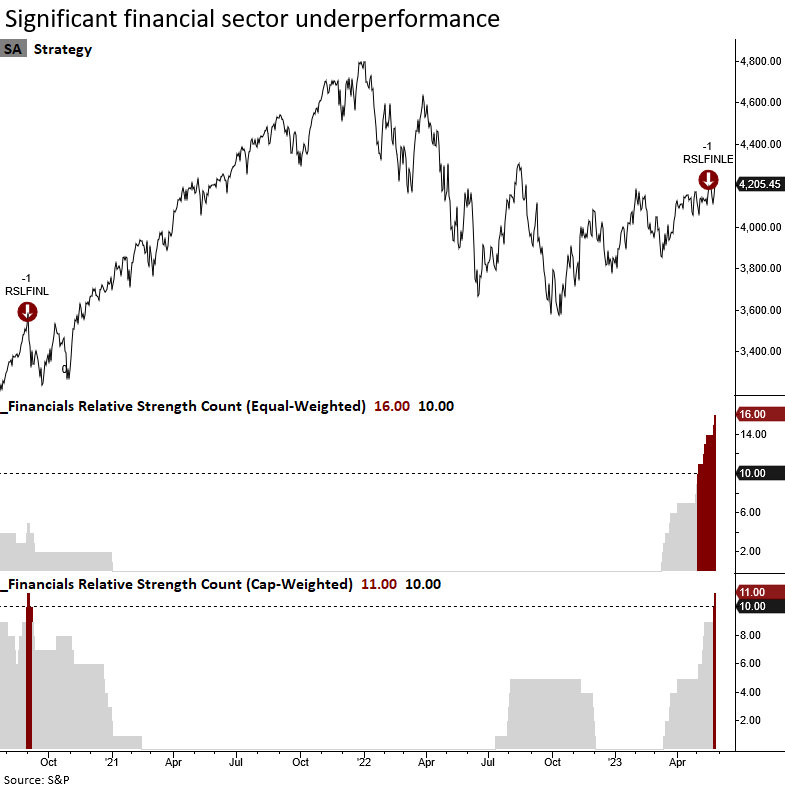
Abysmal performance by the Financials sector tends to bode poorly for the overall market. Typically, alerts occur before major bear market peaks. So, the new signal is unusual, given the drawdown in 2022.
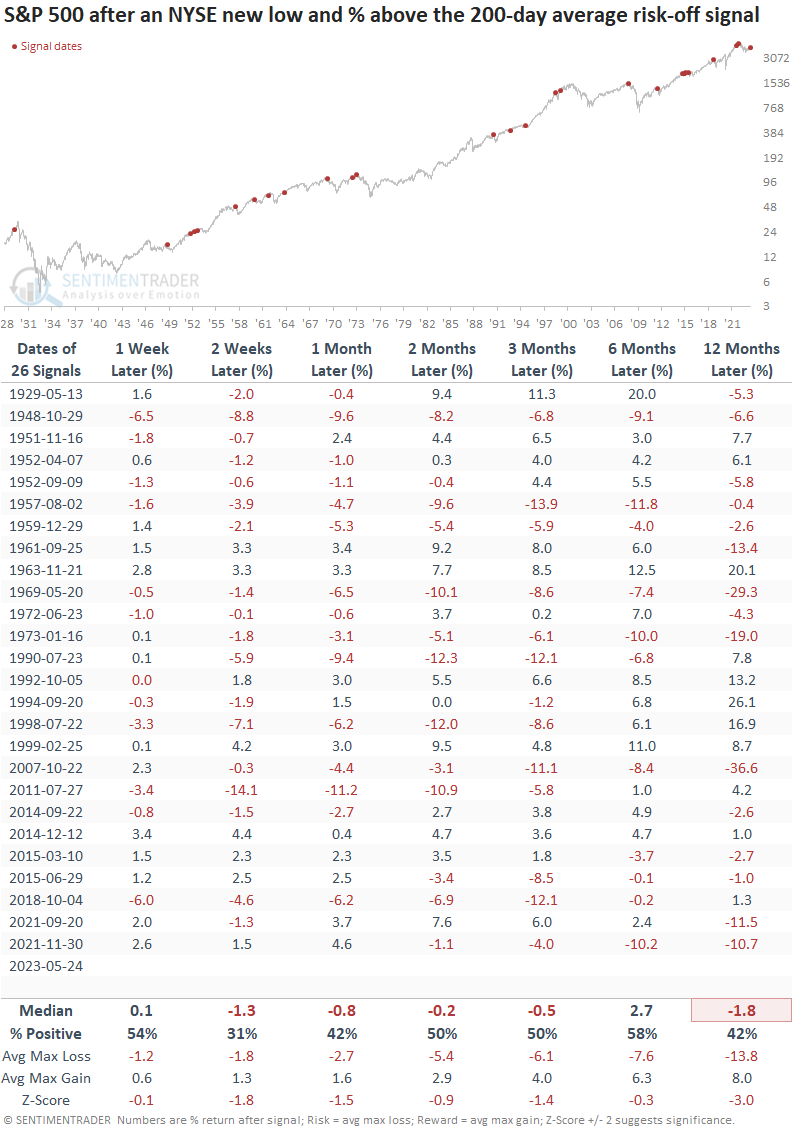
NYSE 52-week lows as a percentage of highs and lows increased as the number of common stocks trading above their respective 200-day moving average fell below 50%, triggering a risk-off warning.
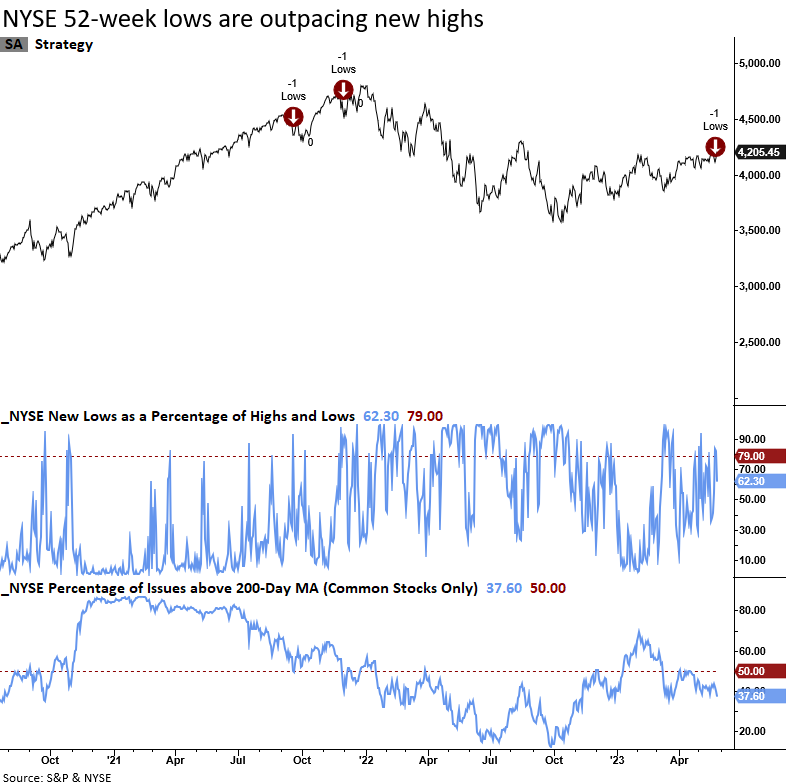
The S&P 500 tends to struggle when news lows outnumber new highs, and long-term participation trends for NYSE common stocks are weak like now.
What the research tells us...
The Long-Term Trend Model for the TCTM, which combines price momentum across multiple time horizons and the slope of the 180-day moving average, reversed from bearish to bullish. After similar trend change signals, the S&P 500 had a solid upward bias across all time frames. Since 1948, the model has had a perfect record over the next three and six months.
With the S&P 500 rallying near a 1-year high, two Composite Risk Warning Model components triggered a sell signal. While a concern, the weight of the evidence does not suggest one should take action to reduce equity market exposure.