

Key points:
- S&P 500 members above their 50-day average surged above 90% on Friday, triggering a buy signal
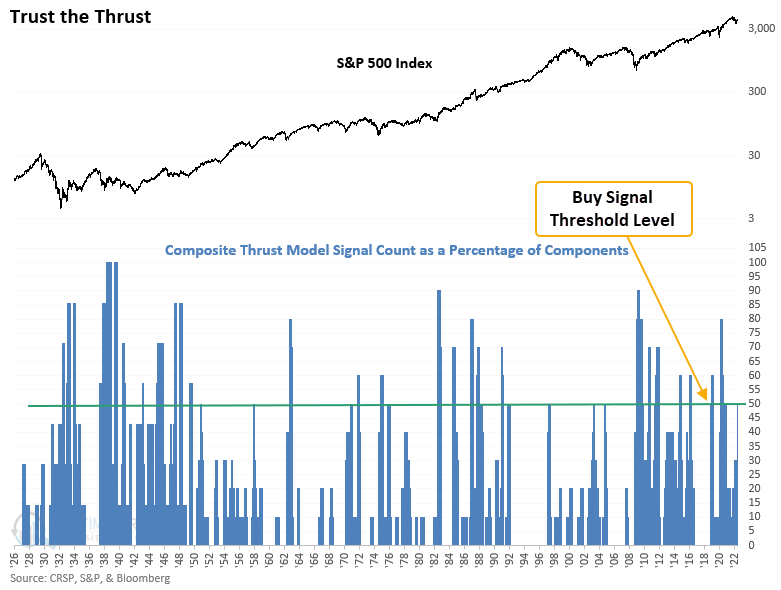
- With the new alert, the TCTM composite thrust model signal count increased to 50%, prompting a new buy signal
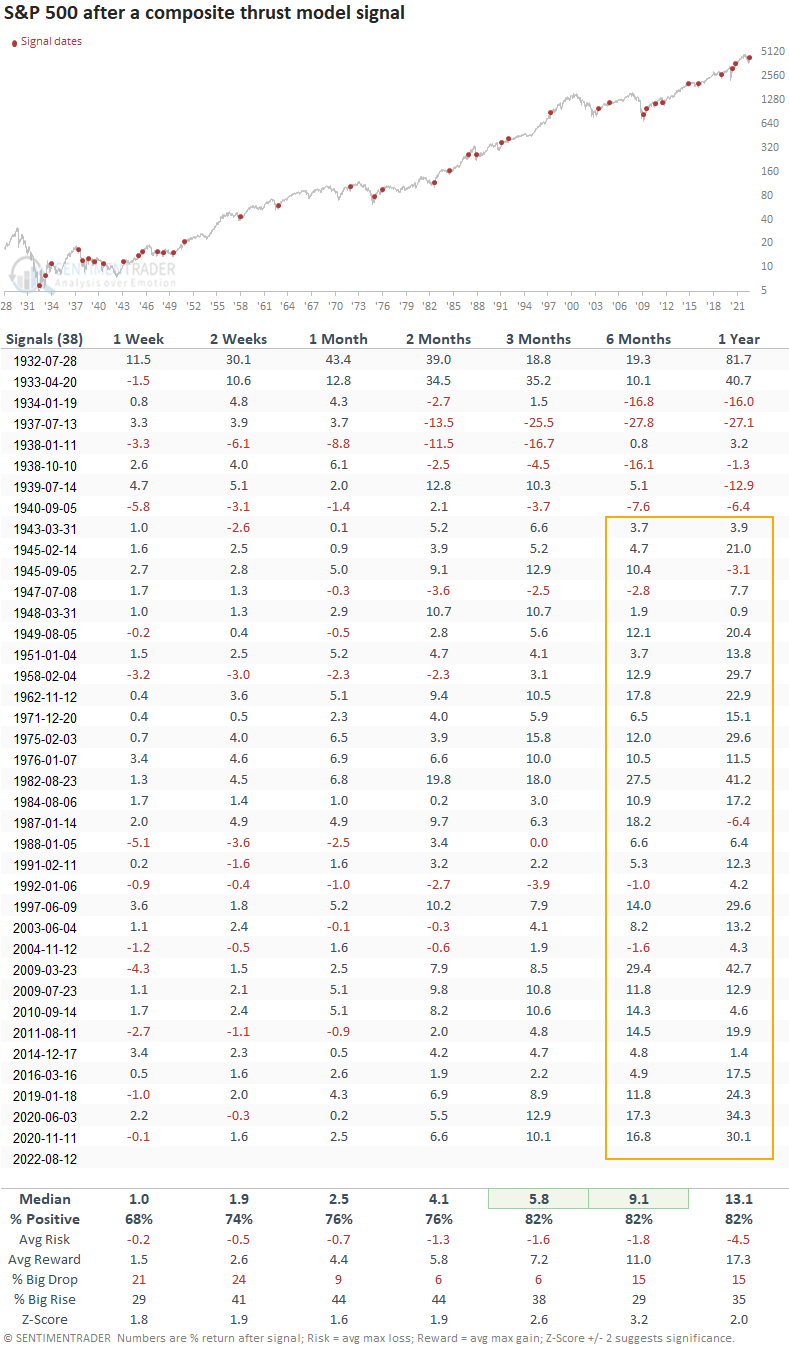
- Similar thrust signals preceded gains 82% of the time a year later for the S&P 500
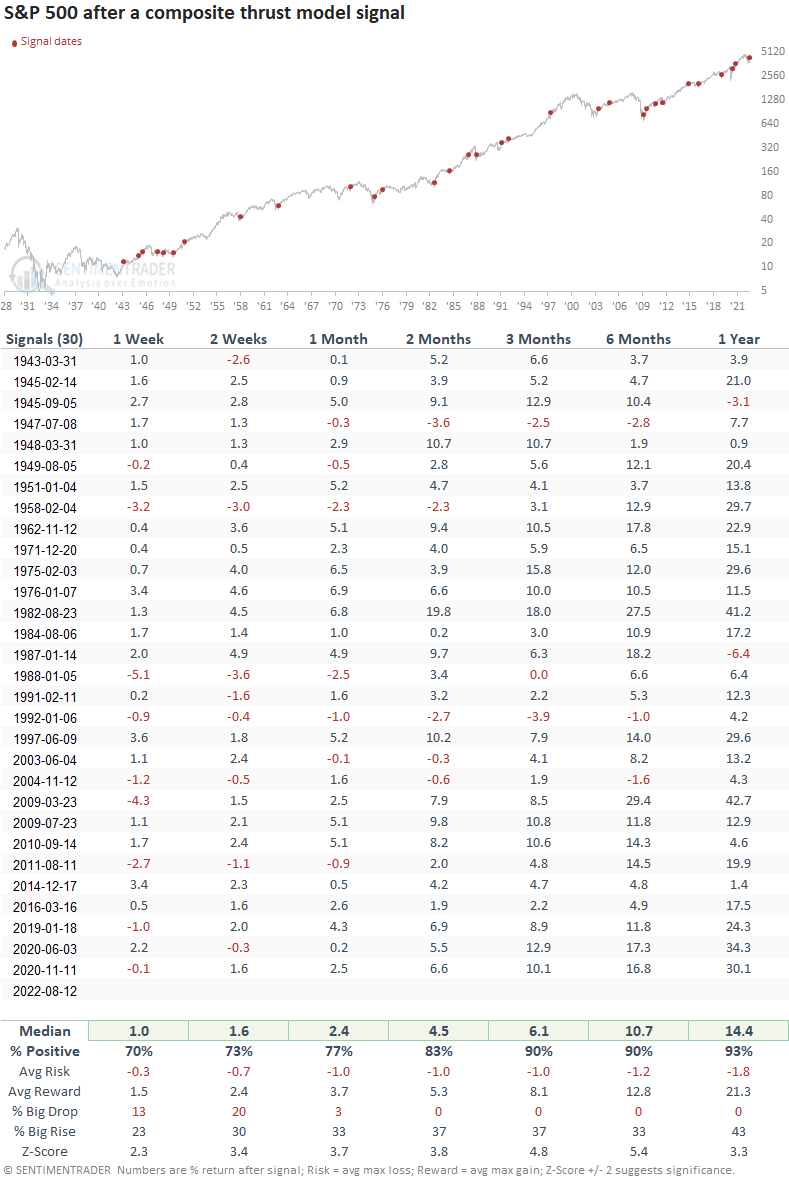
- Since 1942, the S&P 500 was higher 93% of the time a year later
Composite models use a weight of the evidence approach
On July 12, I shared the historical track record for the percentage of S&P 500 members above their 50-day average signal, a component in my composite thrust model. The bear killer indicator maintains an excellent long-term performance record, especially when an alert occurs after a 20% decline in the S&P 500, which is the case now.
With a new bear killer alert on Friday, the TCTM composite thrust model count has increased to 50%, triggering the first buy signal since November 2020 and the 39th alert since 1932. Let's assess the outlook for the S&P 500 after similar occurrences.
Similar signals preceded gains 82% of the time a year later
The composite thrust model has generated a signal 38 other times since 1932. While the alert struggled during the challenging 1929-42 period, returns, win rates, and z-scores were still excellent across medium and long-term time frames. The six and 12-month windows show a gain at some point in every single instance since 1943.
Signals that exclude the challenging 1929-42 period
When I remove the volatile 1929-42 secular bear market, the signal results look phenomenal. The worst drawdown across all time frames was 6.4% due to an alert that occurred ten months before the 1987 crash.
Tactical Composite Trend Model - Cautious Bull
With the new composite thrust model signal, the TCTM status changes to a cautious bull outlook. It will remain with that view for the next three months.
Suppose the long-term trend model turns positive between now and the expiration of the thrust window. In that case, the overall TCTM status will turn bullish. However, should the long-term trend model remain negative, and the thrust window expires, the TCTM status would revert to bearish. So, the TCTM model goes against the prevailing negative trend for a limited time. i.e., trust the thrust.
Data as of 8/12/22
| MODEL | Signal Count % | STATUS |
| Tactical Composite Trend Model (TCTM) | Cautious Bull | |
| Long-Term Trend Model | Negative as of 5/12/22 | |
| Composite Risk Warning Model | 0 | Neutral |
| Composite Recession Model | 37.5 | Neutral |
| Composite Washout Model | 40 | Neutral |
| Composite Thrust Model | 50 | Bullish |
| Composite Confirmation Model | 10 | Neutral |
| Composite Master New Bull Market Model | 46.67 | Neutral |
The TCTM is not a pure black-box model that says we should be all in or out. And it should act as a complementary tool to your research process.
To see any published research about this model, click here.
The Tactical Composite Trend Model (TCTM), created by Dean Christians, represents decades of professional trading and financial market research. The TCTM aims to provide traders and investors with key signals around identifiable market turning points.