
The surprising cyclicality of the energy sector

Key points
- The energy sector has shown consistent cyclicality in the past 25 years
- Seasonality is usually best not used as a standalone trading model - still, it has been quite helpful to energy traders who follow the cycles
- An important change in seasonal bias is approaching
The annual seasonal trend for XLE
The chart below displays the annual seasonal trend for the Energy Select SPDR ETF (ticker XLE).
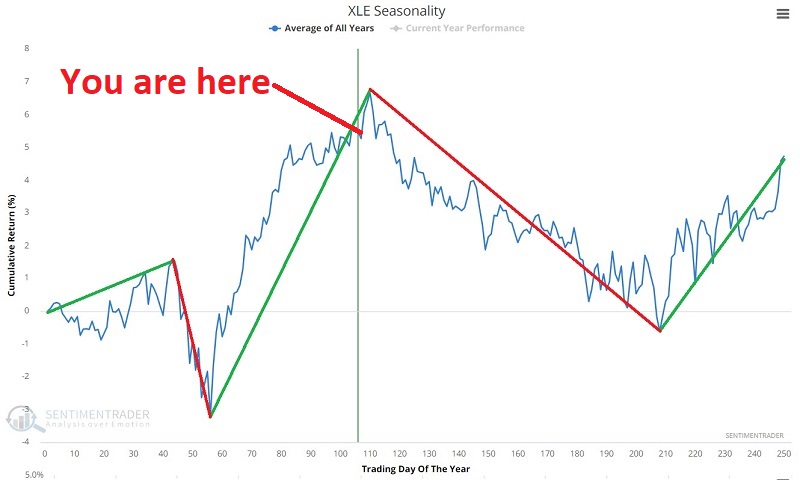
Note that several distinct favorable and unfavorable periods exist within the calendar year.
- Trading Day of Year (TDY) #208 through TDY #44 (the following year) = Favorable
- TDY #44 to TDY #56 = Unfavorable
- TDY #56 to TDY #110 = Favorable
- TDY #110 to TDY #208 = Unfavorable
How meaningful are these distinctions? Let's look at XLE performance in the past 24+ years to assess.
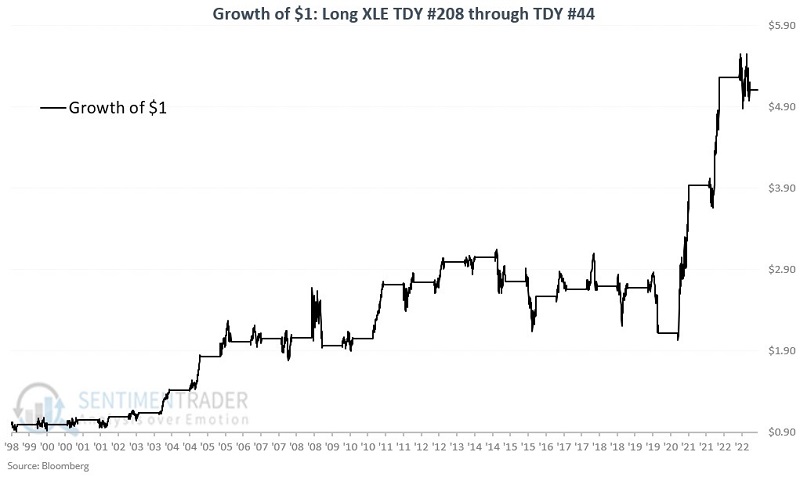
TDY #208 through #44
The chart below displays the growth of $1 if held in XLE only from the close of TDY #208 through TDY #44 each year since 1999. The cumulative gain equals +411%.
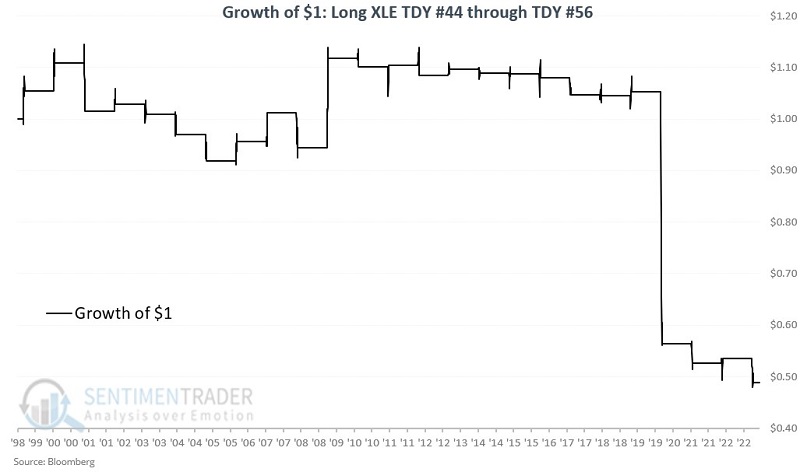
TDY #44 through #56
The chart below displays the growth of $1 if held in XLE only from the close of TDY #44 through TDY #56 each year since 1999. The cumulative return equals (-51%).
TDY #56 through #110
The chart below displays the growth of $1 if held in XLE only from the close of TDY #56 through TDY #110 each year since 1999. The cumulative gain equals +639%.
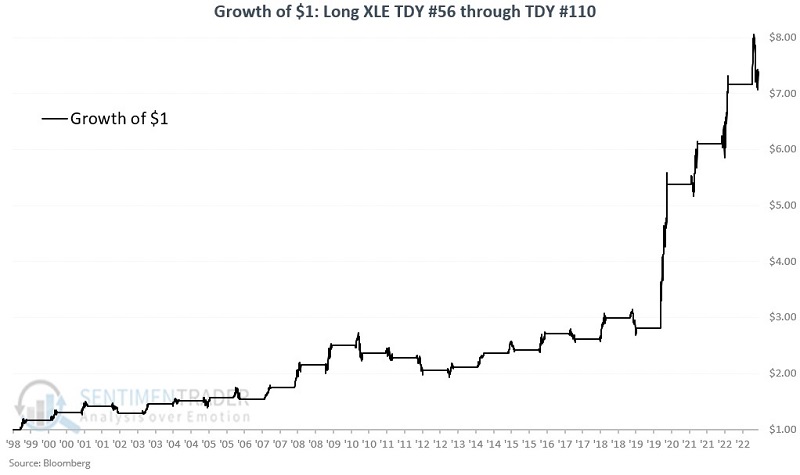
This current favorable period will end at the close on 2023-06-09.
TDY #110 through #208
The chart below displays the growth of $1 if held in XLE only from the close of TDY #110 through TDY #208 each year since 1999. The cumulative return equals (-66%).
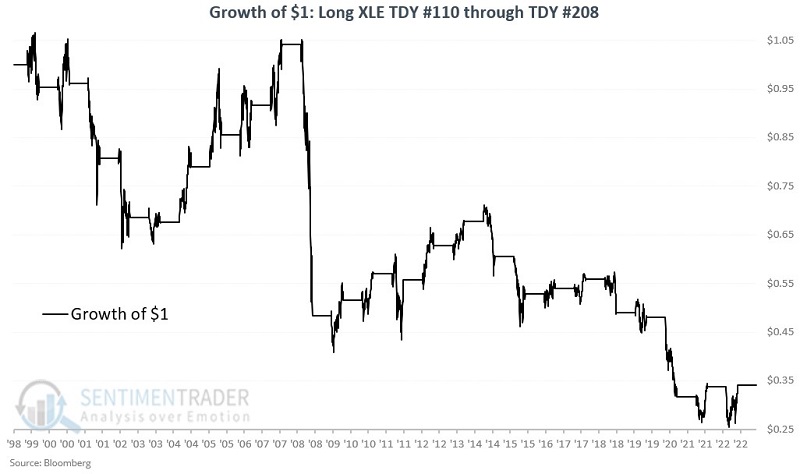
The next unfavorable period will begin at the close on 2023-06-09 and continue through 2023-10-31. This does not guarantee that the energy sector will decline in the months ahead. It merely alerts us to the potential for weakness, particularly if XLE fails to get back above its 200-day moving average and rolls over.
Combining favorable periods
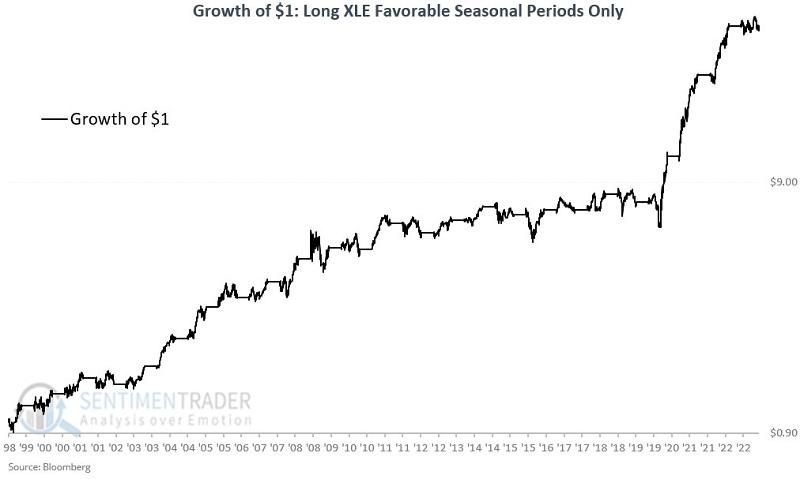
Let's focus solely on the two favorable periods. The chart below assumes a trader held XLE during TDY #208 through #44 and from TDY #56 through TDY #110 every year. The cumulative gain was +3,680%.
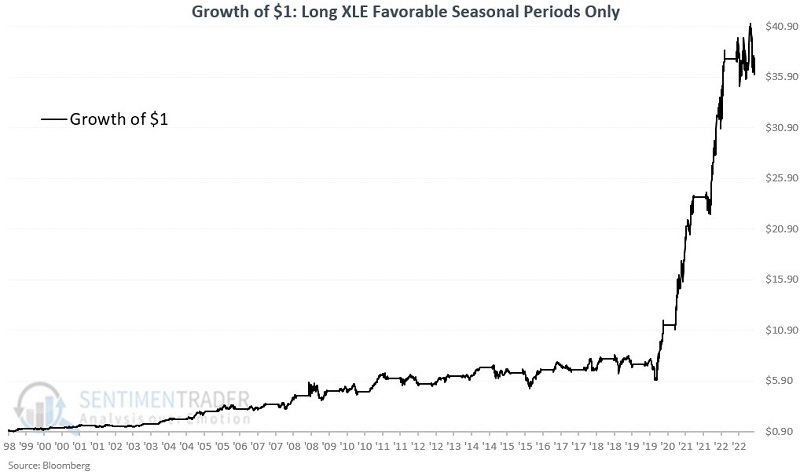
The chart below displays the same results on a logarithmic scale.
In the interest of "keeping it real" and to highlight the potential dangers in relying on seasonality as a standalone trading method, note in the drawdown chart below that holding XLE only during the favorable periods would have required a trader to sit through three separate drawdowns of -30%. 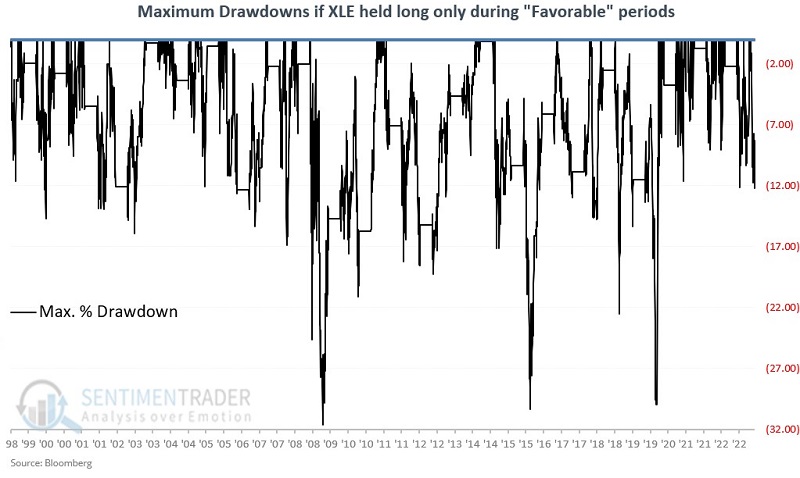
Remember, "Favorable Periods" does not imply "low risk", only a potentially higher probability of success if historical tendencies remain intact.
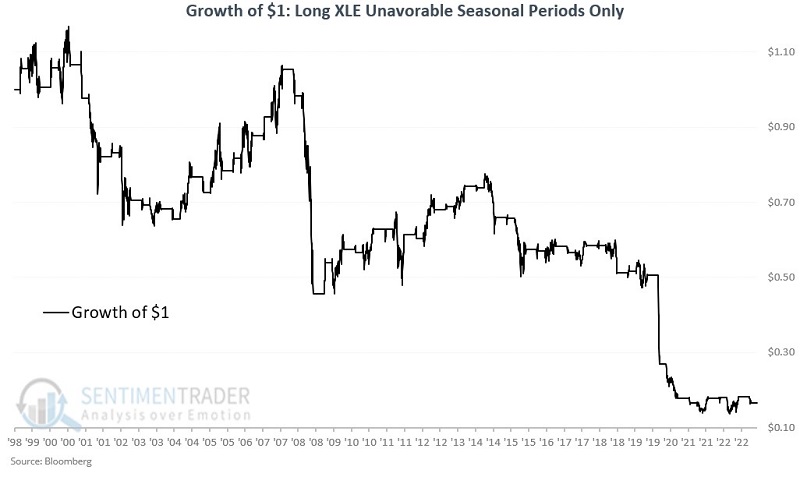
Combining unfavorable periods
Let's focus solely on the two unfavorable periods. The chart below assumes a trader held XLE during TDY #44 through #56 and from TDY #110 through TDY #208 every year. The cumulative return was -88%.
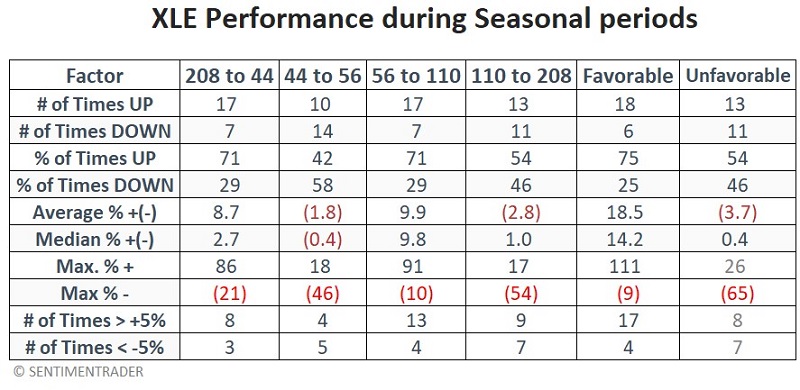
Summary of results
The table below displays the relevant performance figures for the four seasonal periods of the calendar year. It also shows results for combining the two favorable periods each year and the two unfavorable periods.
What the research tells us…
There is a right way and a wrong way to use seasonality. As compelling as the results above may be, I rarely advocate holding (or not holding) something solely because of the date on the calendar. Seasonality is best used to tell a trader or investor "where to look" and "which way to lean." With an unfavorable period approaching, it might make sense to consider a smaller allocation to the energy sector in the months ahead. However, it would be a mistake to assume that XLE is doomed to decline between now and the end of October.