
The surge in silver

Key points:
- Price has deviated 24% from the 50-day moving average
- Silver prices hit new highs while its moving averages have also moved excessively
- The exception to silver's signals is precisely why it is known as the "widowmaker"
Stretching to New Highs
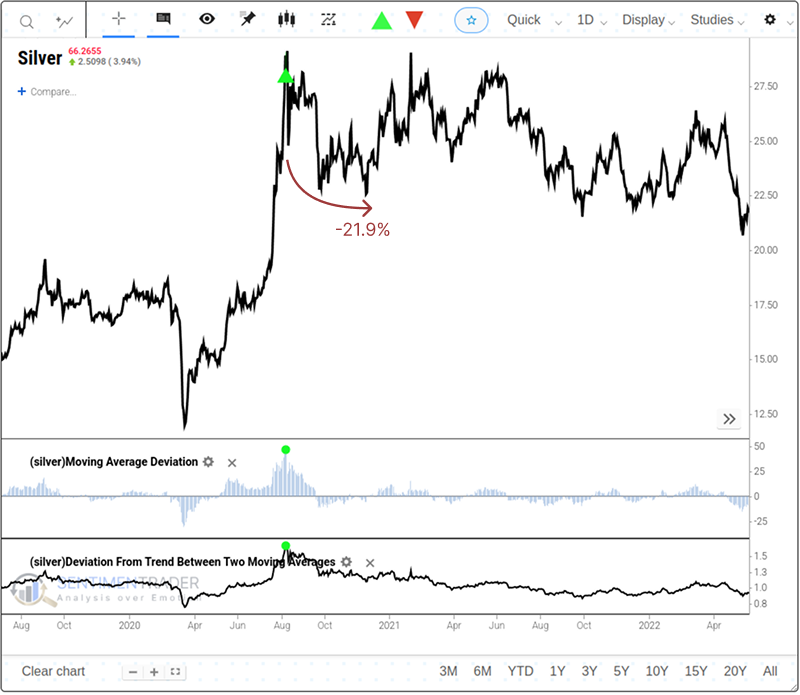
Silver prices have broken through their moving averages extremely sharply while hitting multi-year highs.
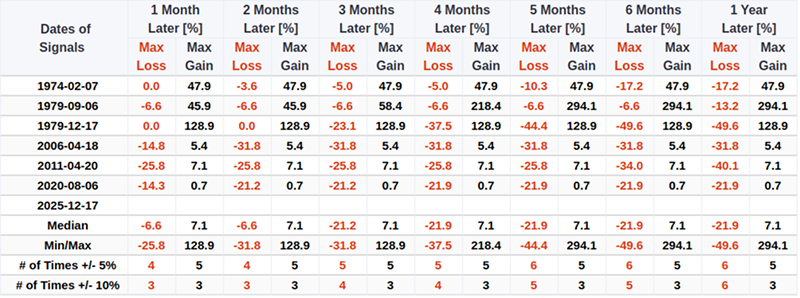
Silver prices have set new highs - a rarity over the past few decades - and currently traded more than 24% above the 50-day moving average and over 60% above the 200-day moving average. This level of deviation is historic. The most recent similar instance was August 2020, followed by a maximum loss of -21.9% in the subsequent months.
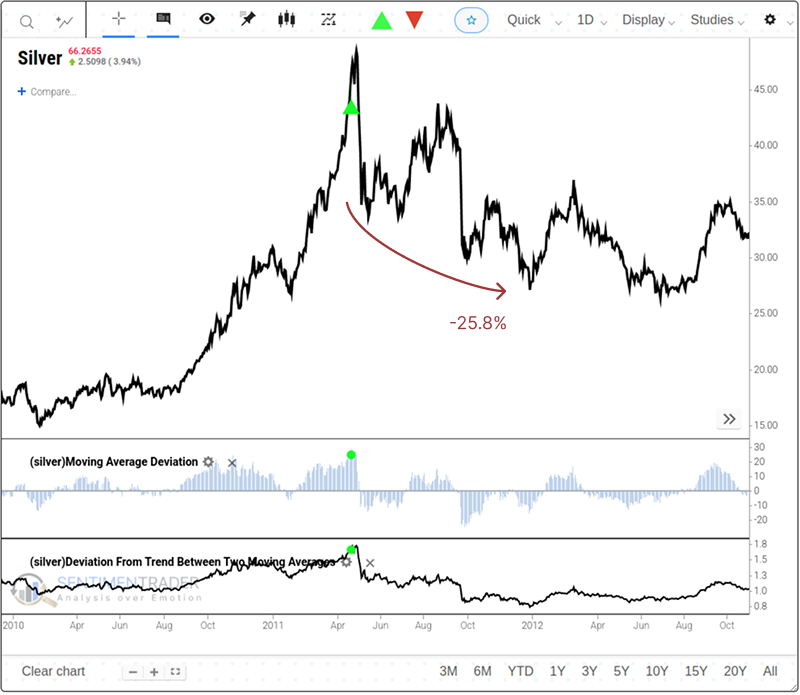
The last time such extreme conditions occurred was in April 2011, after which prices plummeted by a maximum of -25.8% in the following months and remained deeply in the red a year later (-29.6%).
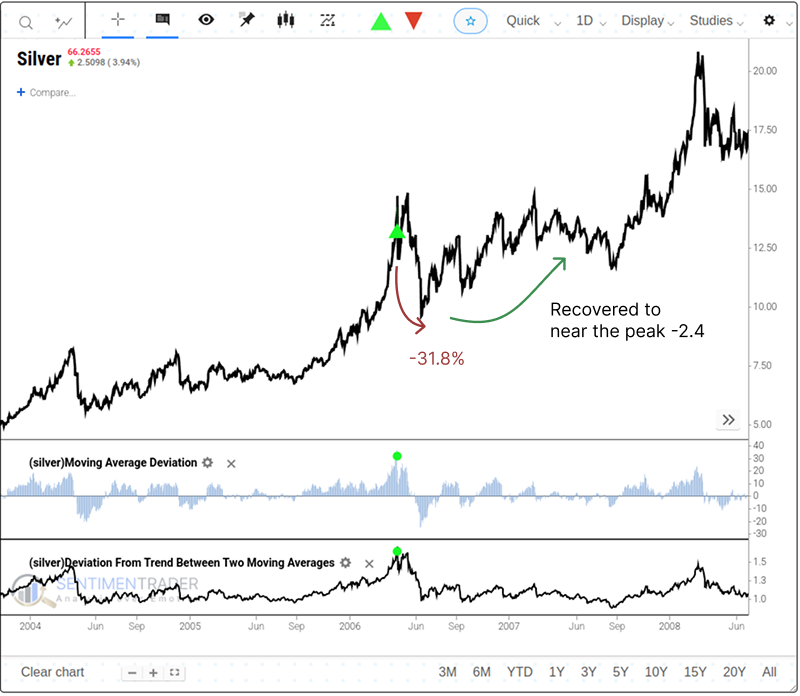
Prior to that, a similar situation took place in April 2006. Back then, silver prices retreated sharply over the next two months, falling by more than 27%. After that frenzied rally, silver prices cooled off quickly and traded almost sideways over the subsequent year, recovering only to 2.4% below the peak at that time.
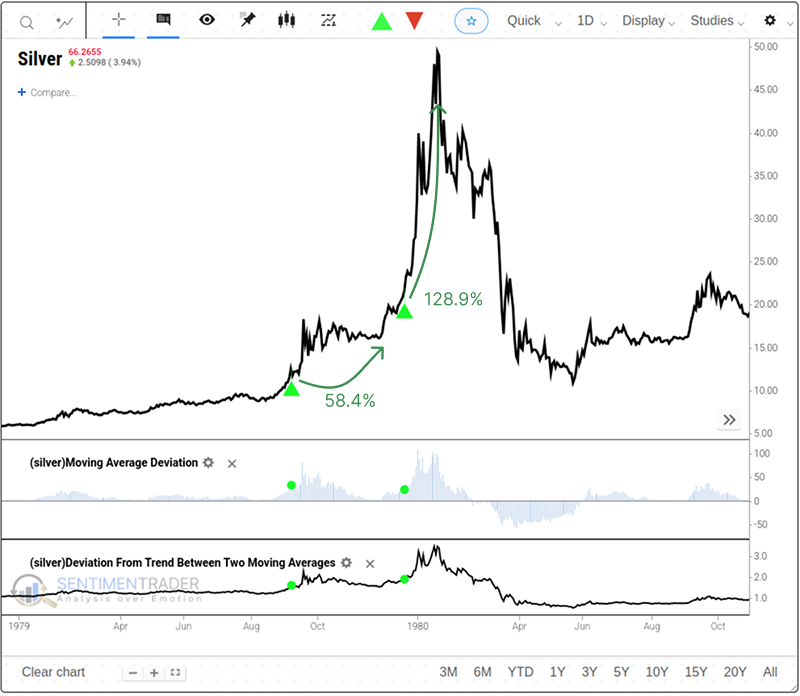
There has been only one extremely rare positive precedent for silver's current rally, which occurred in 1979. At that time, when silver prices reached the current extreme overbought level (September 1979), they did not collapse immediately but instead rose by a maximum of 58.4% over the following period. This upward trend did not stop and then triggered the same signal again; after that, prices soared by more than 128.9% in the next month, marking the peak of the famous Hunt Brothers silver manipulation case.
However, this is the only case in the table where substantial short-term profits were made under such extreme conditions (apart from a small rise in 1974). If you want to run this backtest and adjust the parameters to find other precedents, click here, then click the "Run Backtest" button.
The corresponding max gain/loss diagram for the signal is shown below.
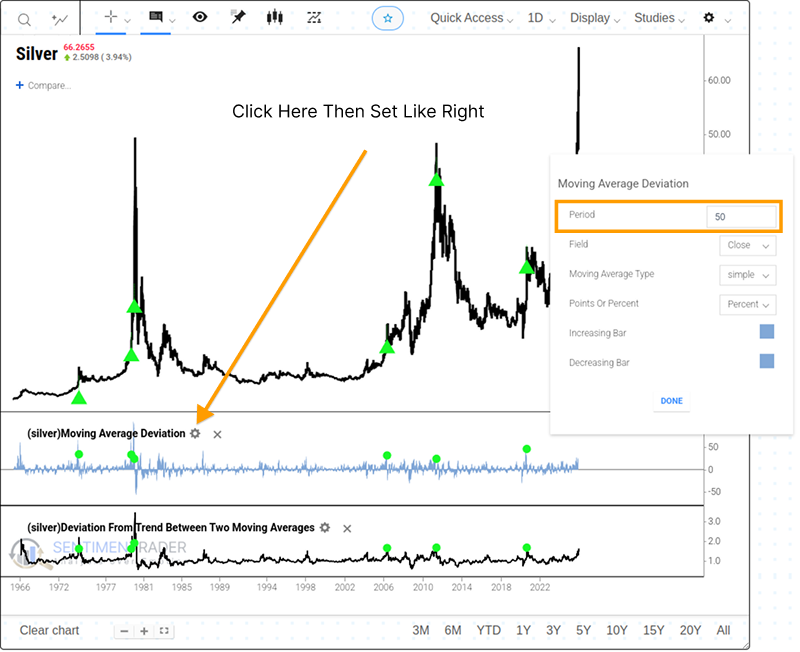
For new users, we can create such a backtest by following these steps:
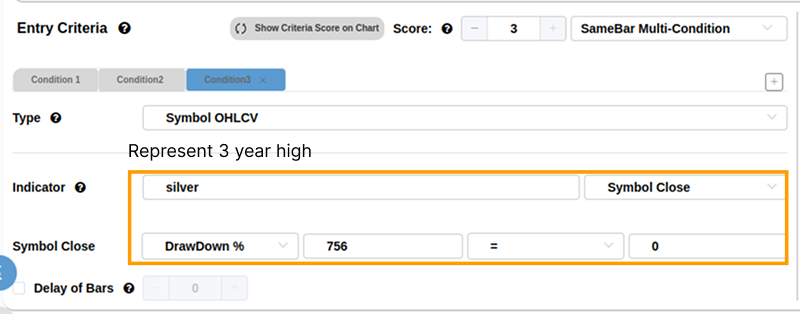
Set the three conditions as shown in the screenshots below.
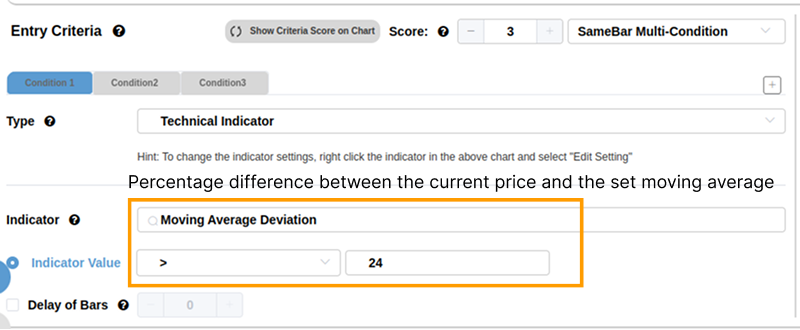
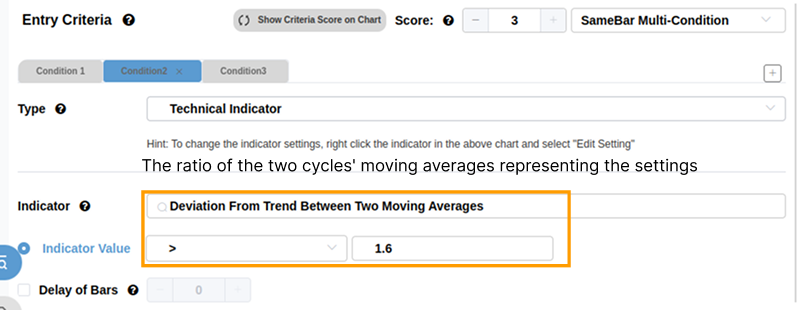
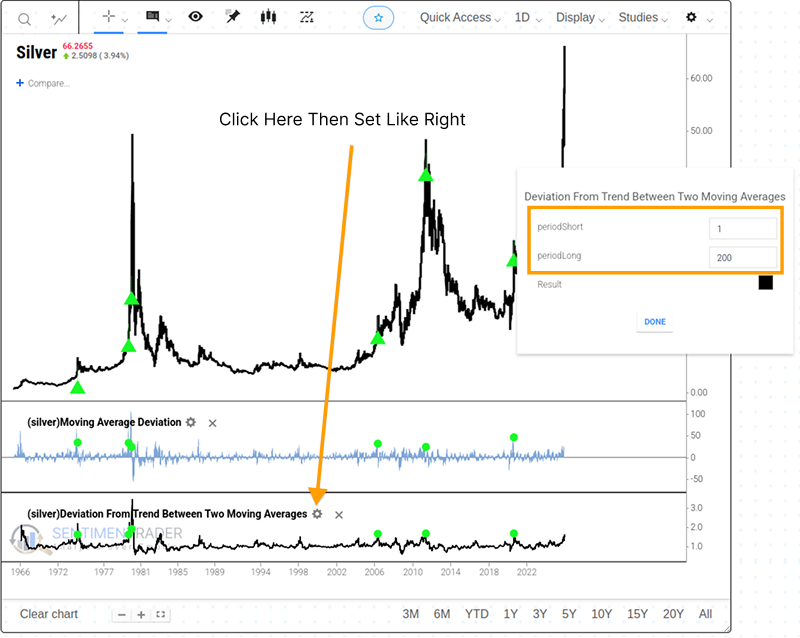
Then click the gear icon for this indicator on the chart to set the periods for the two indicators: set the period for Moving Average Deviation to 50, and set Deviation From Trend Between Two Moving Averages to 1 and 200 respectively.
Traders' Sentiment
As silver has been on an upward trend this year, we can see that its Optix has broken through 75 again. In the commodity market, we occasionally see market sentiment reach such levels, but this usually has no impact on future returns. Certain structural anomalies have hit the market, leading traders to completely abandon traditional analysis or valuation methods.
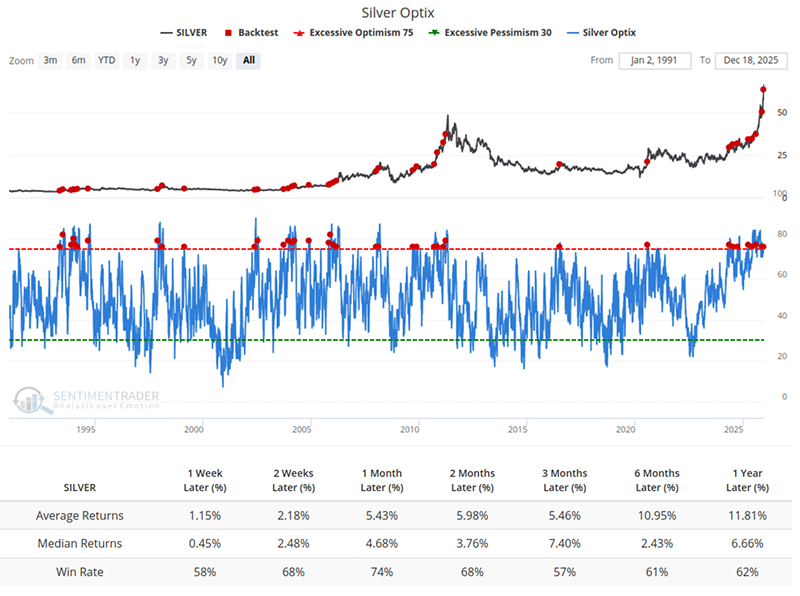
However, in the silver market, it is uncommon for market sentiment to reach the current level. When sentiment is at the current level, silver has a 74% win rate over the next month; over a longer time frame, the win rate is slightly higher than a coin flip, around 60%.
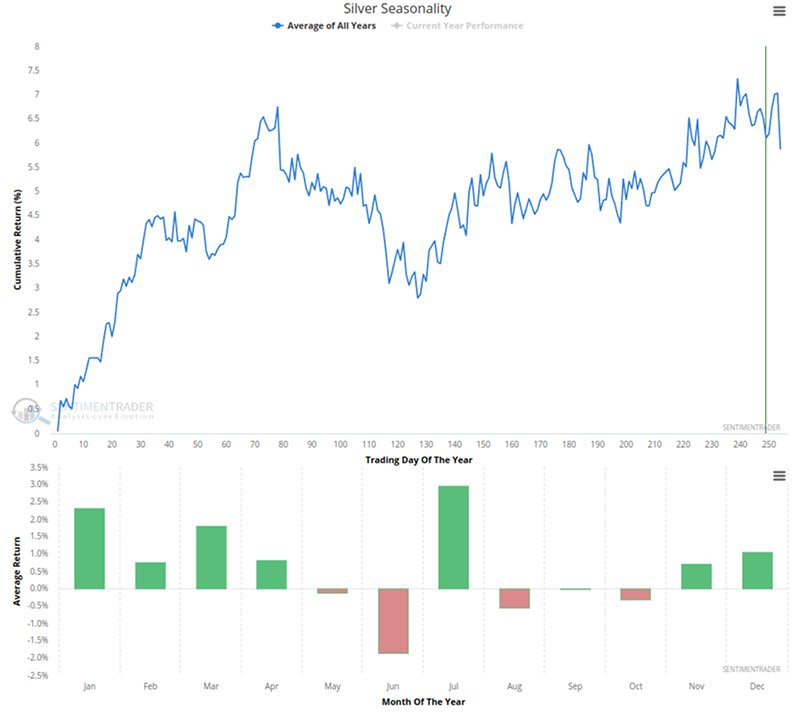
From a seasonal perspective, silver prices usually rise in the next few months of the following year. Nevertheless, silver has not aligned well with seasonality this year and has instead rallied strongly, even during periods that are typically weaker. Historical data is mixed on this, making it difficult to determine whether this is a good omen. Price movements in some years indicate that structural imbalances are emerging, while in others, the rally is merely a case of front-running.
What the research tells us...
The silver market is currently caught in an intense tug-of-war between short-term momentum and long-term gravity. Silver has long been known as the "widowmaker", similar to natural gas. It is an infamously elusive, volatile, and unpredictable market - relatively small in size, yet prone to jaw-dropping price moves that can wipe out leveraged investors entirely. Trading against extreme market moves, in either direction, yields returns about three-quarters of the time, but that "one time" can be fatal because the market will eliminate all capital that stands in your way.
Therefore, anyone attempting to establish a position in the silver market should do so in a risk-controlled manner. For example, the implied volatility of SLV options is at the lower end of its annual range, so buying put options is a reasonable strategy. It allows investors to express their outlook on the market without exposing their accounts to excessive risk in the event of a once-in-a-century abnormal move in silver prices (such as the current market conditions).