Products
SentimenTrader Trading Tools
‍
Backtest Engine
My Trading Toolkit
Correlation Analysis
Seasonality
Market Prediction
Indicators & Data API
‍
Proprietary Indicators & Charts
Market Data API
Strategies & Scanner
‍
50+ Trading Strategies
Smart Stock Scanner
Smart Option Scanner
Research Reports
‍
Research Solutions
Reports Library
Free Resources
Simple Backtest Calculator
Simple Seasonality Calculator
The Kelly Criterion Calculator
Sentiment Geo Map
Public Research Reports
Education
Sentiment Indicators
Technical Indicators
Pricing
Company
About
In the News
Testimonials
Client Success Stories
Contact
Log inLoginSign up
< BACK TO ALL REPORTS

The stock market in July of a Post-Election Year

Jay Kaeppel
2025-06-30
Is it better to invest in the Dow or the S&P 500 during July of post-election years? The short answer: It depends. For the longer answer, see inside.

Key Points

  • This note highlights the performance of the Dow Jones Industrial Average and the S&P 500 during July in Post-Election years
  • The key question appears to be "Are you more interested in the return on your money, or the return of your money?"
  • The Dow sports a higher win rate (and ten straight wins), but the S&P has outperformed overall

The stock market in July of post-election years

With July inbound, I wanted to highlight the historical performance during July of the Post-Presidential Election years for the Dow Jones Industrial Average (Dow) and the S&P 500 Index (SPX).

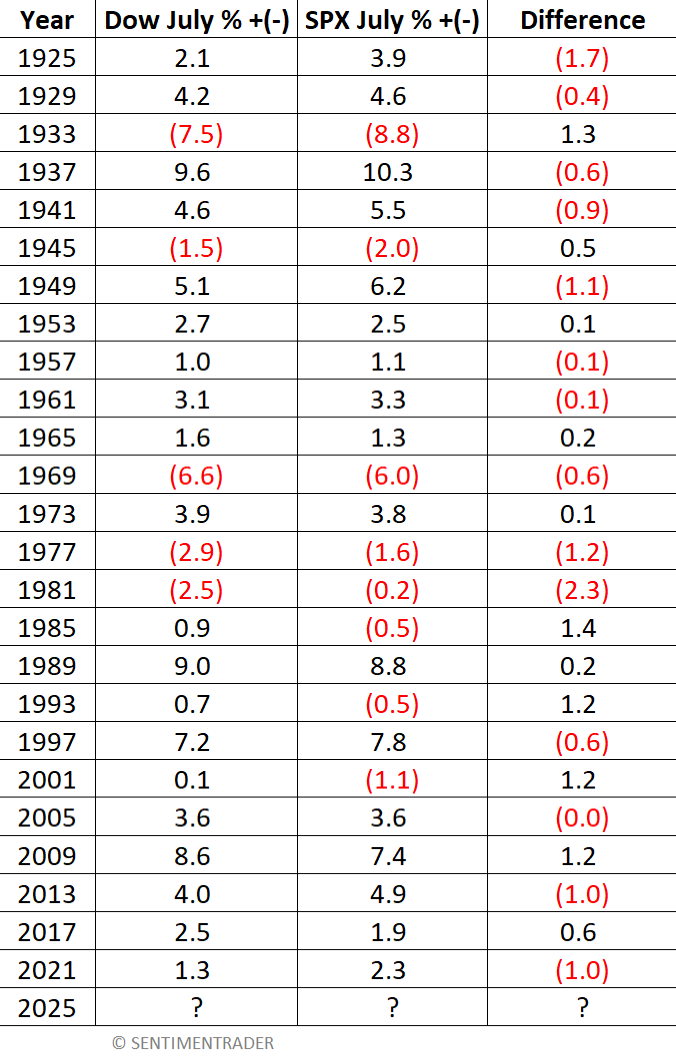
The table below displays the % +(-) price change for the Dow and SPX during July of each Post-Presidential Election year starting in 1925. 

NOTE: The "Difference" column is positive if the Dow outperformed and negative if SPX outperformed.

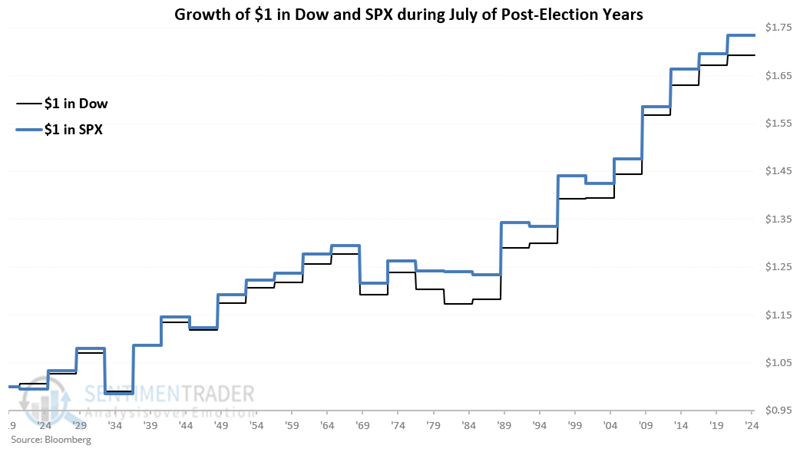
The chart below displays the cumulative growth of $1 invested in the Dow and SPX (price only data) ONLY during July of the Post-Election years since 1925.

The table below presents a summary of the results.
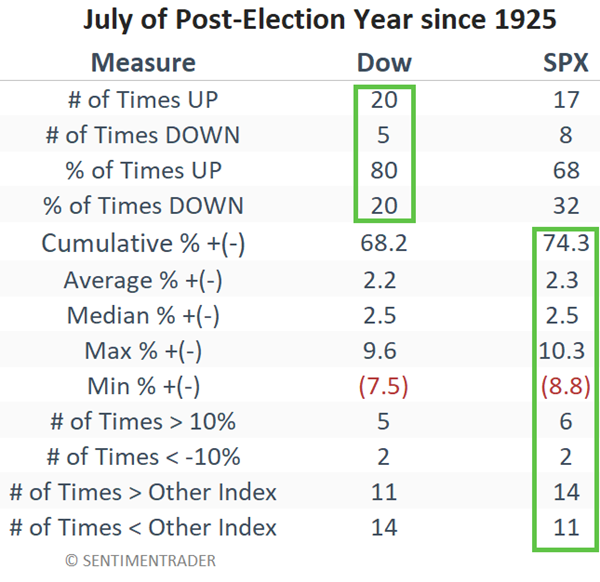
For the record:

  • The Dow has shown a gain 80% of the time, versus only 68% for SPX
  • The Dow has not shown a loss during a post-election July since 1981 (SPX has had three down post-election Julys since 1981)
  • However, SPX has outperformed the Dow during July in 14 of the 25 post-election years
  • Also, SPX has shown an overall outperformance (higher cumulative and average/median gains

What the research tells us

It isn't easy to draw conclusions. When it comes to July of post-election years, the Dow has been the more consistent winner (80% versus 68%). Still, the S&P 500 has outperformed the Dow more often than not (14 times versus 11 for the Dow) and showed higher cumulative, average, and median returns. If you are betting on a bullish July 2025, this one comes down to the old Will Rogers line: Are you more interested in the return "on" your money (then favor SPX) or the return "of" your money (then favor Dow).

Lastly, the Dow has gained during July in each of the last ten post-election years. Will that streak continue? Or is the law of averages due to re-emerge?

PRODUCTS
SentimenTrader
Trading Tools
Indicators & Data API
‍
Strategies & Scanner
‍
Research Reports
FREE
RESOUrCES
Simple Backtest
Calculator
Simple Seasonality
Calculator
The Kelly Criterion
Calculator
Sentiment Geo Map
‍
Public Research Reports
‍
Education
Sentiment Indicators
‍
Technical Indicators
‍
Pricing
Bundle pricing
‍
FAQ
‍
Announcements
‍
COMPANY
‍
About
‍
In the News
‍
Testimonials
‍
Client Success Stories
CONTACT
‍
General Inquiries
‍
Media Inquiries
‍
Financial Professionals Inquiries
‍
© 2026 Sundial Capital Research Inc. All rights reserved.
Setsail Marketing
TermsPrivacyAffiliate Program
Risk Disclosure: The information and tools provided are for research and analytical purposes only and are not intended as investment advice. Market analysis involves uncertainty, and outcomes may differ from expectations. Users should conduct their own due diligence and consider their individual circumstances before making any financial decisions. Past performance is not necessarily indicative of future results.

Hypothetical Performance Disclosure: Hypothetical performance results have many inherent limitations, some of which are described below. No representation is being made that any account will or is likely to achieve profits or losses similar to those shown; in fact, there are frequently sharp differences between hypothetical performance results and the actual results subsequently achieved by any particular trading program. One of the limitations of hypothetical performance results is that they are generally prepared with the benefit of hindsight. In addition, hypothetical trading does not involve financial risk, and no hypothetical trading record can completely account for the impact of financial risk of actual trading. for example, the ability to withstand losses or to adhere to a particular trading program in spite of trading losses are material points which can also adversely affect actual trading results. There are numerous other factors related to the markets in general or to the implementation of any specific trading program which cannot be fully accounted for in the preparation of hypothetical performance results and all which can adversely affect trading results.

Testimonial Disclosure: Testimonials appearing on this website may not be representative of other clients or customers and is not a guarantee of future performance or success.