
The Stock Market and the Mid-Decade Bulge

Key points:
- A little-known cyclical trend is for the stock market to typically perform better during the middle part of the decade than during other periods
- I refer to this period as the "Mid-Decade Bulge", which varies depending on whether we are in an "even" decade or an odd decade
- The data below summarizes the historical results and details where we are currently within this cycle
Defining the Mid-Decade Bulge
Our test will compare the performance of the stock market during the "middle" of each decade (defined more precisely in a moment) to performance during the rest of the decade.
For our test, we will use monthly closing price data for the Dow Jones Industrial Average from 1900 to the present. The "bulge" period will differ depending on whether we are in an "even" decade or an "odd" decade.
Even decades: 1900-1909, 1920-1929, 1940-1949, 1960-1969, 1980-1989, 2000-2009, and 2020-2029.
Odd decades: 1910-1919, 1930-1939, 1950-1959, 1970-1979, 1990-1999, 2010-2019.
A closer look at "Even" decades
For Even decades, we have defined the Mid-Decade Bulge (MDB) as:
- October 1st of Year 2 through March 31st of Year 6
- Plus the last three months of Year 6
So, for "Even" decades, the MDB encompasses 45 total months.
For the current decade, the Mid-Decade Bulge began on October 1st, 2022, and will extend through March 31st, 2026. It will then resume on October 1st, 2026, and conclude on December 31st, 2026.
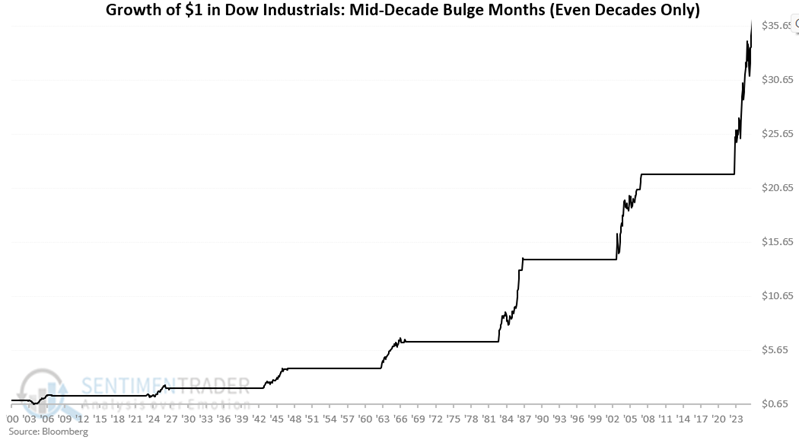
The chart below displays the hypothetical growth of $1 invested in the Dow Industrials only during these 45 months, starting with even decades from 1900 and updated through December 29, 2025.
 The chart below shows the same results displayed on a logarithmic scale.
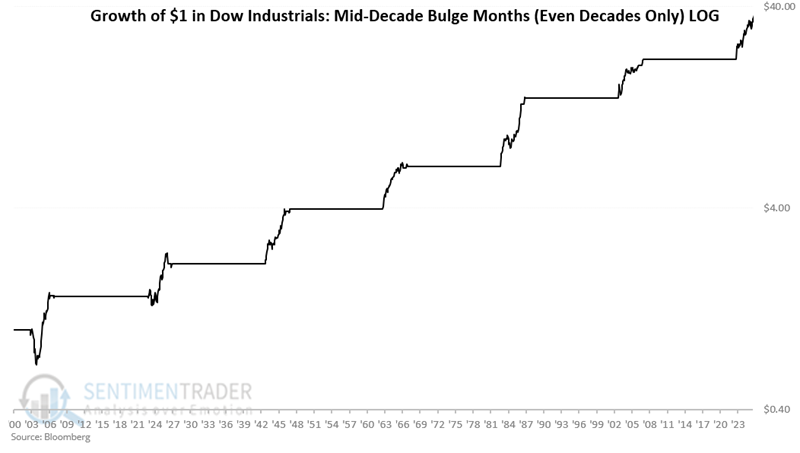
A hypothetical $1 grew to $36.38, representing a 3,538% increase.
A closer look at "Odd" decades
For Odd decades, we define the Mid-Decade Bulge (MDB) as:
- October 1st of Year 4 through March 31st of Year 6
- Plus the last three months of Year 6
So, for "Odd" decades, the MDB encompasses 21 total months.
The next odd-year Mid-Decade Bulge will begin on October 1st, 2034, and will extend through March 31st, 2036. It will then resume on October 1st, 2036, and conclude on December 31st, 2036.
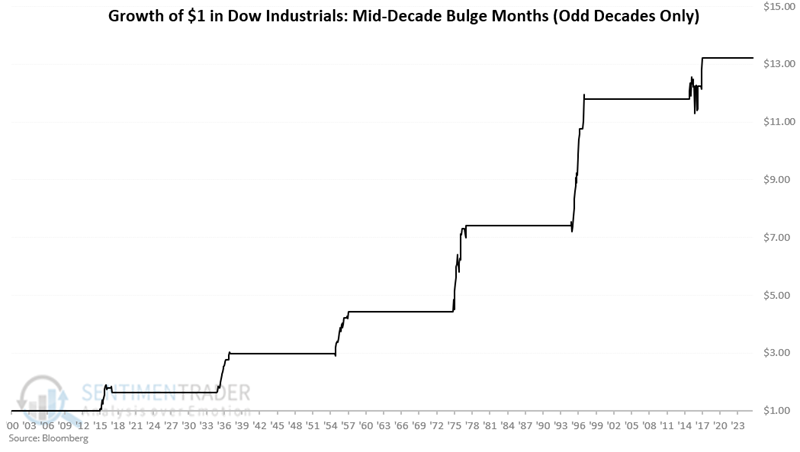
The chart below displays the hypothetical growth of $1 invested in the Dow Industrials only during these 21 months during odd decades starting with 1910.
The chart below shows the same results displayed on a logarithmic scale.
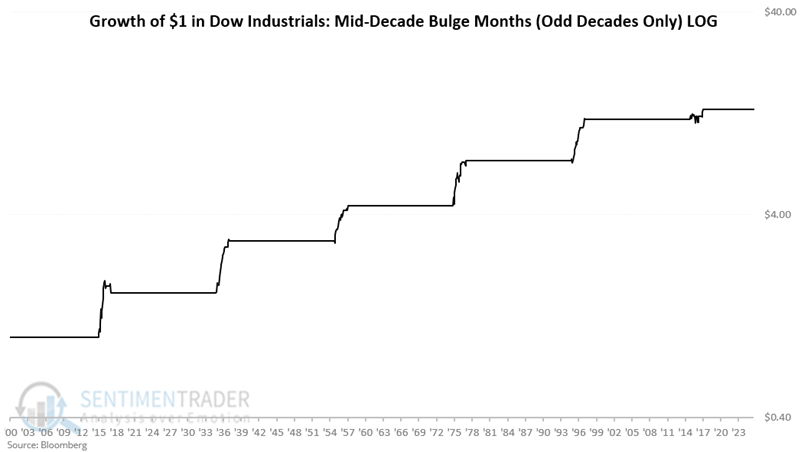
A hypothetical $1 grew to $13.23, representing a 1,223% increase.
Combining Even and Odd Decades
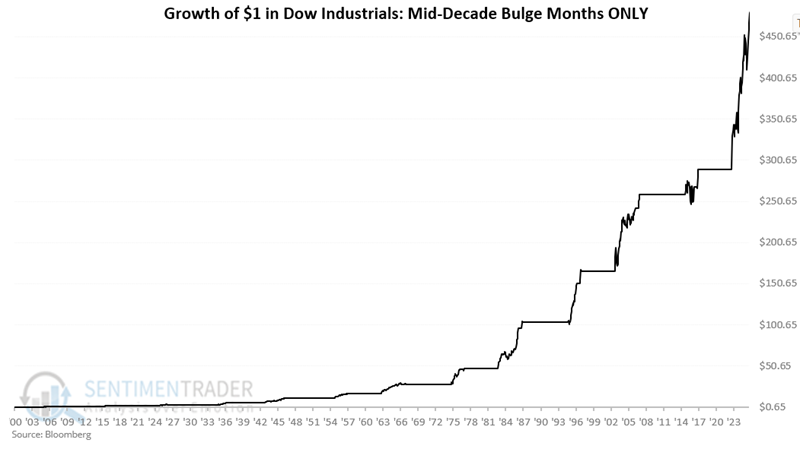
The chart below displays the hypothetical growth of $1 invested in the Dow Industrials only during all MDB months as defined above.
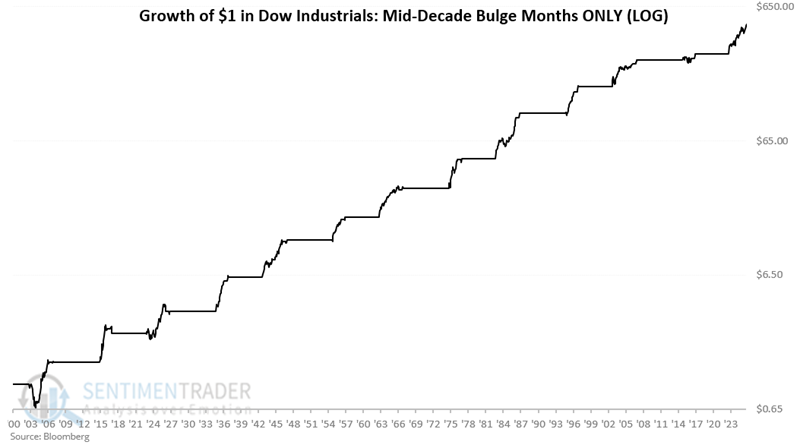
The chart below shows the same results displayed on a logarithmic scale.
A hypothetical $1 invested in all Mid-Decade Bulge months since 1900 would have grown to $481.33, or +48,033%, through November 2025.
How about non-Mid-Decade Bulge months?
Let's cut to the chase. Overall, non-MDB months showed a net gain since 1900. However, while the Dow Industrial index gained over 48,000% during MDB months, the cumulative gain during "All Other Months" is just +105%. Let's take a closer look.
Over the course of 20 years, there are a total of 240 months. Over 20 years, only 66 of those 240 months qualify as Mid-Decade Bulge months. We see the cumulative performance of those 66 months in the chart above. How did the Dow perform during the other months? The chart below displays the hypothetical growth of $1 invested in the Dow Jones Industrial Average during all Non-Mid-Decade Bulge months starting in 1900. $1 grew to $2.05, representing a 104.8% increase.
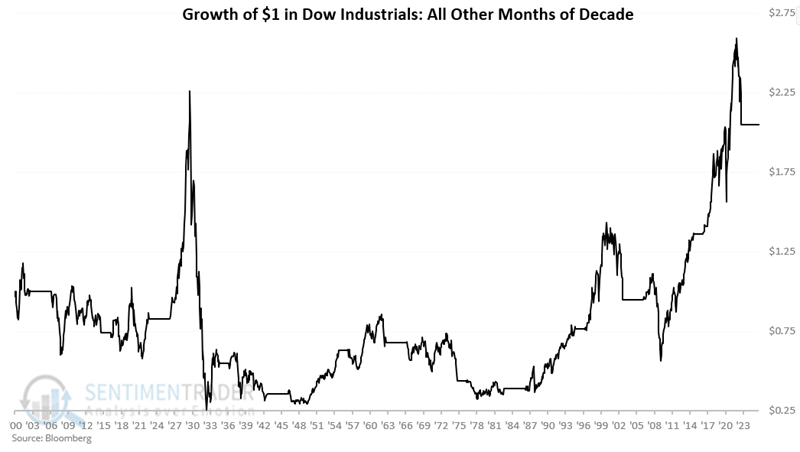
We cannot accurately describe non-MDB months as "bearish" for stocks. Nevertheless, the key contrast is this: Mid-Decade Bulge months have, for the most part, been "money in the bank" for stock investors over the past 125 years. Non-MDB months have been much more "hit or miss," as you can see in the chart above.
Comparing Mid-Decade Bulge Months to All Other Months
The table below displays decade-by-decade percentage returns for both "Mid-Decade Bulge" months and "All Other Months."
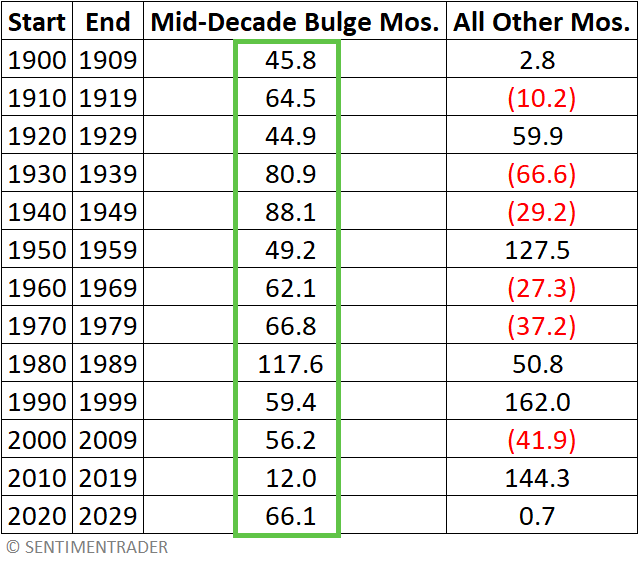
The table below summarizes performance by decade for both Mid-Decade Bulge months and All Other Months (Note: The current decade (2020-2029) is not included in the results below).
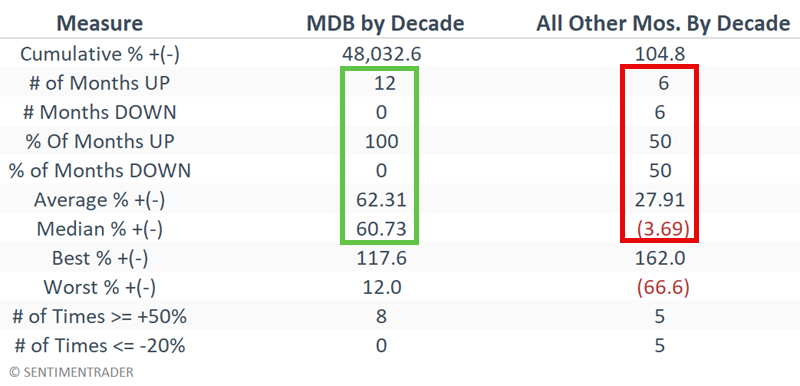
The key takeaways are these:
- MDB months showed a gain every decade since 1900; All Other Months are 50/50
- The Median gain per decade for MDB months is over 60%; All Other Months show a median return of -3.7%
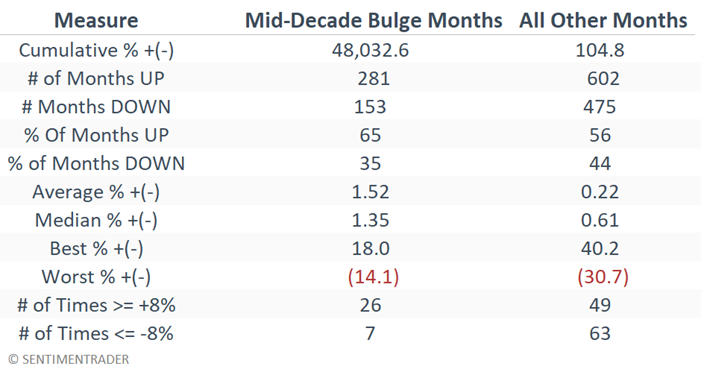
Lastly, the table below summarizes the performance of individual monthly Dow returns during the 28% of all months that comprise the "Mid-Decade Bulge" months, versus the 72% of "All Other Months."
What the research tells us…
Should stock market investors only invest during Mid-Decade Bulge months and stand aside all the rest? Not at all. The results above say nothing about the expected stock market performance during non-MDB months. The best approach to using this data is as follows: During Mid-Decade Bulge months, give the bullish case for the stock market the benefit of the doubt; during non-Mid-Decade Bulge months, consider an alternative indicator. As detailed above and here, history suggests the potential for strength in the stock market during the first and fourth quarters of 2026.