
The state of corporate insiders

Key points
- Corporate insiders know their companies best, and it is helpful to pay attention when they act a particular way en masse
- Heavy insider buying is almost invariably a favorable sign for the next 1-3 years for stocks
- Insider selling is typically not as useful of a bearish signal as heavy buying is of a bullish signal - unless it reaches an extreme
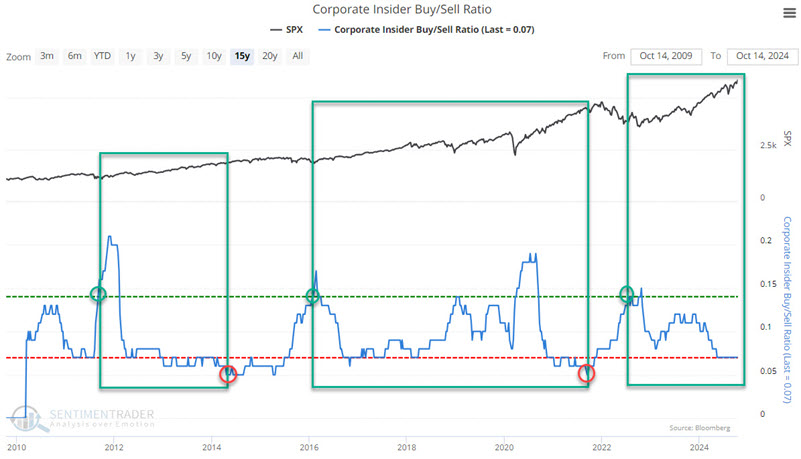
The Corporate Insider Buy/Sell Ratio
The insider activity database we use is from Bloomberg and goes back to March 2010. This is not a lot of data to work with. However, we have chosen to use it as it provides the most reliable database we could find. Some of what follows is based on my earlier work with data from a different source.
Our Corporate Insider Buy/Sell Ratio indicator shows a ratio of the total number of corporate insiders of S&P 500 companies that have bought shares on the open market during the past six months versus those that have sold shares. Because insiders typically only buy if they have confidence that their company (and stock) will do well, insider buying is considered a stronger signal than insider selling. When buying picks up quickly and dramatically, it tends to be an excellent sign for the stock market, so quick increases in this ratio tend to be a positive sign for stocks.
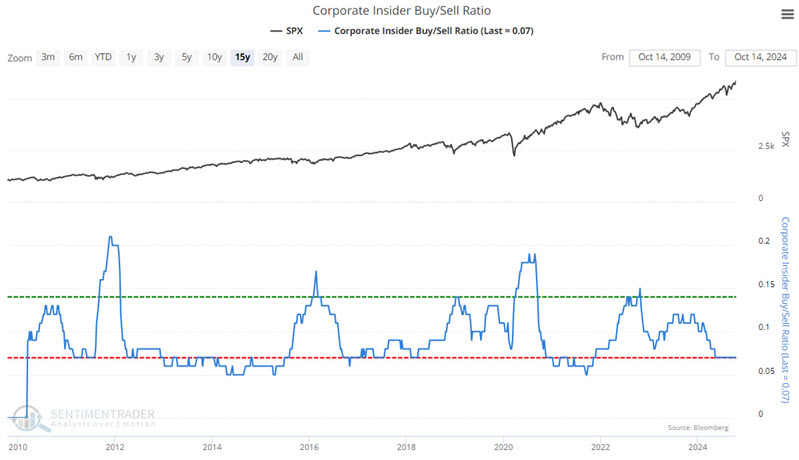
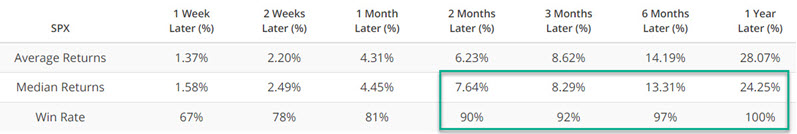
The chart below highlights all dates when the indicator registered a weekly reading of 0.14 or higher. We see five distinct periods.
The table below summarizes S&P 500 performance following all dates (including overlaps) highlighted in the chart above. Note the very favorable performance results, particularly for six and twelve months.
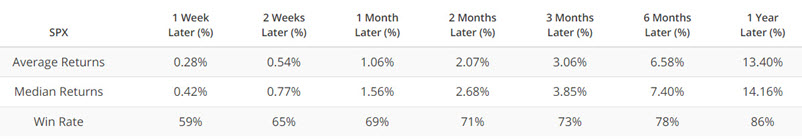
For comparison, the table below summarizes SPX performance for all database dates starting in 2010. Note that results are lower across the board.
The bottom line: When insiders aggressively buy shares, you should probably consider doing the same.
A systematic approach to insider activity
What follows is not explicitly intended to be used as a standalone trading model. However, it applies specific rules to make the interpretation of insider activity somewhat more systematic.
First, note that the "model" below does not give "buy" and/or "sell" signals per se. Instead, at any given time, it is rated as "favorable" or "neutral." When the status is "favorable," it suggests that investors should be aggressive in playing the long side of the stock market. When the status is "neutral," no inference should be taken either way.
Our insider database is updated weekly on Monday (except for a market holiday). However, we will review the latest week's data at the close of the current week's trading (typically Friday).
The rules:
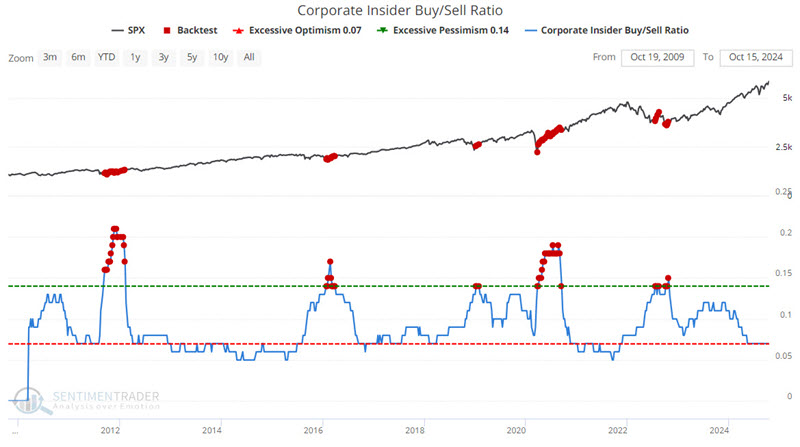
- If the Corporate Insider Buy/Sell Ratio is reading 0.14 or higher, the model status is considered "favorable" for stocks
- Once the model reaches "favorable" status, it maintains a "favorable" rating until:
- The Corporate Insider Buy/Sell Ratio touches a reading of 0.05, OR
- 156 weeks (i.e., three years) since the last 0.14 or higher reading goes by
The chart and table below highlight the favorable periods and S&P 500 results.
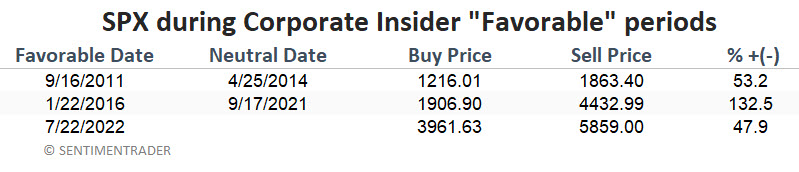
The last line of data in the table above is through 2024-10-15.
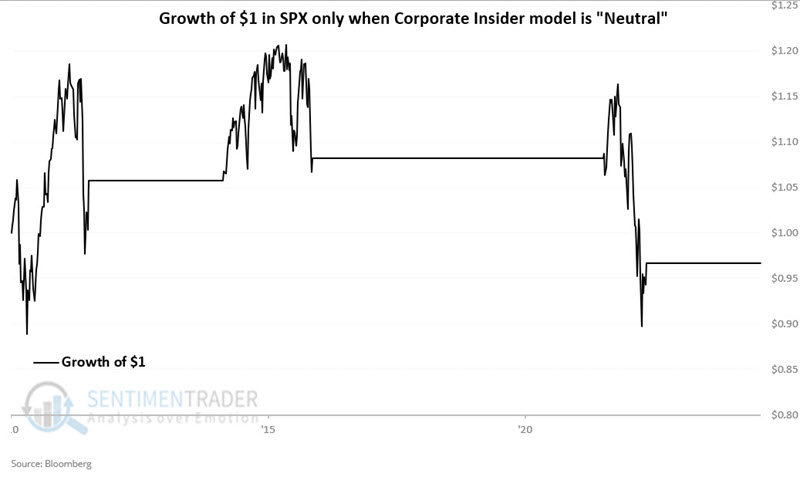
- The first favorable period began on 2011-09-16, when the ratio rose to 0.14, and ended on 2014-04-25 when it fell to 0.05. During those 31 months, the S&P 500 gained +53.2%. Over the next 21 months, while the model was "neutral," the S&P 500 gained +2.3%.
- The second favorable period began on 2016-01-22, when the ratio rose to 0.14, and was extended when it rose above the 0.14 level in 2019 and 2020. The favorable period ended on 2021-09-17 when the ratio fell to 0.05. During these 68 months, the S&P 500 gained +132.5%. Over the next ten months, while the model was "neutral," the S&P 500 lost 10.6%.
- The third and most recent favorable period began on 2022-07-22 when the ratio rose to 0.14. The model remains in favorable status as of this week. The S&P 500's gain so far has been +47%. If the ratio does not move back above 0.14, the model will return to "neutral" status on 2025-10-31 or when the ratio drops to 0.05 or lower, whichever comes first.
The chart below displays the hypothetical growth of $1 invested in the S&P 500 only when the model detailed above is "favorable."
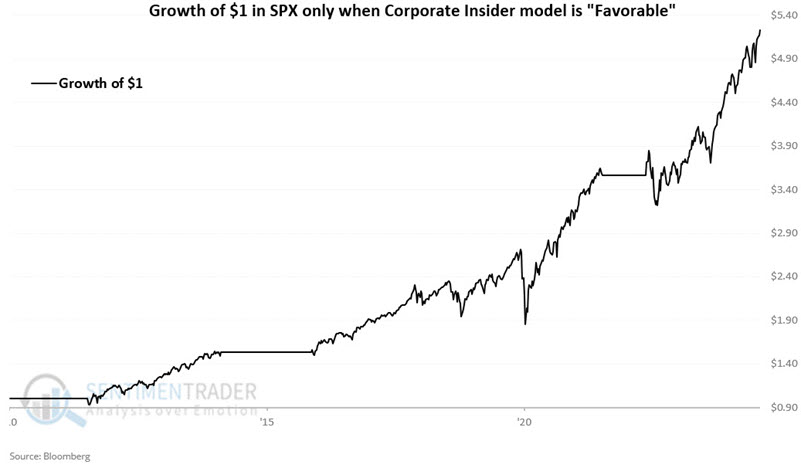
The chart below displays the hypothetical growth of $1 invested in the S&P 500 only when the model detailed above is "favorable."
What the research tells us…
It bears repeating that corporate insider activity is best used not as a standalone trading "system" - triggering "All In" or "All Out" signals - but as a "weight of the evidence" tool. Insider buying can often be "too early" - i.e., they may start buying into a market decline and keep buying as the market tanks. Because they typically have a multi-year time frame, this almost invariably works out well as they buy when their companies' shares are down or in the process of bottoming out and then wait patiently for a rebound and rally. Not every investor is wired to invest this way. Likewise, corporate insider selling does not necessarily generate "timely" sell signals anywhere near a notable market top. The simple method highlighted above does an excellent job of allowing investors to designate insider activity as "favorable" or "not meaningful" at any given time. For now, that approach is still sitting in the "favorable" camp.