
The stars may align for silver

Key points:
- In October, there were several indicators flashing bullish signals for silver, which has since rallied 20%
- There were also potential caveats at the time, which are no longer a factor
- Silver could be positioning for a significant advance that may take many months to play out
Silver bearish caveats fading
In October, I highlighted several indicators flashing significant bullish signals for silver. Those took hold as the metal has since rallied 20%.
In the original article, one of the caveats to a bullish outlook for silver was the trend of the Euro. As the two markets tend to be highly correlated, the bearish downtrend in the Euro was a potential weight on silver's shoulders.
That weight - at least for the moment - has been lifted. The chart below displays a weekly bar chart for the iShares Euro Trust ETF (FXE) with 5-week and 30-week moving averages. The 5-week average has now popped back above the 30-week average, thus lending weight to the bullish case for silver.
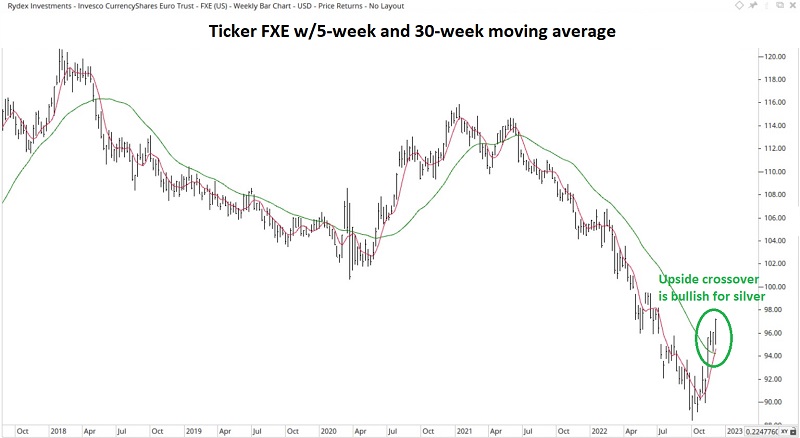
This is not precision market timing. But the implications are unmistakable. This trend change for the Euro does not guarantee a silver rally. However, it does move this indicator from the bearish side of the ledger to the bullish side.
Seasonal dark clouds are soon to part
Silver has shown two relevant seasonal tendencies over the years. The first is to be volatile and typically trend lower in the 4th quarter of the year. The second is to bottom out in early December and trend higher during the first month and a half of the new year.
In the annual seasonal trend chart below, we see that silver is upon its annual seasonal low, the rest of December can be very choppy, and the first part of the new year is the most seasonally favorable time of the year.
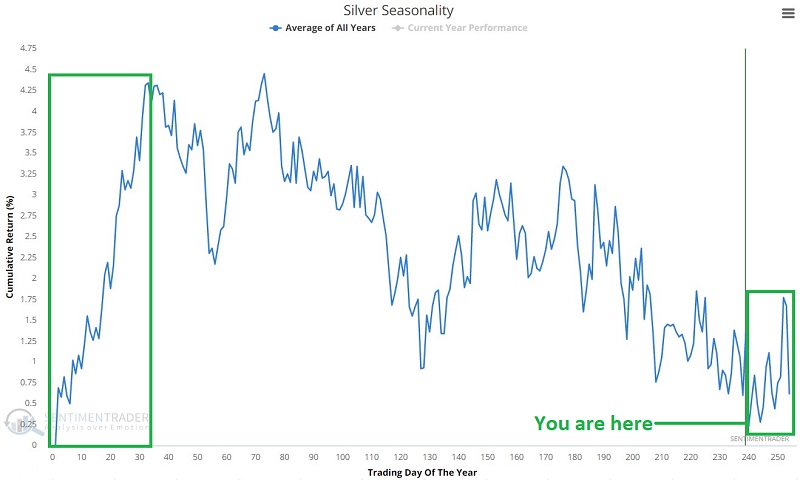
It must always be pointed out that annual seasonal trend charts are not roadmaps; they merely highlight historical tendencies. There is no guarantee that any given seasonal trend will work the next time. The point here is that seasonality is now flipping from unfavorable to favorable.
Indicator signals from the original article remain in play
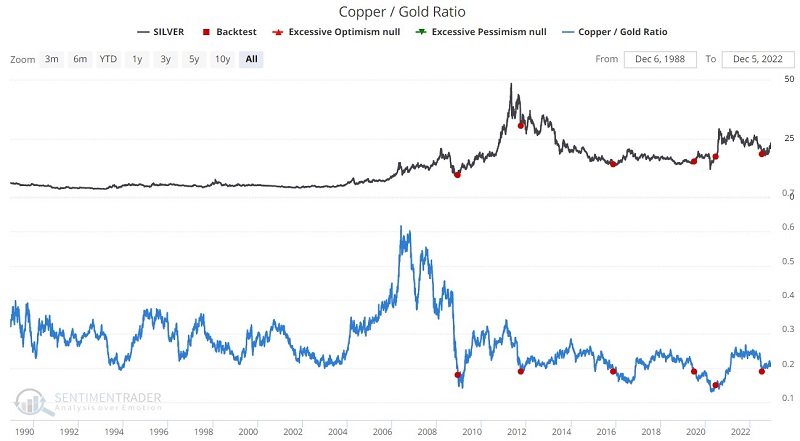
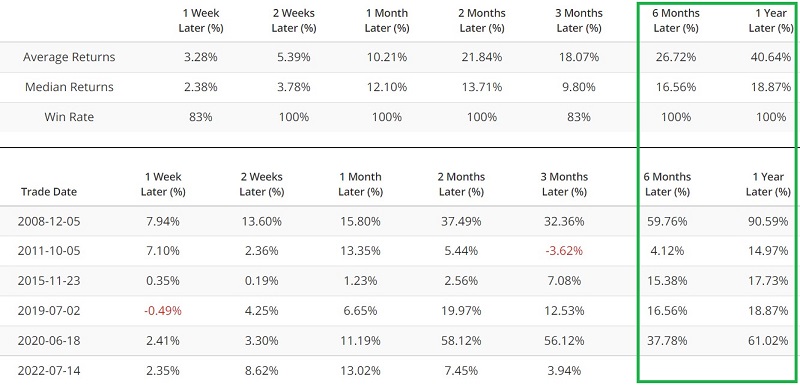
The chart below displays those dates when the Copper/Gold Ratio crossed below 0.19 for the first time in a year. While signals are rare, note in the table below that six and twelve-month returns for silver following a signal tends to be quite robust. The latest signal remains a bullish tailwind for silver into July 2023.
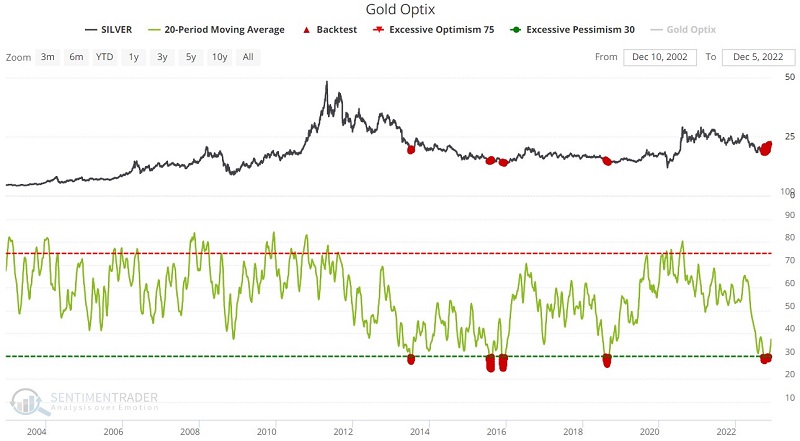
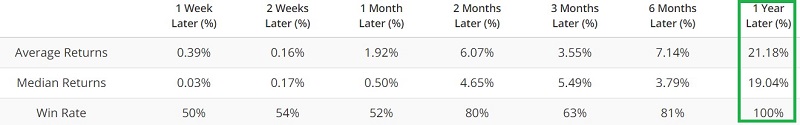
The same is true for Gold Optix. The chart displays all days when the 20-day average for Gold Optix was below 30%, and the table summarizes silver performance following those dates. Once again, we see highly favorable results for silver. Recent signals occurred in September, October, and November 2023, suggesting continued significant upside potential for silver.
One more long-term confirming indicator for silver
The relationship between silver and the S&P 500 Index can offer a clue regarding when silver is likely to exhibit significant strength or weakness.
The monthly chart below displays the ratio of silver versus the S&P 500 Index along with 8-month (green line) and 24-month (red line) exponential averages. It is considered a favorable sign for silver when the 8-month EMA is above the 24-month EMA and vice versa.
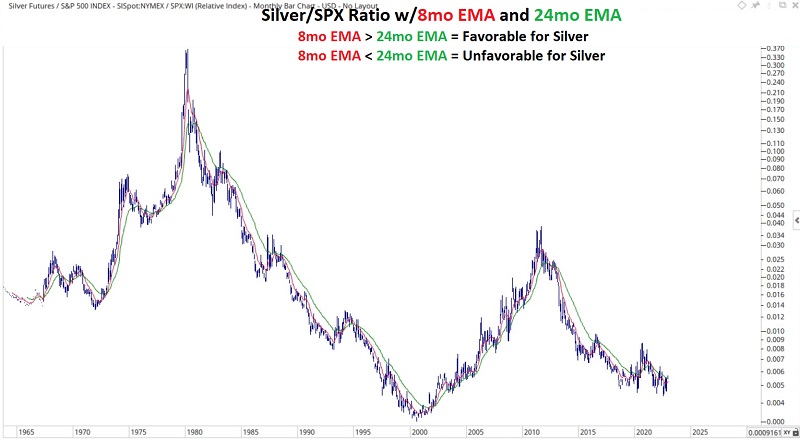
Like the Euro trend-following indicator, this one is not going to be useful for short-term trading. The objective of this indicator is to mostly stay on the right side of the huge, multi-year advances and declines that silver is known for.
To appreciate the usefulness of this simple end-of-month measure, the chart below displays the hypothetical cumulative $ gain/(loss) depending on whether the 8-month EMA is above (black line) or below (blue line) the 24-month EMA.
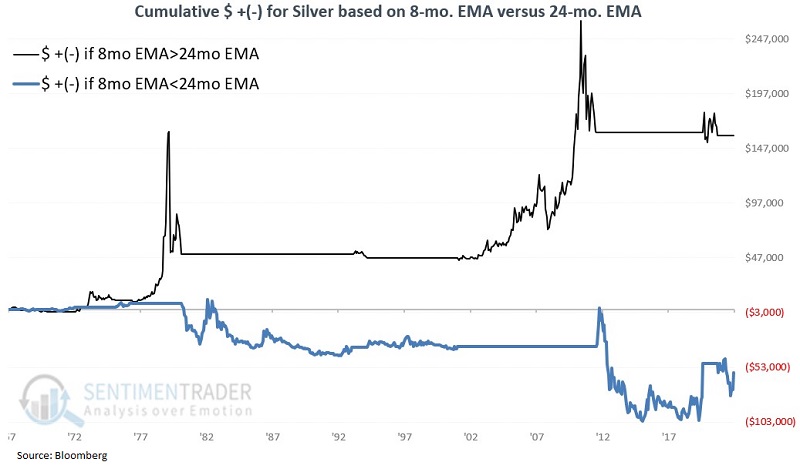
From December 1968 through November 2022, silver has returned $158,753 when the 8-month EMA > 24-month EMA and -$58,111 when the 8-month EMA < 24-month EMA.
At the moment, the 8-month EMA remains below the 24-month EMA. This is not surprising as silver is coming off of a long-term decline, and this is a lagging trend-following indicator. This one bears watching as a trend confirmation.
What the research tells us…
Silver is a market capable of making huge - and potentially highly profitable - moves for those on the right side of the major trend. The indicators detailed above are beginning to align on the favorable side of the ledger. Interested investors and traders should be making plans now to take advantage if silver embarks on a major wave up. These plans should include some intelligent thoughts regarding capital allocation and deciding which vehicle to use to trade. Choices include silver futures and ETFs that track the price of silver bullion like SLV.