
The S&P's v-shaped bottom

Key points:
- The S&P 500 has enjoyed a spectacular v-shaped bottom from a 50-day low
- This is one of the very few times in 100 years that investors behaved like this during bull markets
- Rapid recoveries have tended to precede more gains, with the caveat that we're in a highly unusual environment
A rapid shift in momentum
Well, this has been quite a ride, huh? From pure panic to the euphoria of all-time highs with just one more decent day, all in a couple of weeks. It's been a while since investors were this wishy-washy.
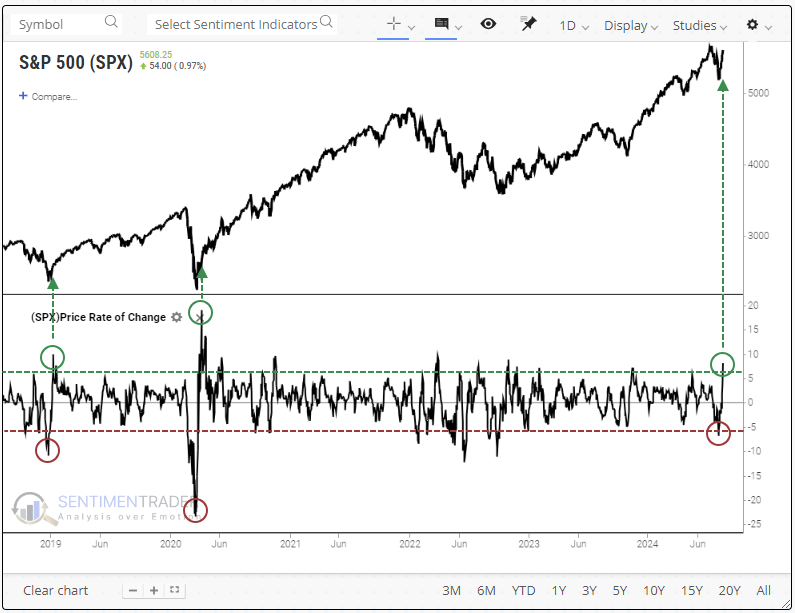
Just two weeks ago, the S&P 500 had dropped more than -6% over the prior two weeks and was sitting at a 50-day low. It took off after a few bumpy sessions and is within spitting distance of new highs, more than making up for its prior 10-day loss.
The last two times investors panicked to the downside and then upside, like this one, with the S&P hitting a 50-day low during the panic, it marked important bottoms.
The table below shows every time the S&P 500 suffered at least a -6% decline over ten days and reached a 50-day low, then enjoyed at least a +6% rally off that low. For lack of a better term, we'll call these v-shaped bottoms, though some may not necessarily look that way on a chart.
Its returns after these rebounds were scattered among some big losses and big gains, with little in between. The big gains tended to occur when these triggered at multi-year lows, while the big losses were mostly confined to multiple fake-outs in the 1930s and then again in 2001 and 2008.
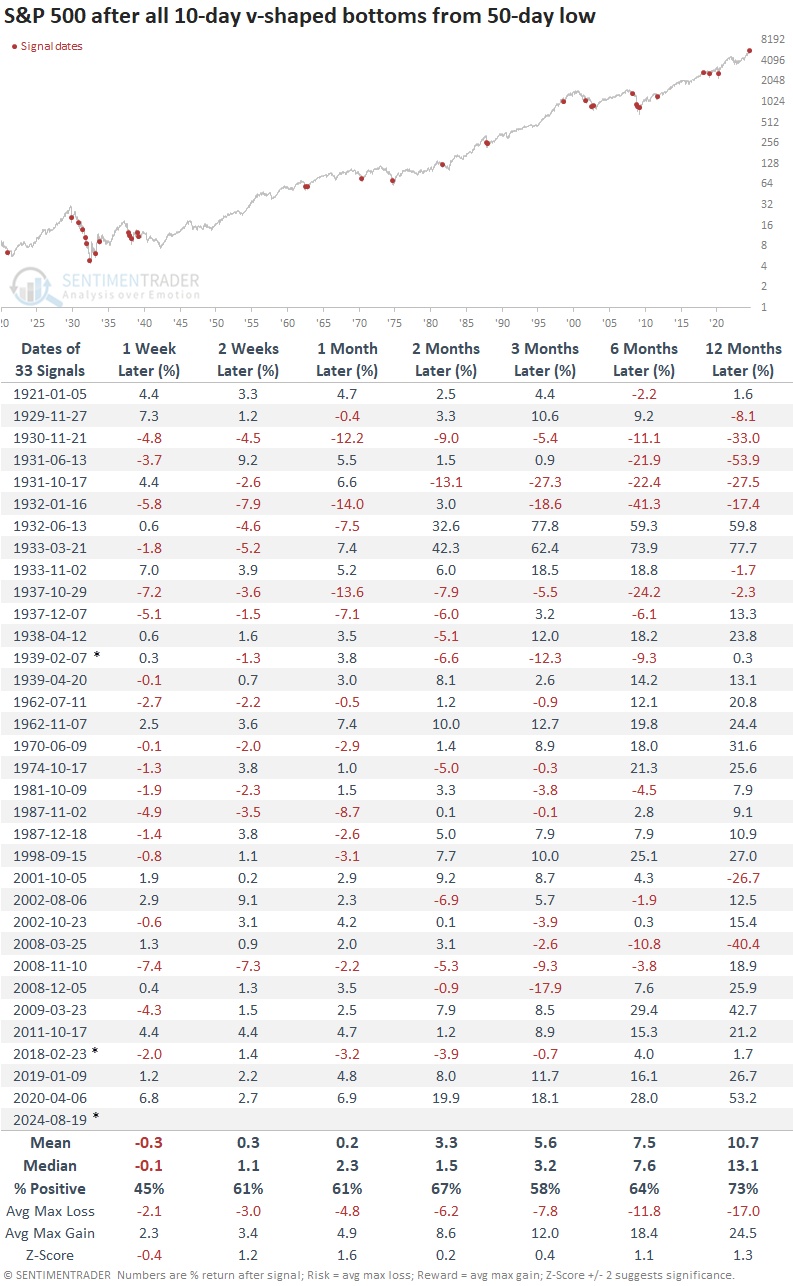
The asterisks in the table (in February 1939 and February 2018) denote the only times when these happened while the S&P 500 was either above its 200-day moving average or was within 10% of its prior multi-year high. Only 2 out of 33 signals were triggered during ongoing bull markets, so it's safe to say we're seeing an unusual situation now. It's worth noting that both of those signals - despite occurring during bull markets - saw the S&P trade lower by at least -3.9% over the next two months.
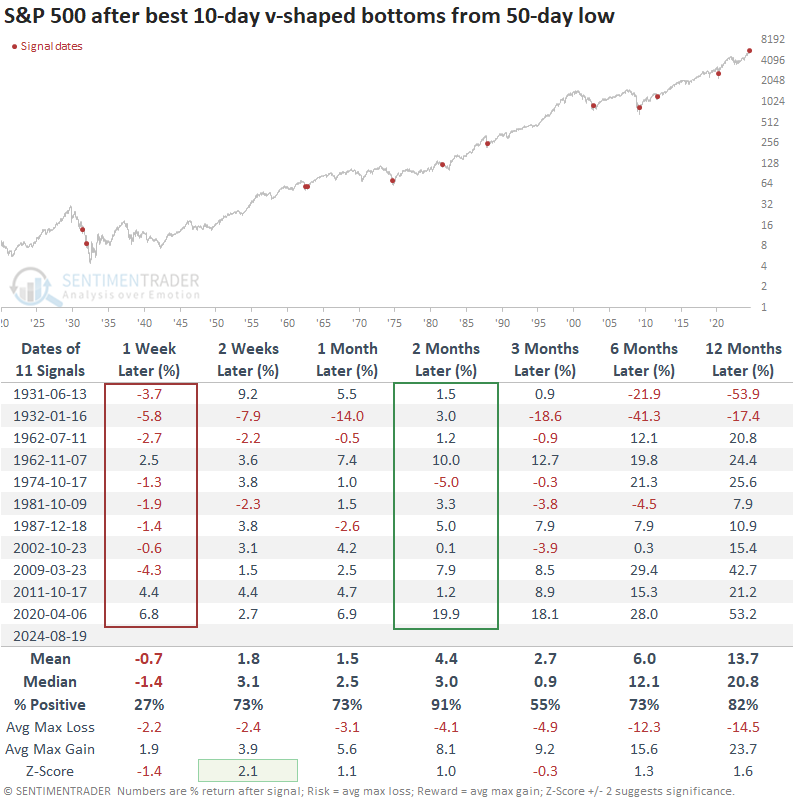
One wrinkle with our current rally is that the 10-day gain has exceeded the 10-day loss immediately preceding the 50-day low. That was the case in only a third of the precedents, and after these, the S&P tended to sport very short-term weakness (except for the last two signals) but consistent gains over the next two months, with only one loss, which was quickly reversed.
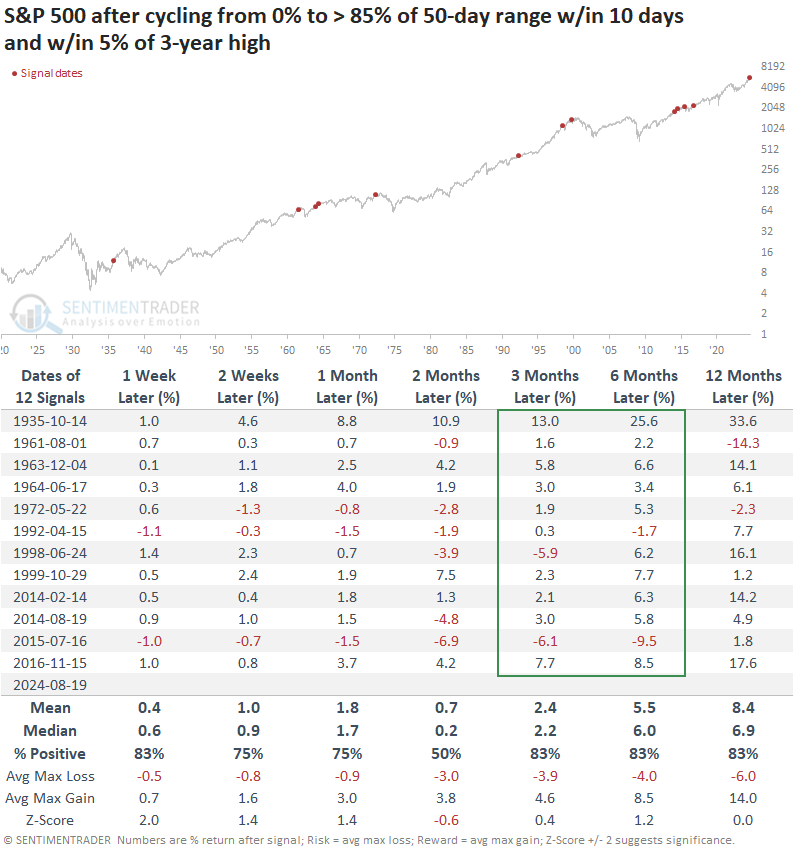
Taking a modestly different tack, the table below shows every time when the S&P 500 cycled from a 50-day low to within 15% of its 50-day high in two weeks or less.
After these cycles, the S&P did quite well over the next 3-6 months, with only two losses that were subsequently reversed in the months afterward. Its returns were nothing special, nor was the risk/reward ratio, but what stands out is the lack of significant losses up to six months later. Only three of the twelve signals witnessed more than a -4% drawdown at any point within the next six months.
What the research tells us...
Stocks are already overbought on some measures, and sentiment is quickly recovering from the brief freak-out a couple of weeks ago. The run has been astounding, but past performance after impressive v-shaped bottoms suggests that there should be more gains in store over the next couple of months.
The biggest caveat is that it has been exceptionally unusual to see this type of move during uptrends, and the only other times it happened, gains were capped in the weeks and months ahead. An objective look at what is inherently emotional trading behavior suggests that we should be modestly confident that this rapid shift in momentum should carry stocks even higher. However, since it's occurring so near record highs, we shouldn't be overly confident that we can rely on the types of gains after more protracted declines.