
The Split Between "Smart Money" and Retail Investors

Key Points:
- XLK in critical narrow consolidation before Super Tech Earnings Week.
- Rydex/seasonal bullish, smart money bearish.
- Insiders selling; options P/C Ratio hovering at one-year low.
- Breadth/fund flows show deteriorating structure, signal bearish divergence.
Greed vs. Fear in the AI Wave
Earlier this year, the tech sector (XLK) outperformed the broader market, fueled by the "AI monetization year". But as the "Super Tech Earnings Week" (featuring Microsoft, Google, etc.) draws near, the market has stalled under pressure from "high-valuation fears".
This consolidation reflects the market's wait for a directional cue. Both bulls and bears have their arguments, but a deep dive into the data uncovers a potential "bearish divergence".
How Retail Investors and Seasonality Drive Bullish Sentiment
While we always urge caution on seasonal factors, they're undeniably propping up bullish confidence to some extent.
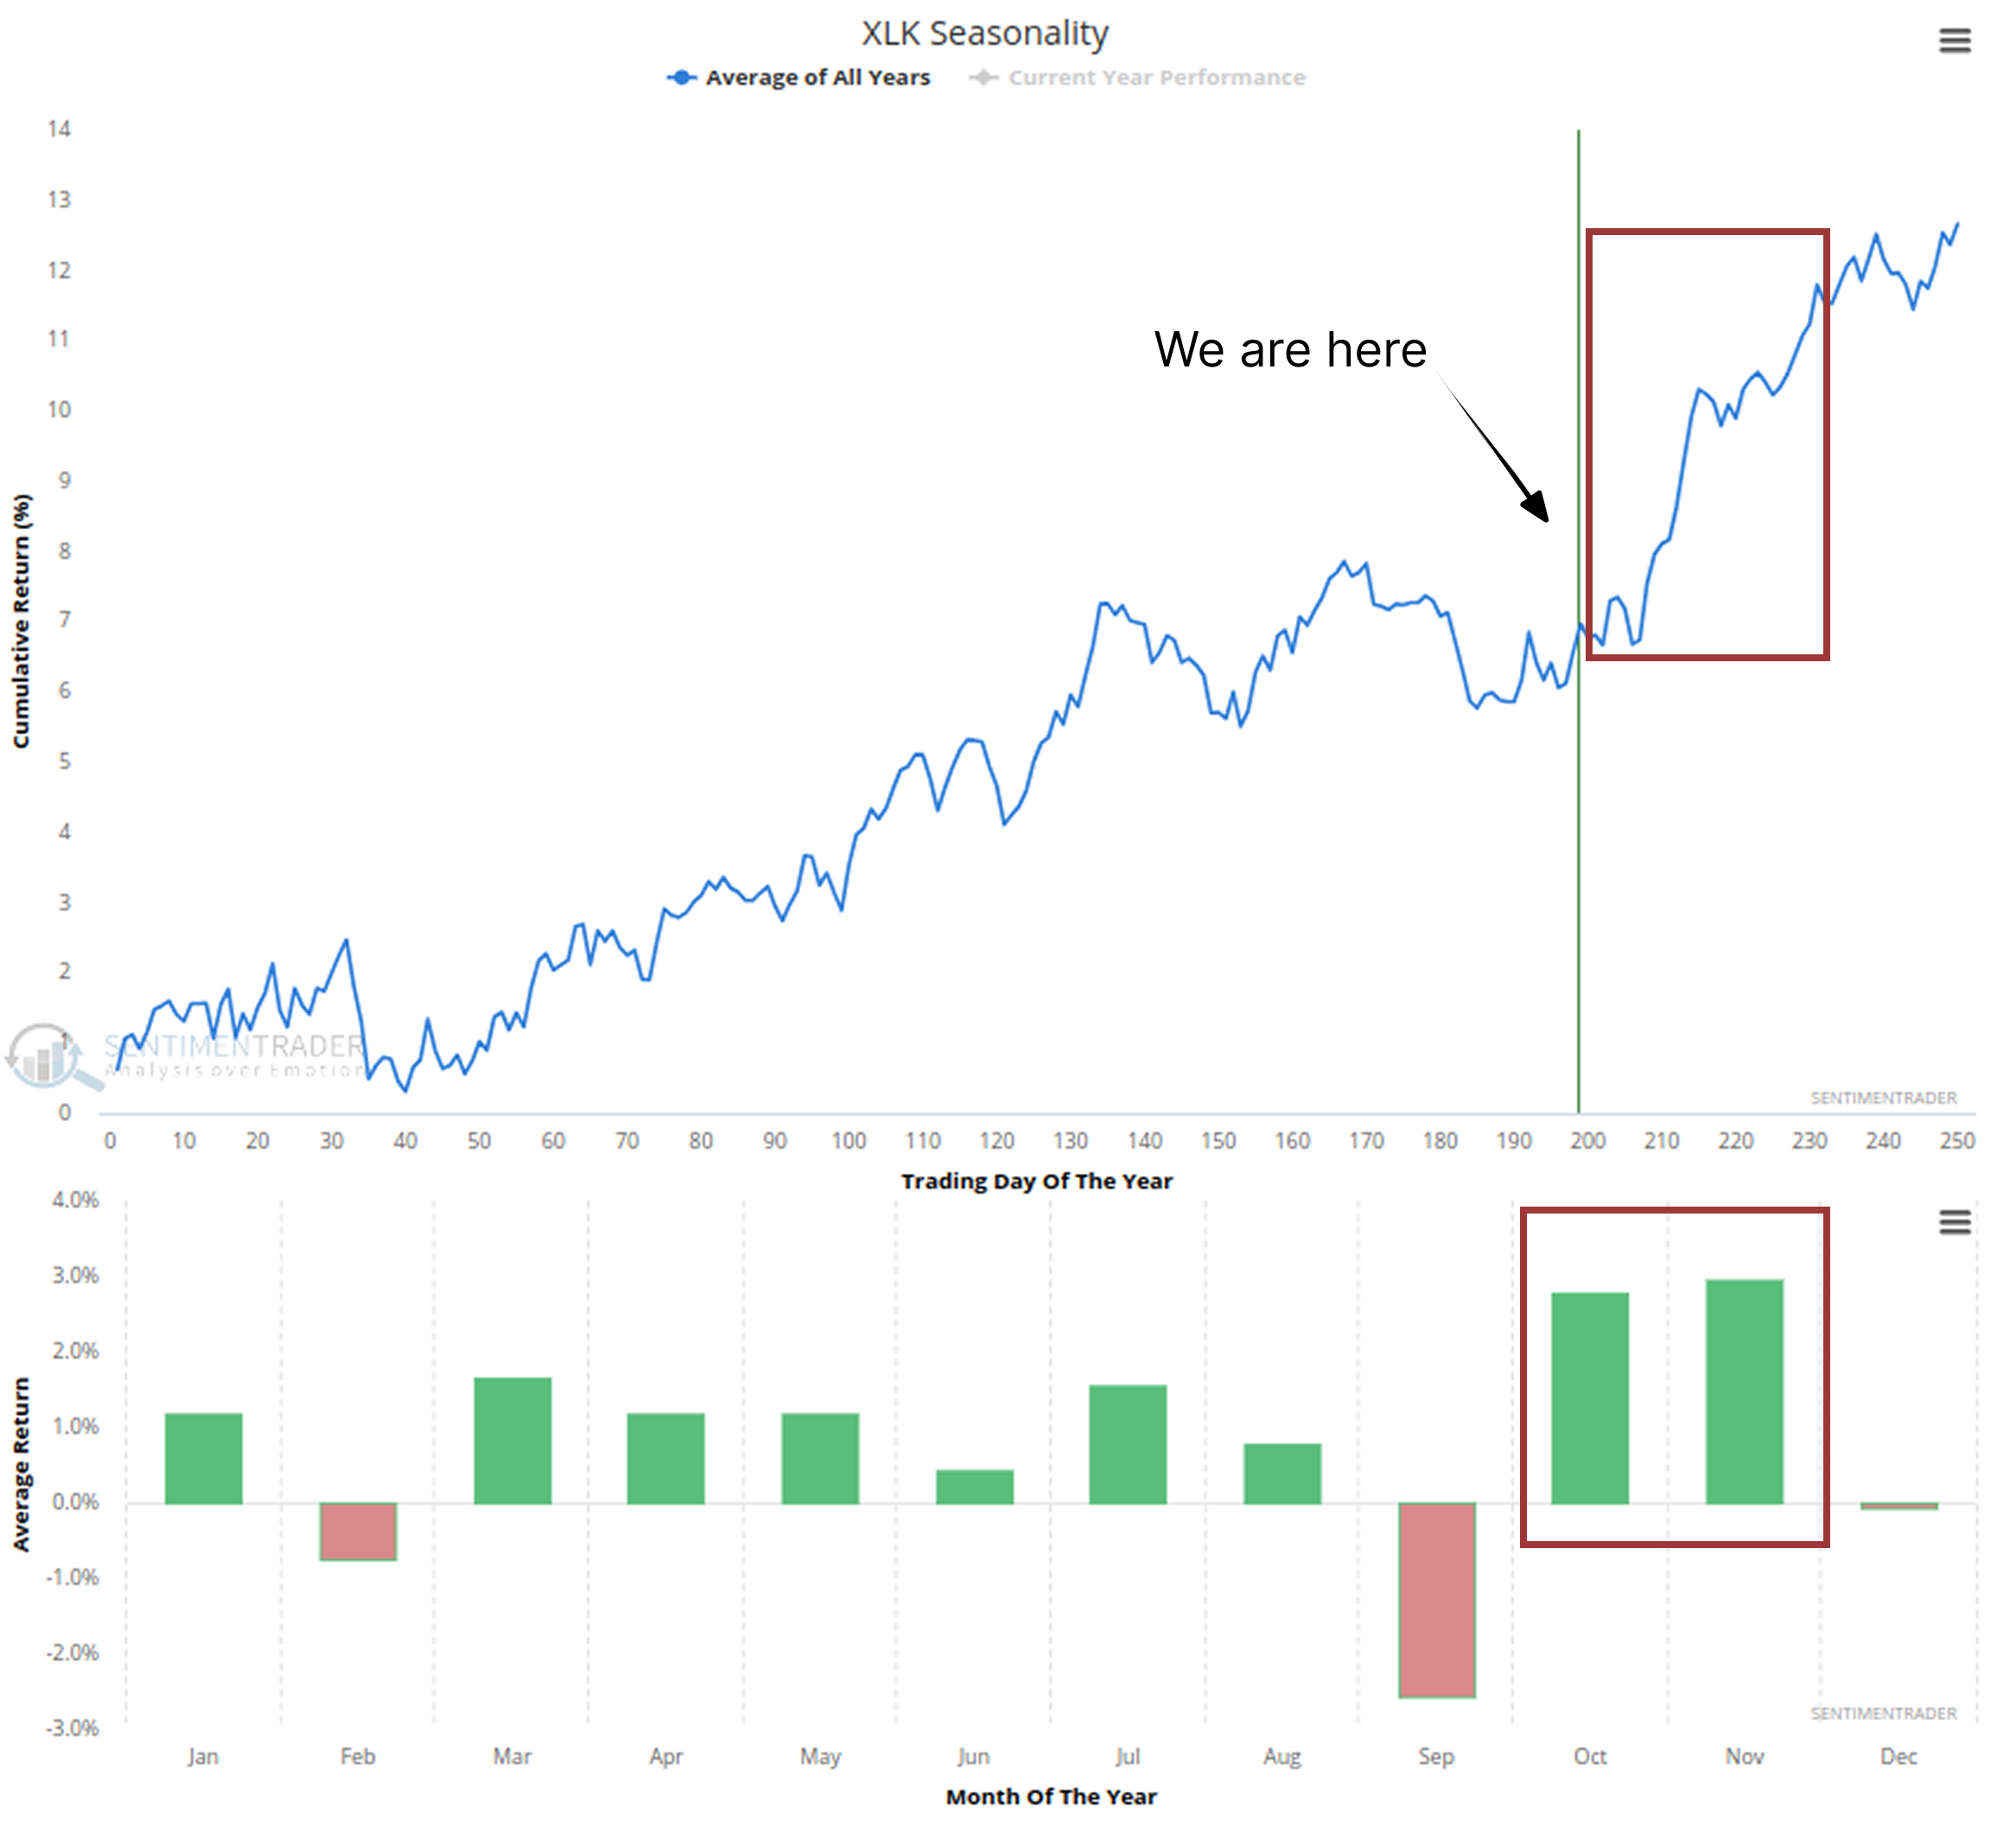
As the chart shows, the 2025 trend (red line)-driven by the AI wave-has broken the "slow rally" pattern of the historical average (blue line). Coincidentally, the historical average (blue line) indicates October and November are typically the sector's strongest "traditional peak season" of the year.
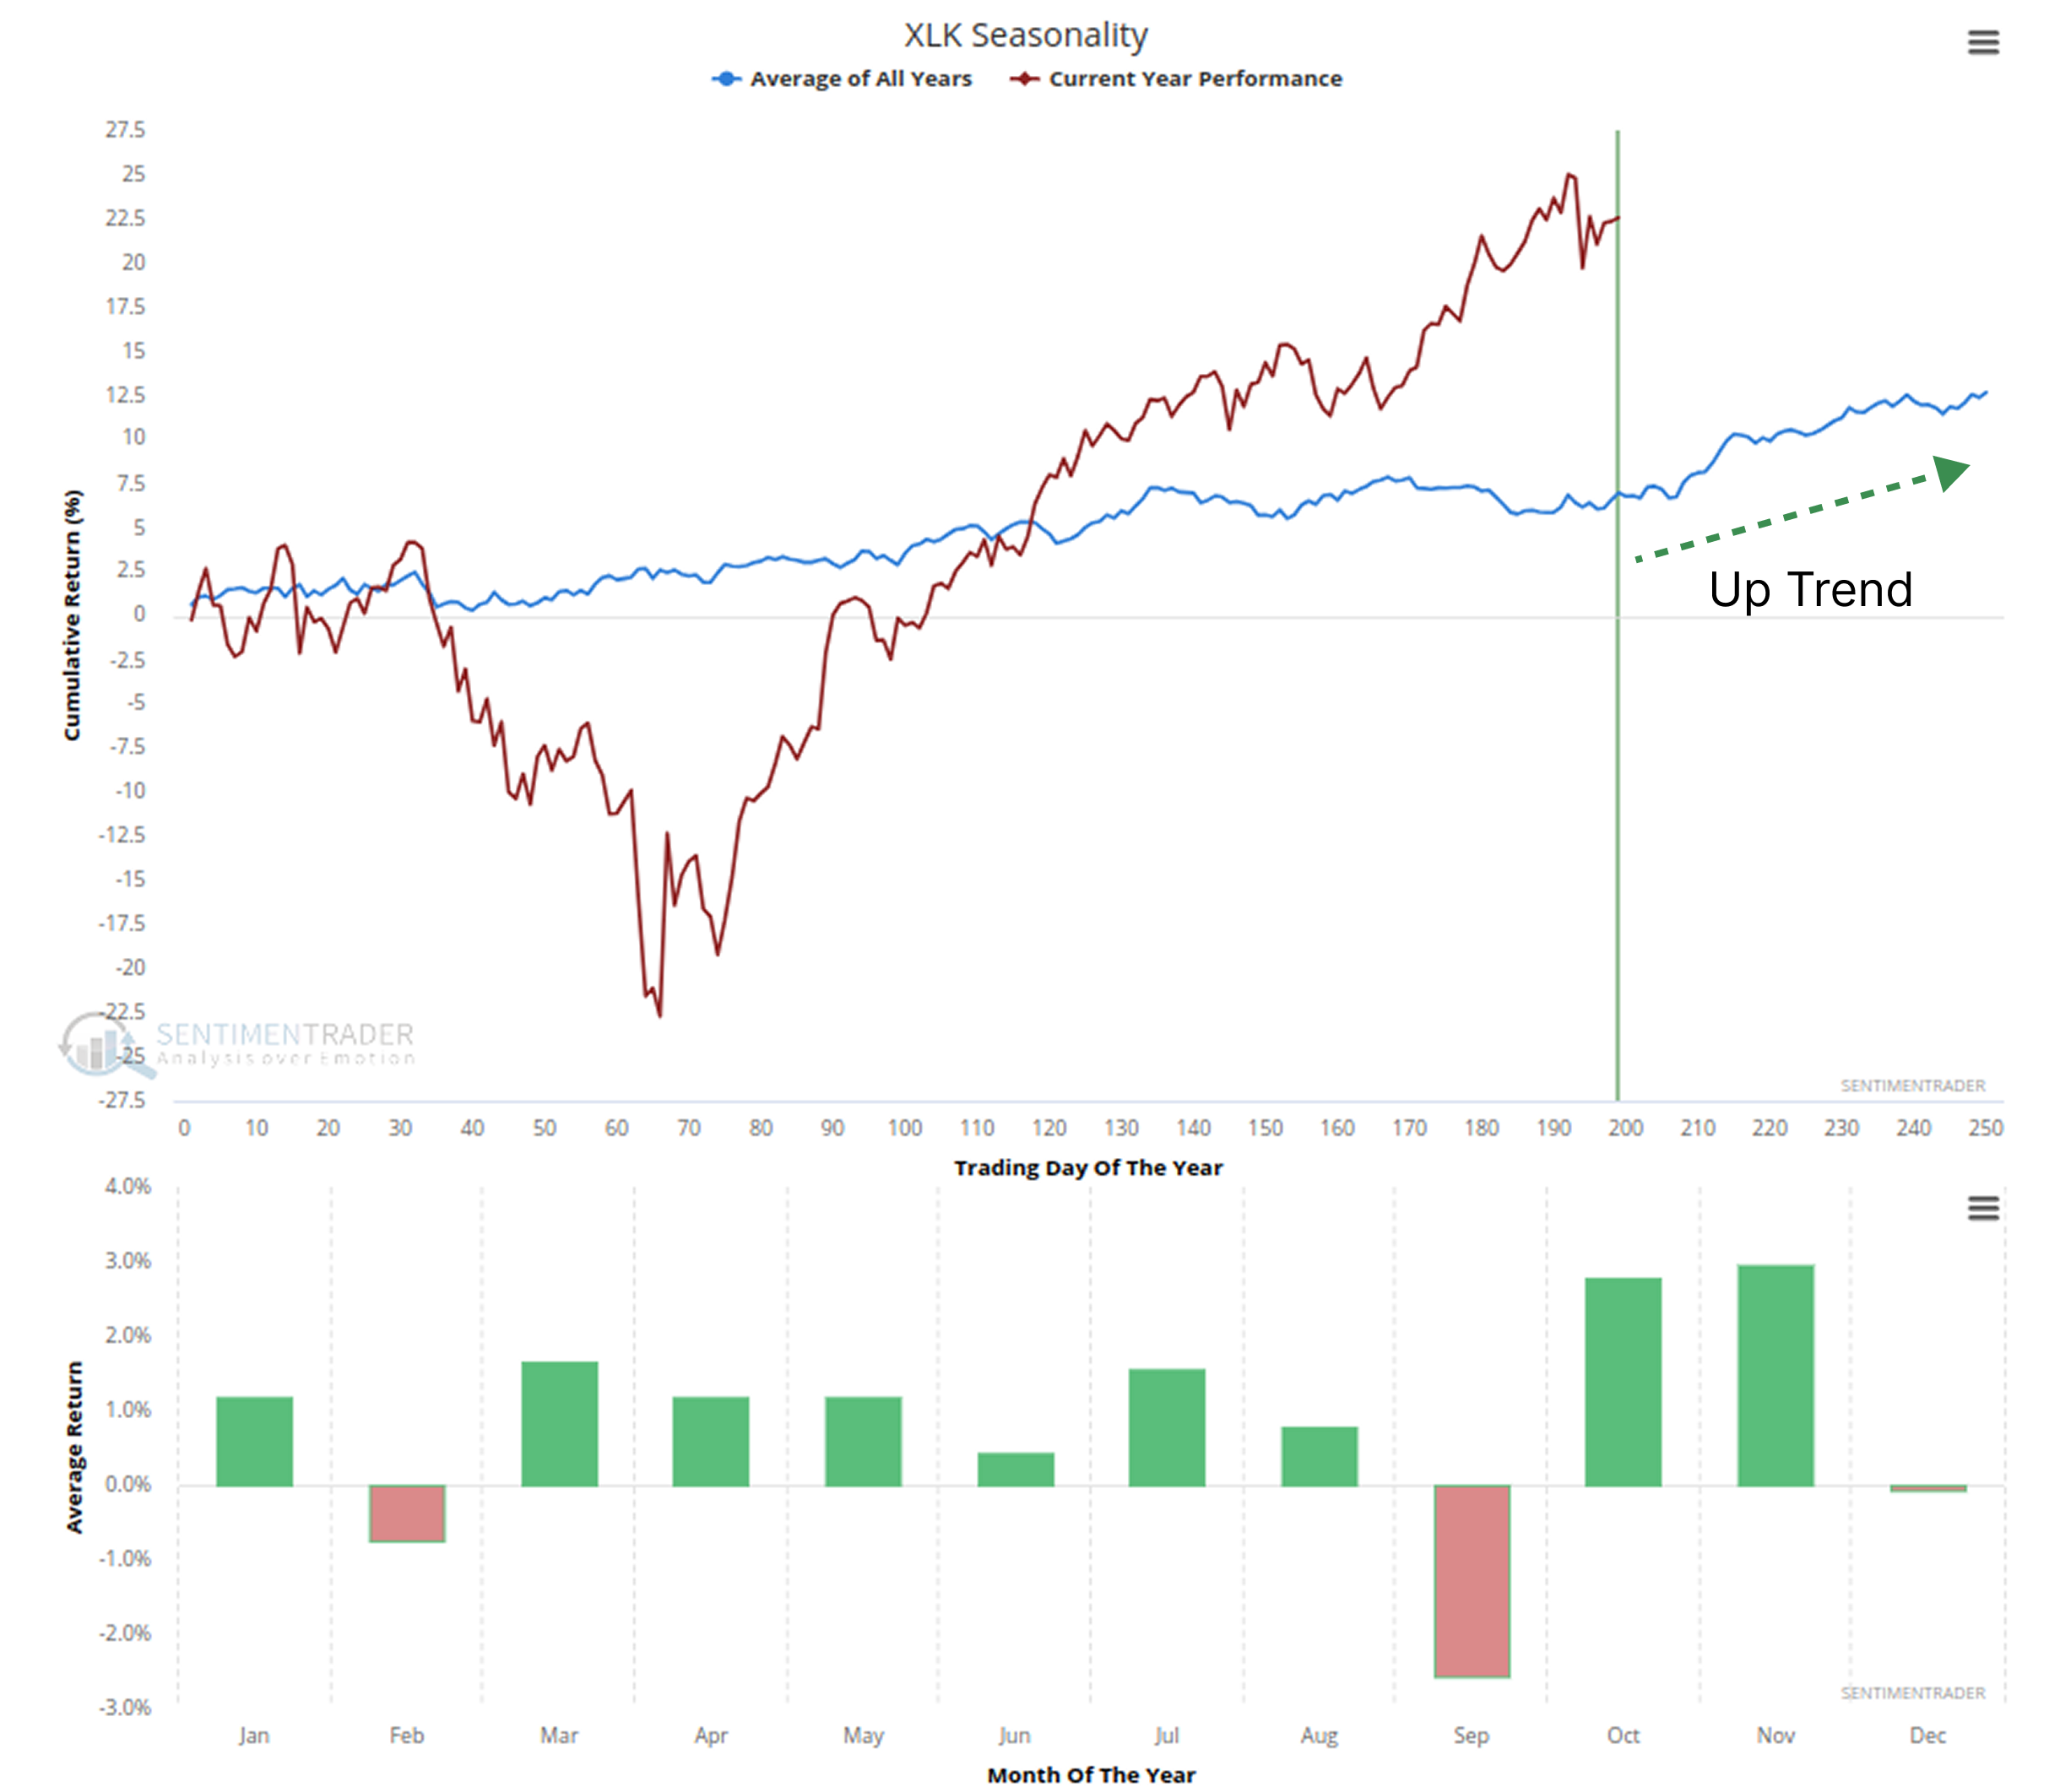
This combination of the "AI narrative" and "year-end peak season" gives bulls reason to bet on tech's future growth.
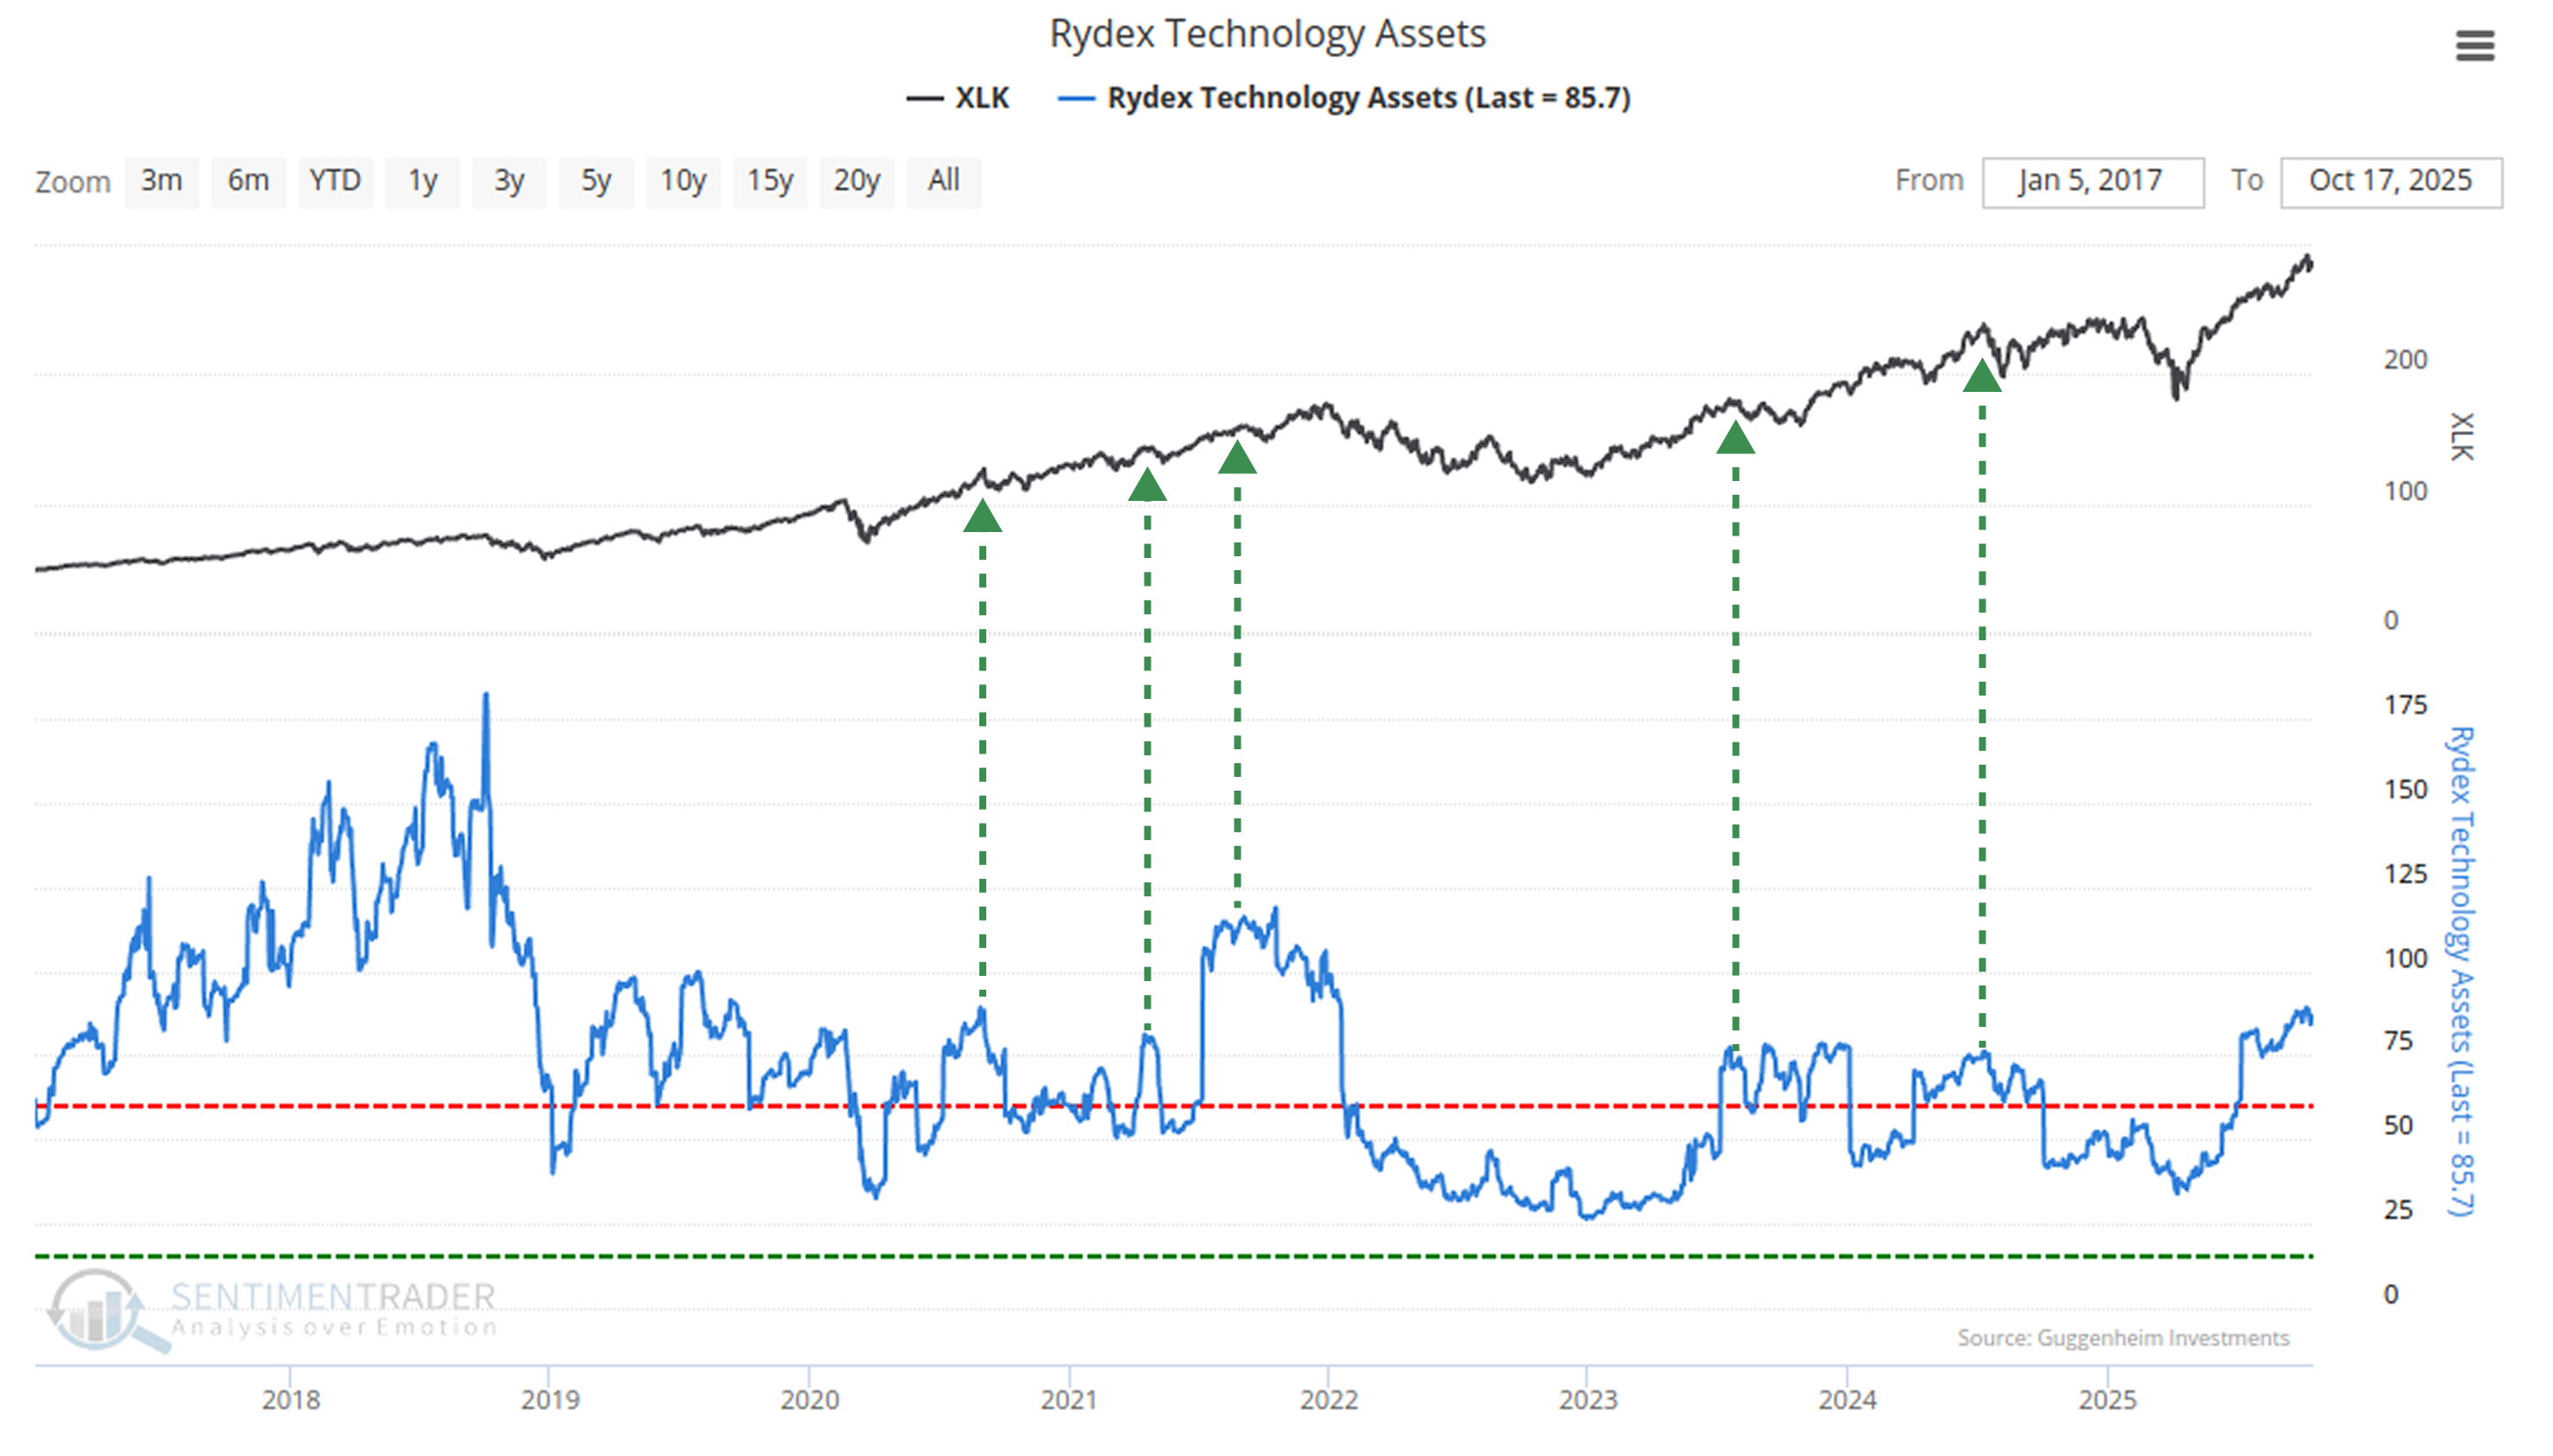
Retail (speculative) sentiment confirms this confidence. Rydex Technology Assets have stayed at a relatively high level over the past year. Retail funds haven't fled amid "high-valuation fears"-instead, they're still "all-in".
Technical and Internal Red Flags
In contrast to retail optimism, however, "smart money" is sounding the alarm.
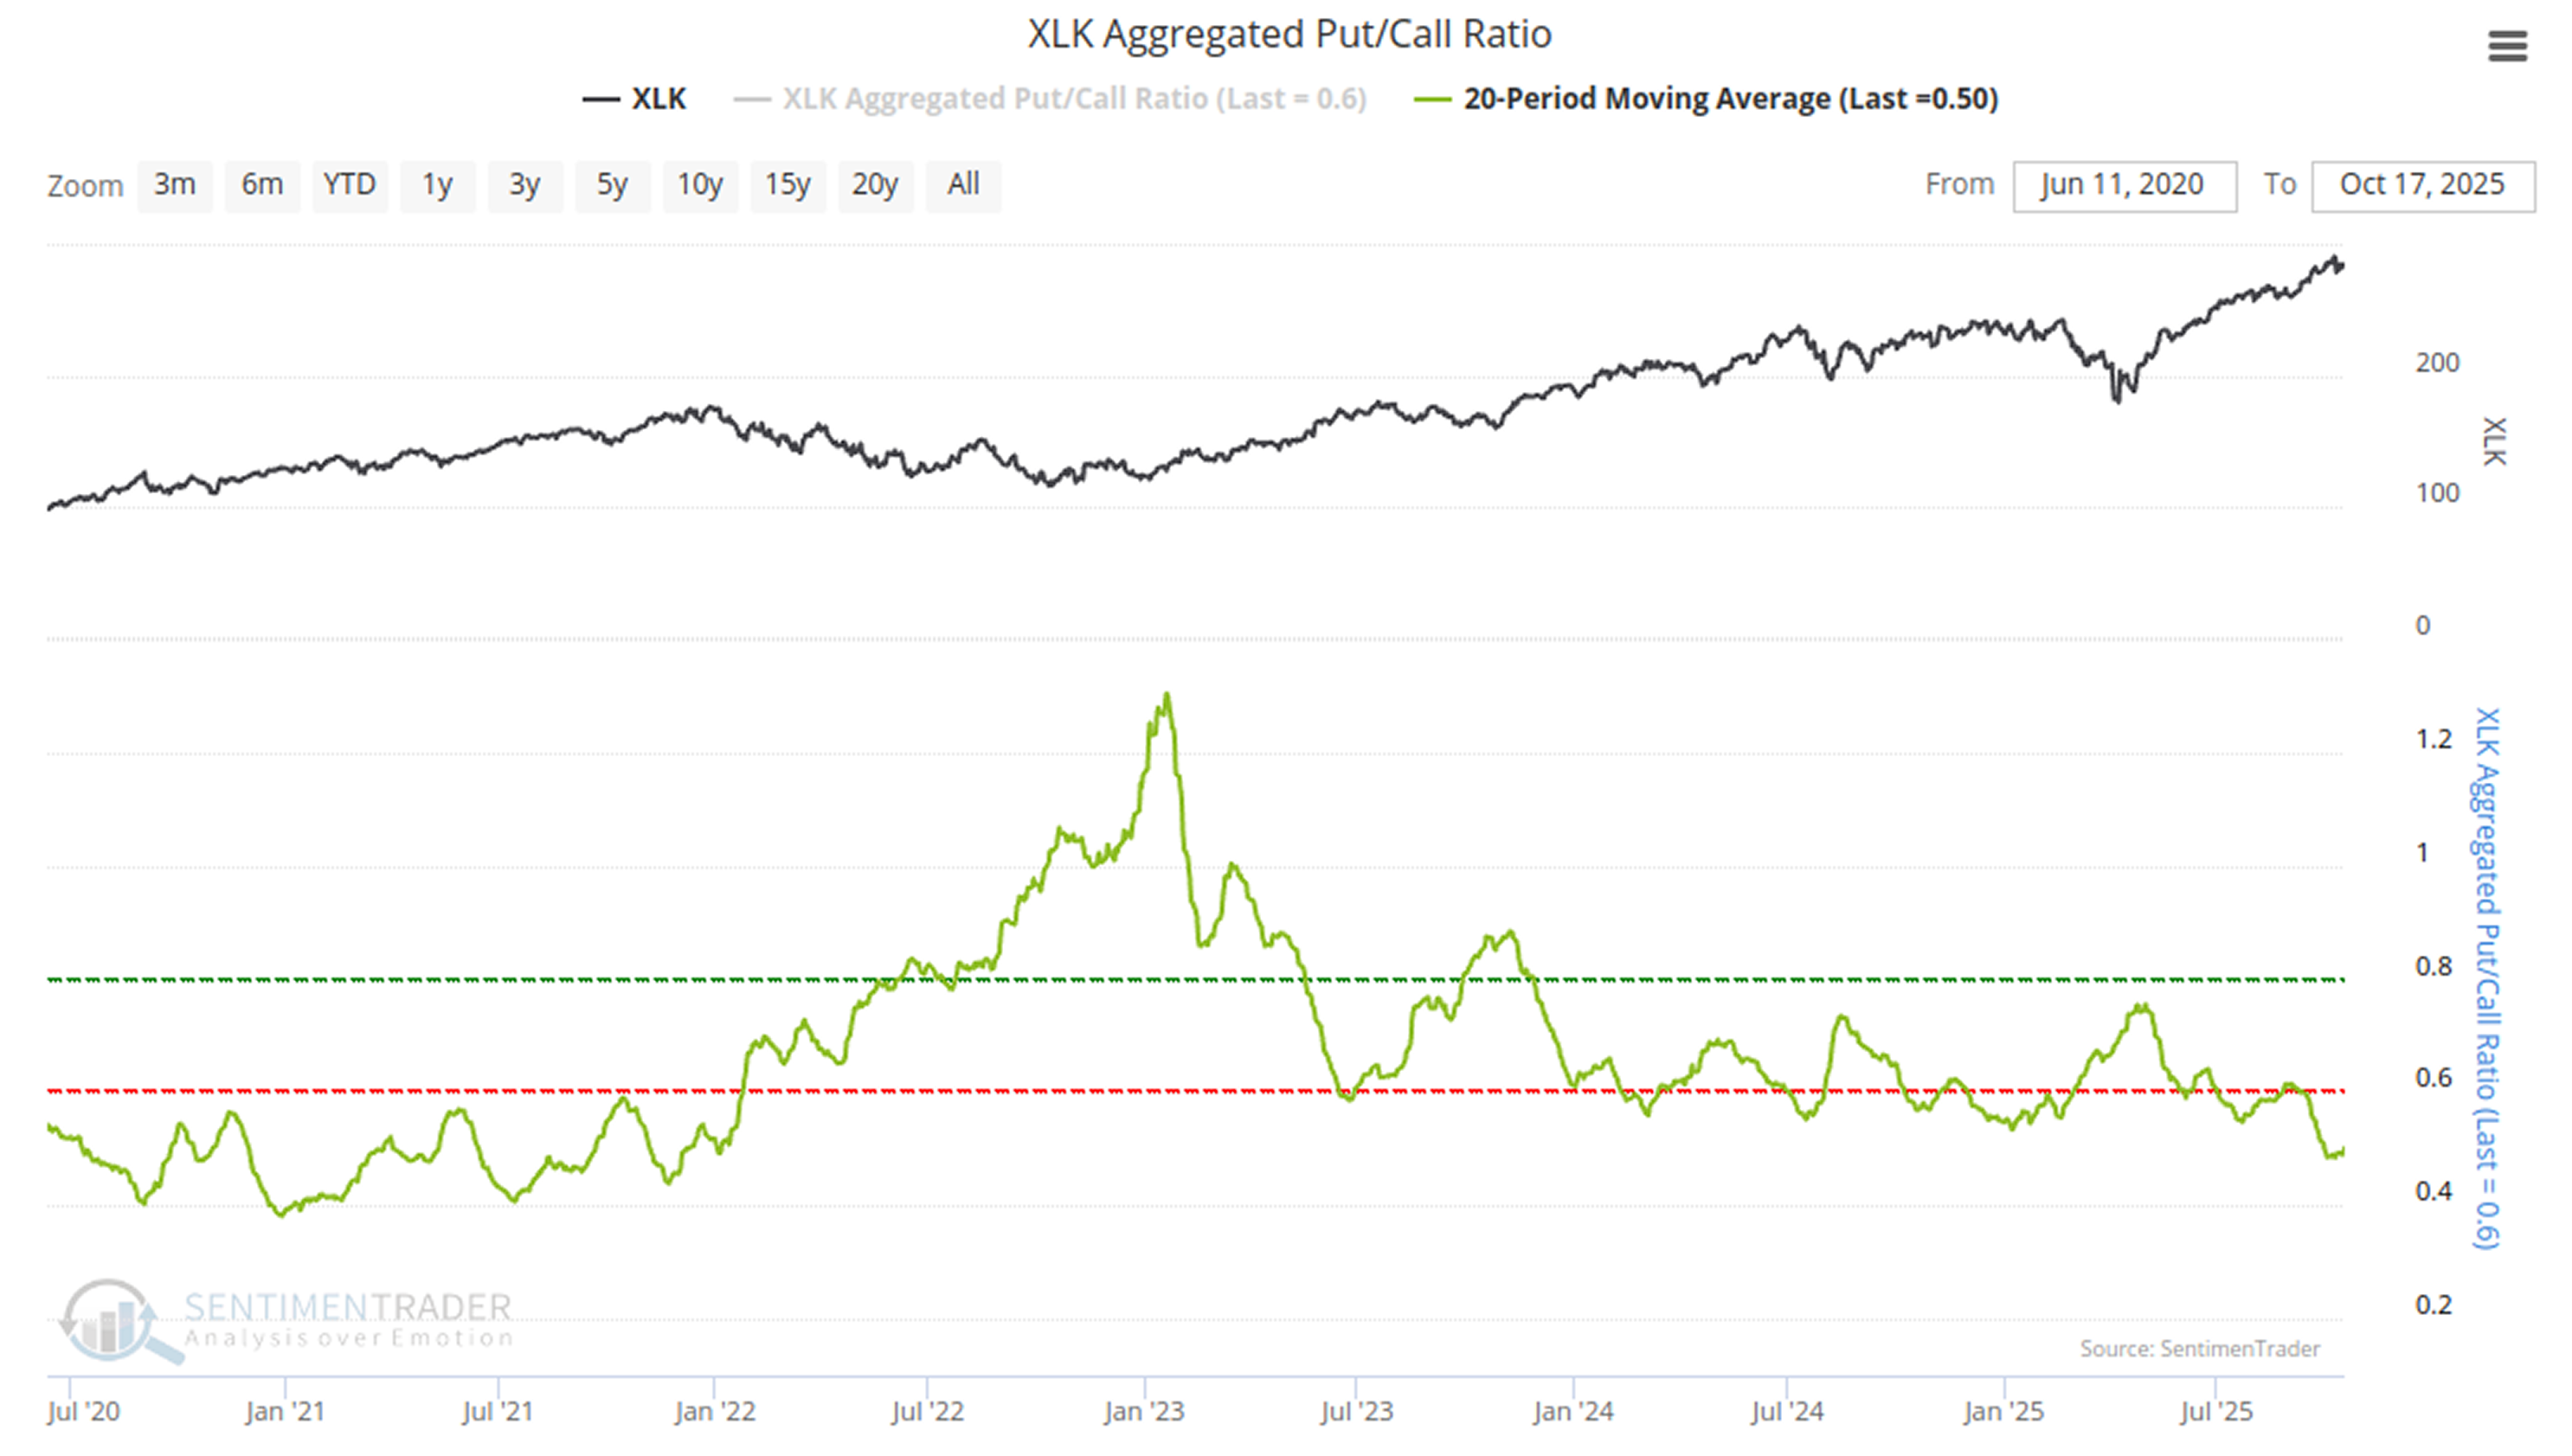
First, the options market: The 20-day moving average of the sector's Put/Call Ratio-smoothed to reduce volatility-has lingered at a one-year low for two weeks in October. This signals extreme market complacency, with investors far more willing to bet on upside (buying call options) than hedge downside risks (buying put options). Such excessive optimism (i.e., a low P/C Ratio) is typically a contrarian indicator, linked to market complacency and muted future returns.
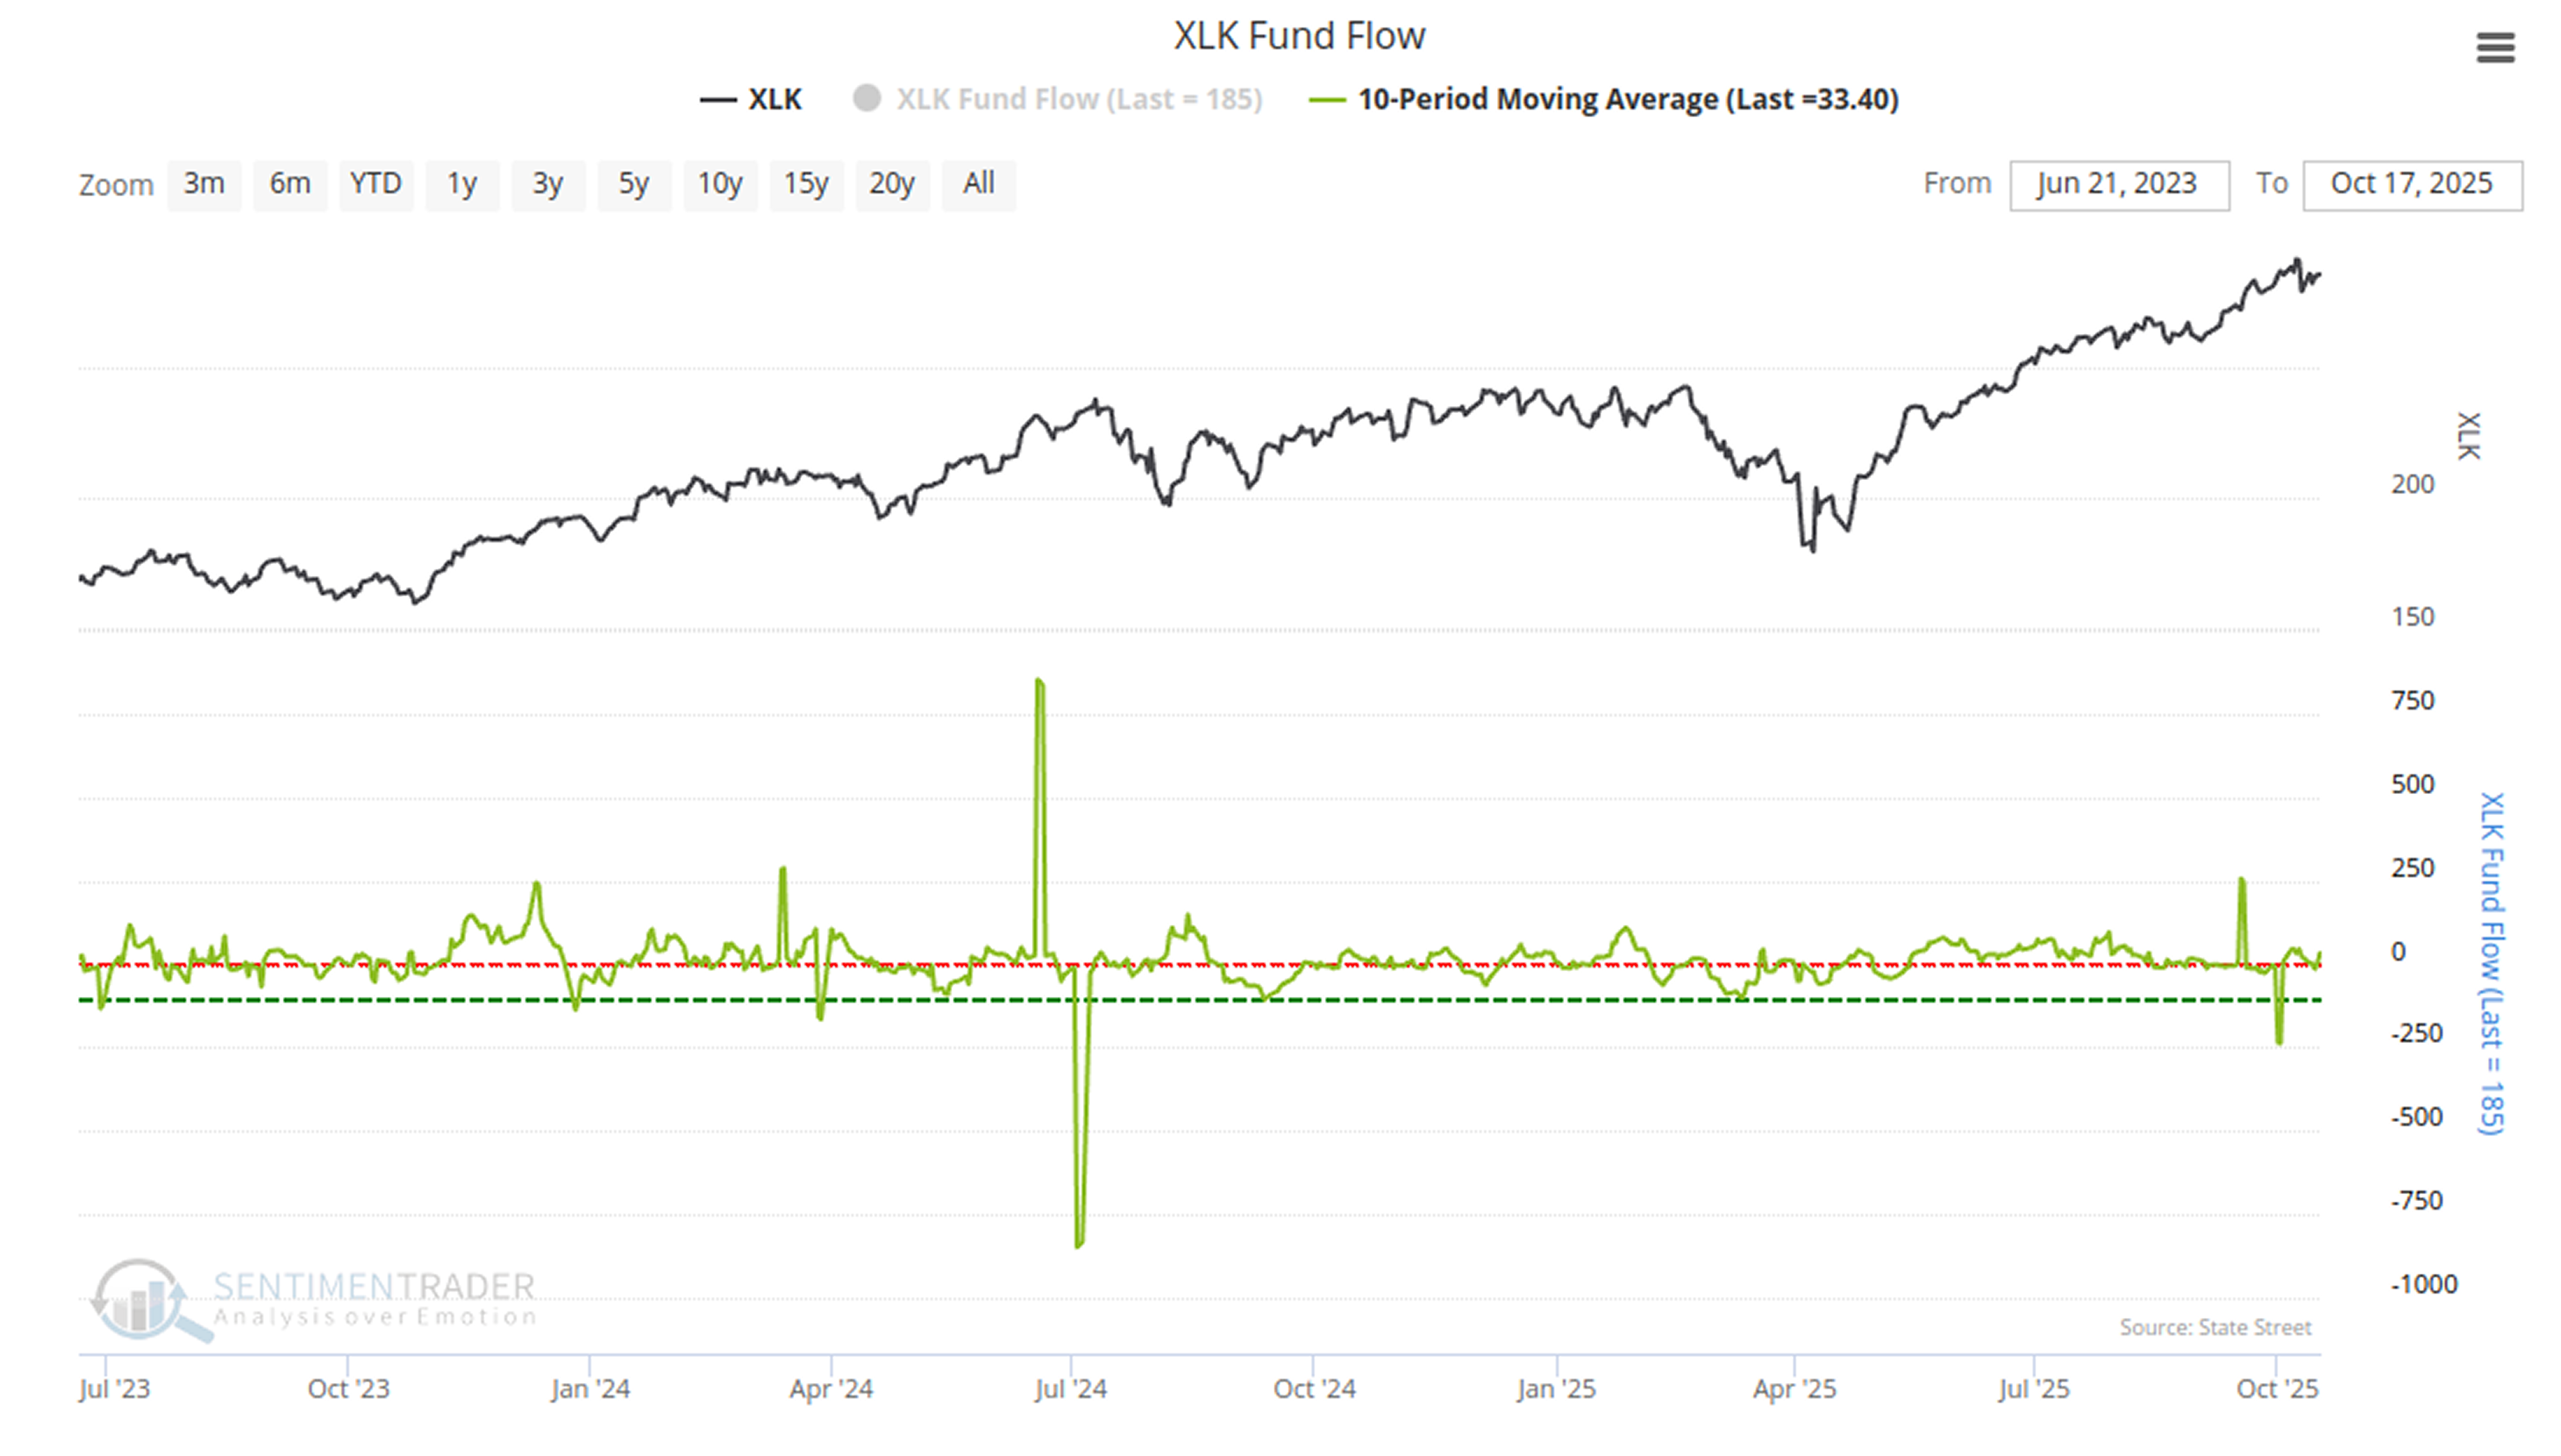
Second, fund flows haven't confirmed the price rally.
The data here shows a split: On one hand, Rydex Technology Assets (a proxy for speculative retail) remain elevated, indicating this group is still "all-in".
On the other hand, while XLK's price (black line) consolidates at highs in October, the 10-period moving average of broader sector fund flows (green line) has turned negative since the month began. The "fuel" (capital inflows) driving the rally has dried up. This suggests that while speculators hold on, other investor groups (likely institutions) have stopped chasing gains ahead of earnings.
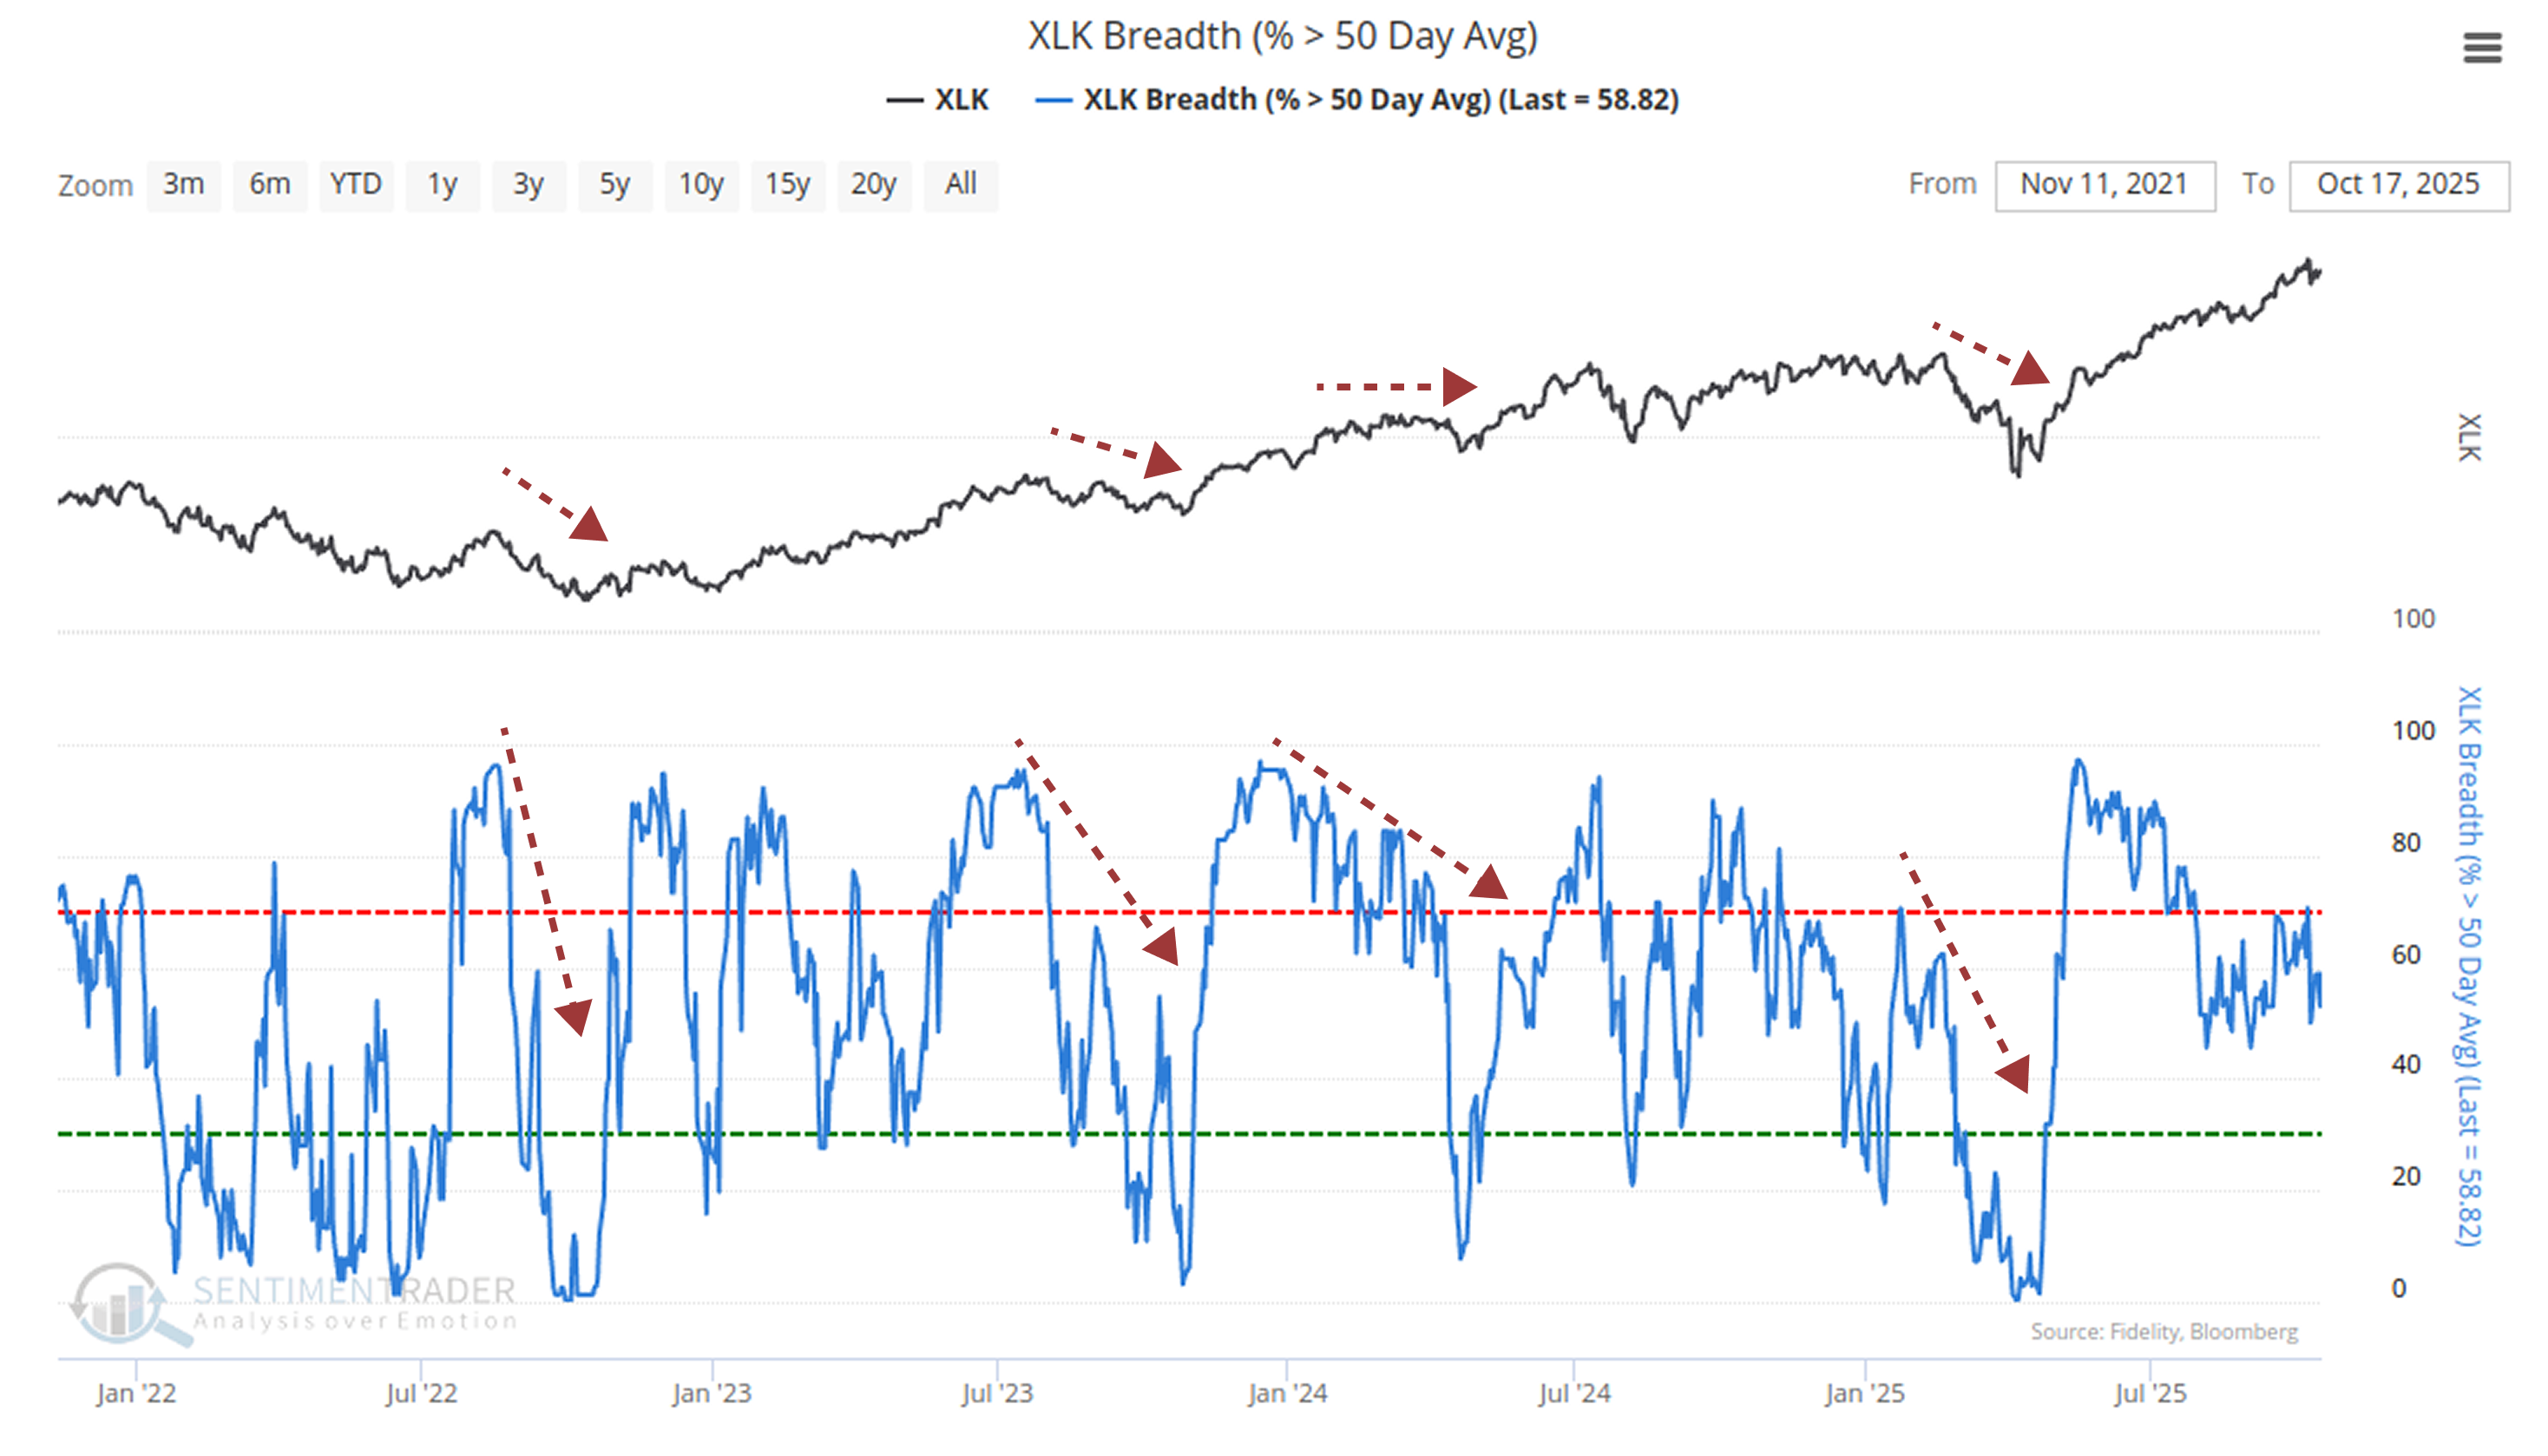
A more notable issue lies in the market's internal "breadth".
Breadth indicators shed light on what's happening: While long-term (>200-day) breadth-a lagging indicator-holds up, medium-term (>50-day) breadth has pulled back sharply from its highs.
This confirms the "bearish divergence" story: The XLK index (supported by a handful of giants) stays in high consolidation, but most stocks in the sector have started "rolling over". The market's medium-term structure is gradually unraveling.
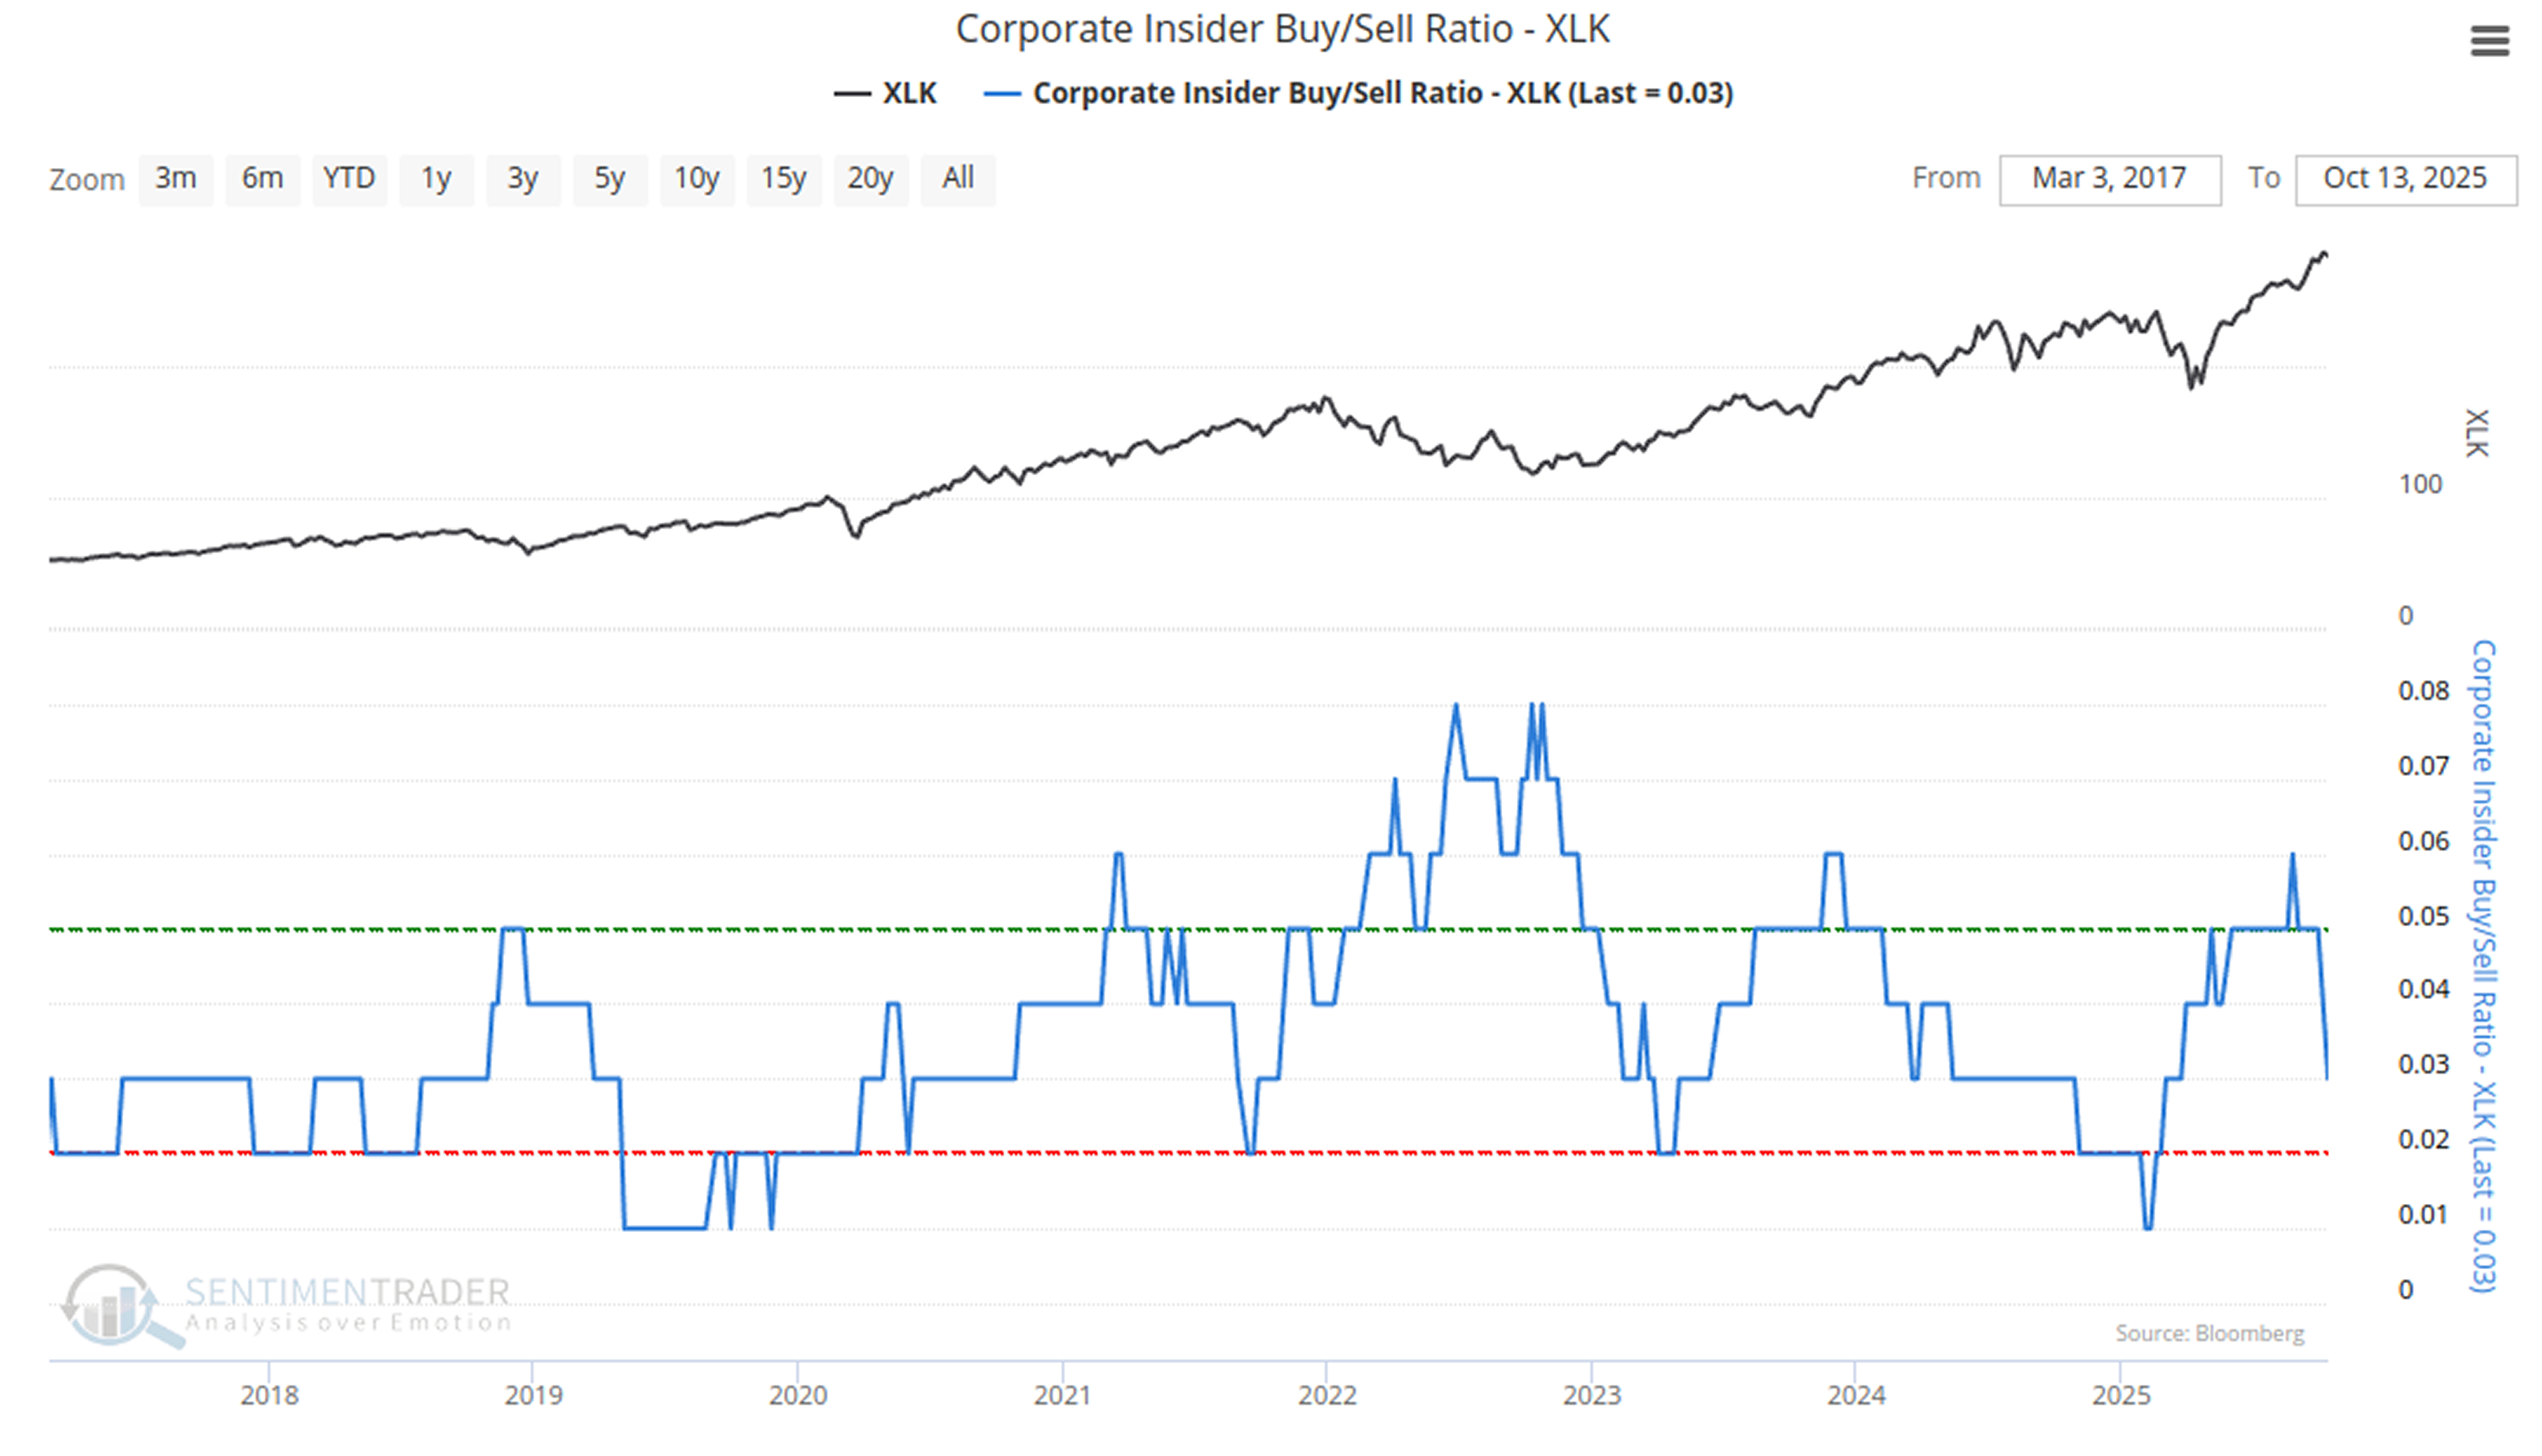
Finally, and most critically, company insiders are bailing out.
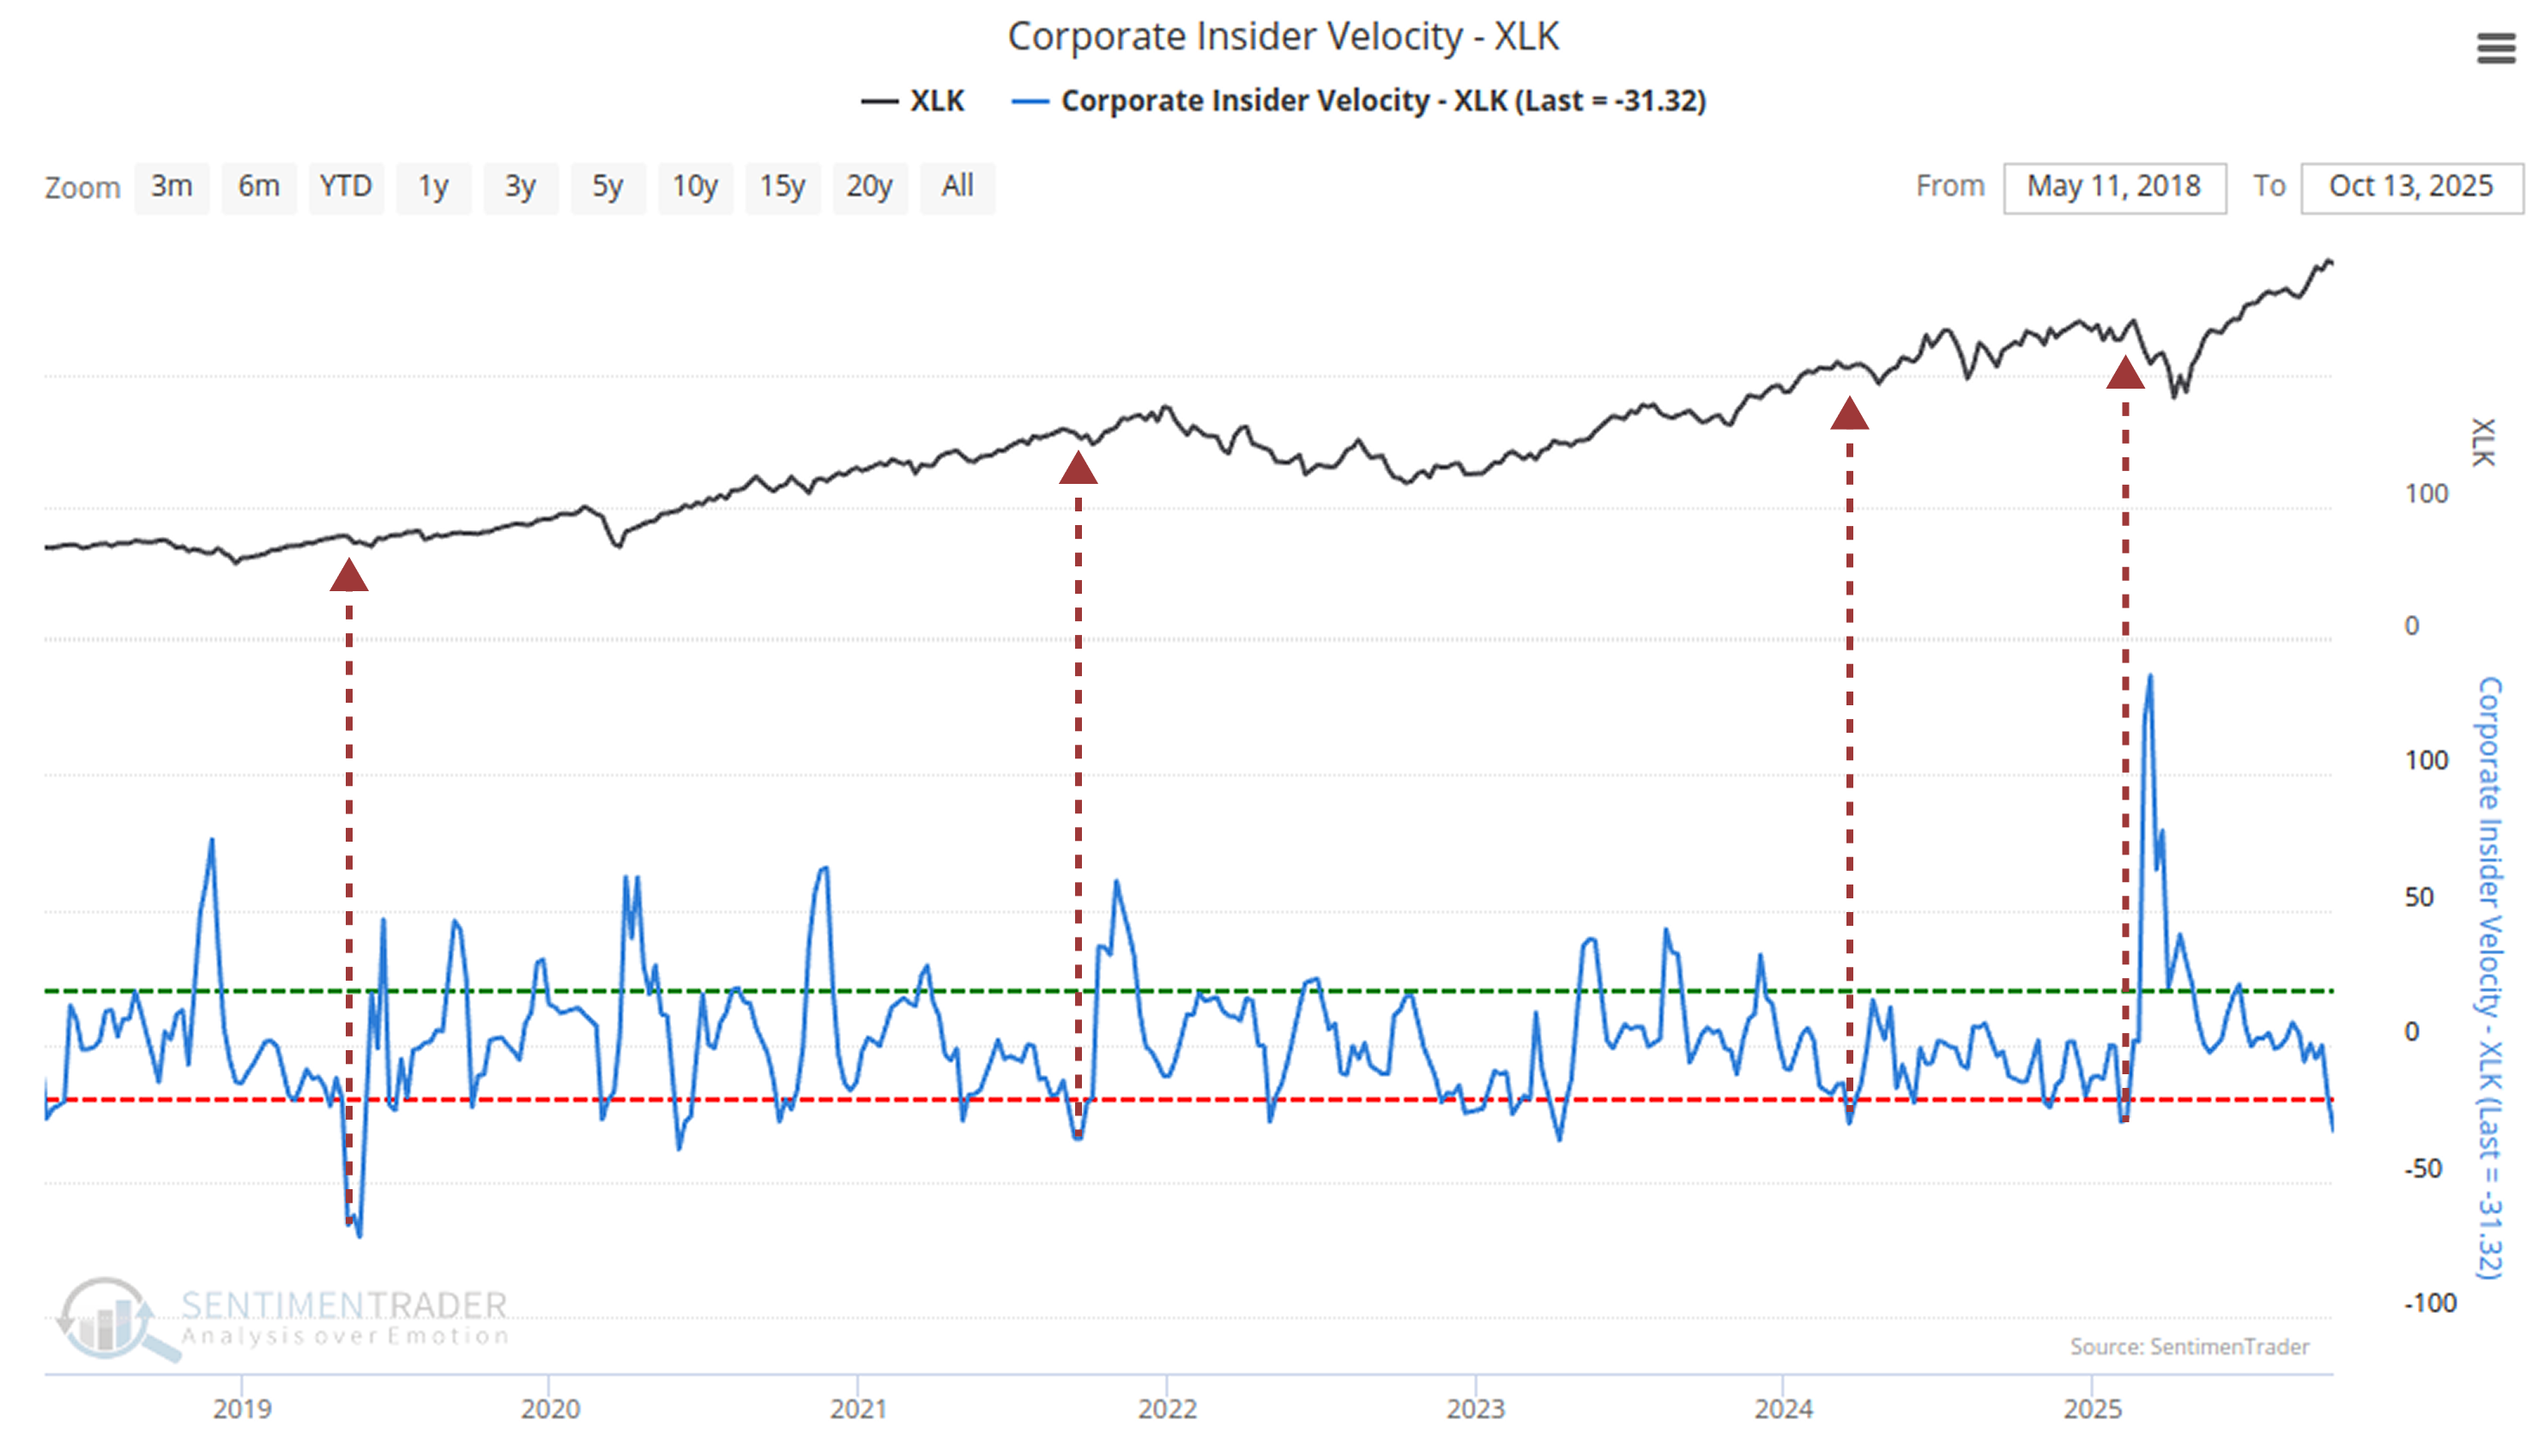
The Insider Buy/Sell Ratio has recently dropped, while selling velocity has moved deeper into negative territory.
The "smartest" of the "smart money"-CEOs and CFOs-are accelerating share sales ahead of earnings (before the quiet period), with selling intent outpacing buying. This behavior undermines both the "AI narrative" (at current valuations) and the reliability of the "seasonal peak season". It's a clear bearish signal.
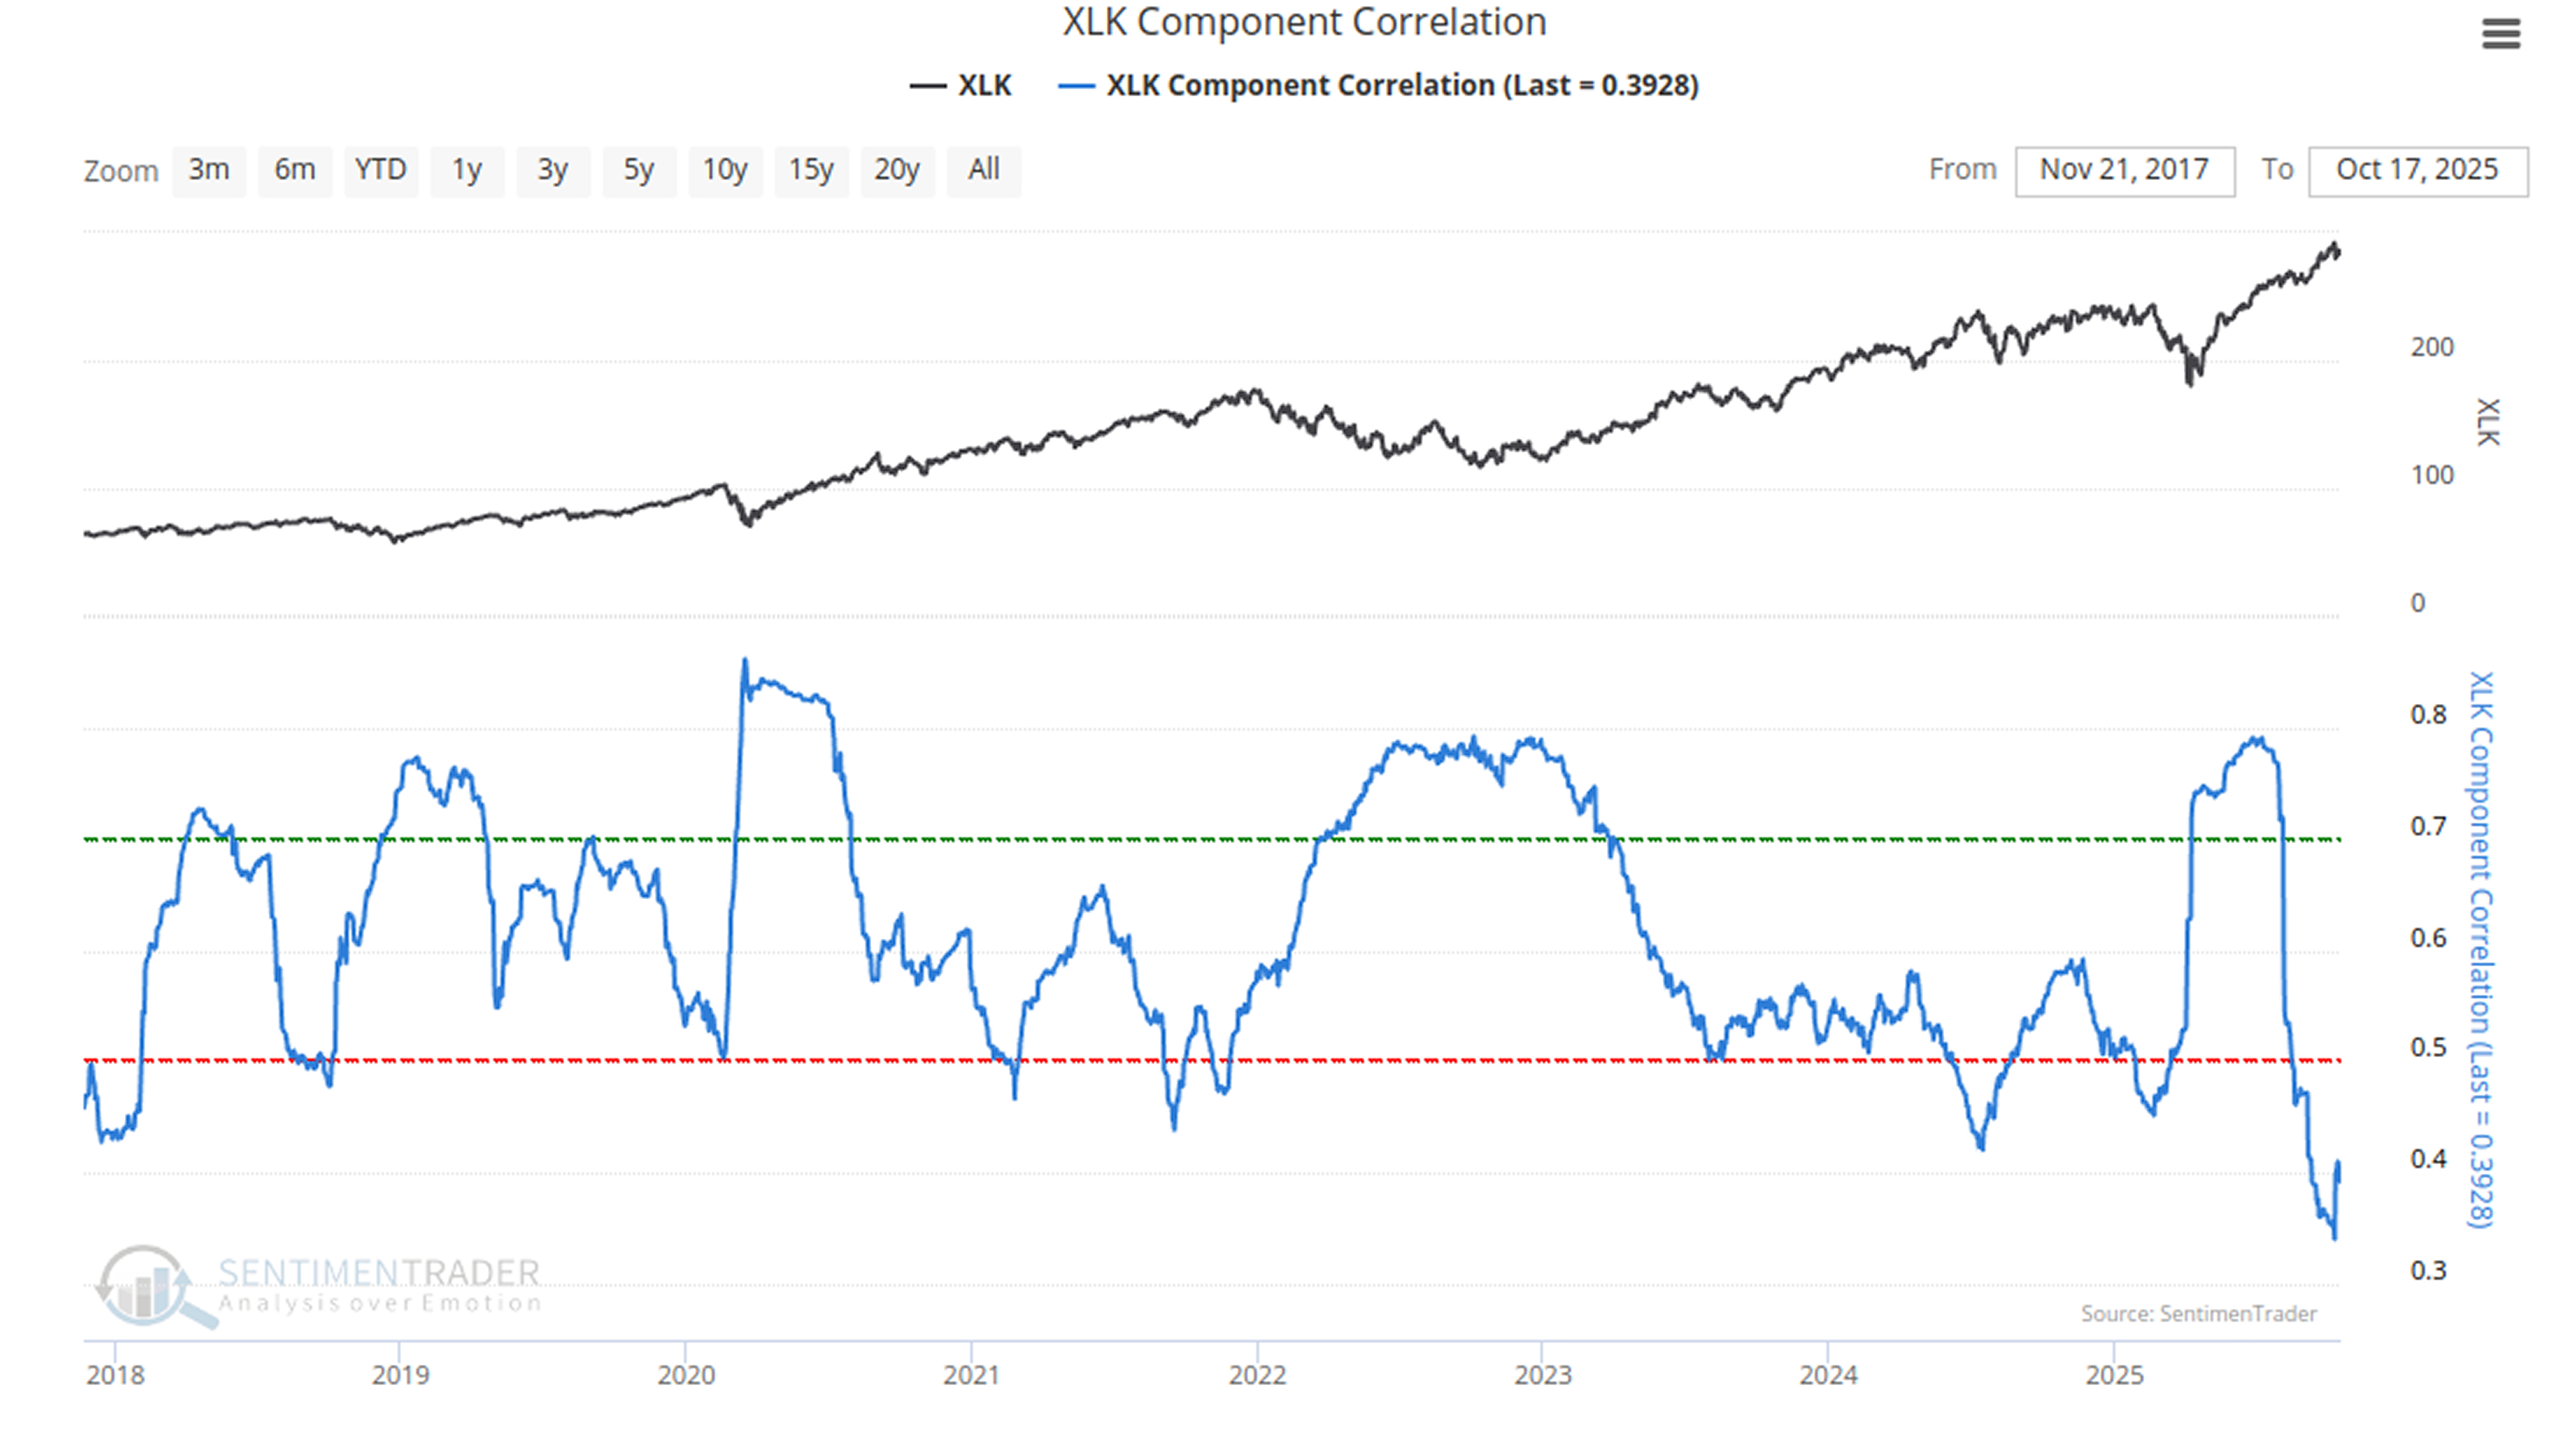
Internal correlation among tech stocks has hit a multi-year low, yet bearish divergence signals are rampant (insider selling, deteriorating fund flows, etc.). If earnings fail to meet lofty valuation expectations, retail investors' "all-in" stance could amplify downward momentum.
What the Research Reveals...
The tech sector's performance this year has been nothing short of spectacular, but it's now in a state of fragmentation. This isn't a "bullish resonance"-it's a "bearish divergence".
The market is split into two camps:
- Bullish/Optimistic Camp (Sentiment Indicators): Retail Investors (Rydex) + Market Sentiment (Low P/C Ratio) + Seasonality (Historical Patterns).
- Bearish/Pessimistic Camp ("Smart Money" & Internal Structure): Insiders + Fund Flows + Market Breadth.
Taken together, these factors make the sector's outlook at best mediocre and highly susceptible to shocks. Retail investors' reliance on the "AI narrative" and "seasonality" has provided ample "fuel" for "smart money" to exit. If results from the "Super Tech Earnings Week" fail to live up to the market's high valuation hopes, the direction of this consolidation could be far from what bulls are expecting.