Products
SentimenTrader Trading Tools
‍
Backtest Engine
My Trading Toolkit
Correlation Analysis
Seasonality
Market Prediction
Indicators & Data API
‍
Proprietary Indicators & Charts
Market Data API
Strategies & Scanner
‍
50+ Trading Strategies
Smart Stock Scanner
Smart Option Scanner
Research Reports
‍
Research Solutions
Reports Library
Free Resources
Simple Backtest Calculator
Simple Seasonality Calculator
The Kelly Criterion Calculator
Sentiment Geo Map
Public Research Reports
Education
Sentiment Indicators
Technical Indicators
Pricing
Company
About
In the News
Testimonials
Client Success Stories
Contact
Log inLoginSign up
< BACK TO ALL REPORTS

The S&P 500's valuation has dropped by a third

Jason Goepfert
2022-05-09
The S&P 500's Price/Earnings Ratio has declined more than 35% from its recent peak. That ranks among the largest drawdowns in valuation since the 1950s, and its forward returns tend to be good following such a large reset.

Key points:

  • The S&P 500's trailing Price/Earnings Ratio has declined 35% from its 3-year high
  • That ranks among the largest drawdowns in valuation in 70 years
  • Forward returns from similarly sharp valuation contractions tended to be good over the next several months

Valuation has dropped by a third

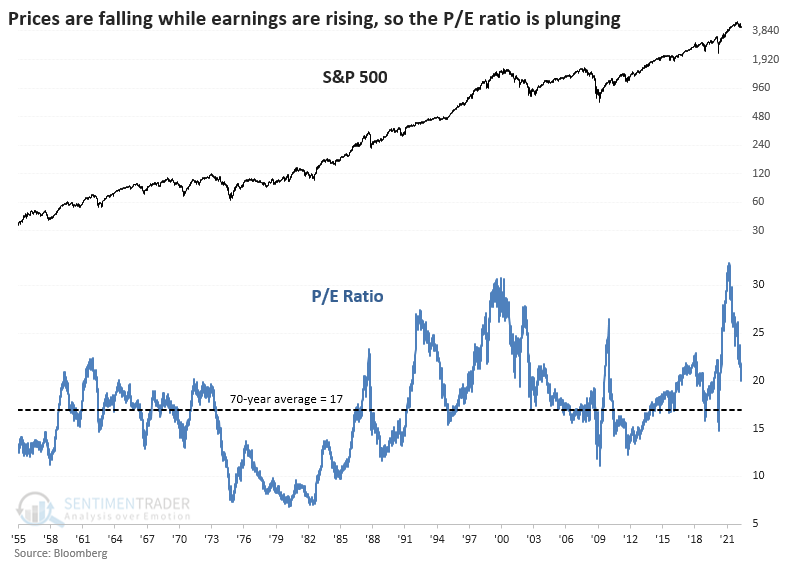
Stock prices have taken a tumble, but as-reported earnings haven't. Prices usually lead earnings, so it's possible (probable, even) that earnings will start to decline.

But they haven't yet, so the combination of falling prices and steady or even rising earnings has caused the S&P 500's Price/Earnings Ratio to plunge. As it craters below 20, the P/E Ratio is nearing its average of 17 from the past 70 years.

While the S&P has pulled back less than 15% from its one-year high, its valuation metric has plunged more than twice as much, more than 35%. The largest drawdown in valuation from a three-year high was 63% in 1974 followed by a couple of 50% resets after the 1987 market crash and the 2008 financial crisis. The current drawdown ranks in the bottom 15% of all days since the early 1950s.

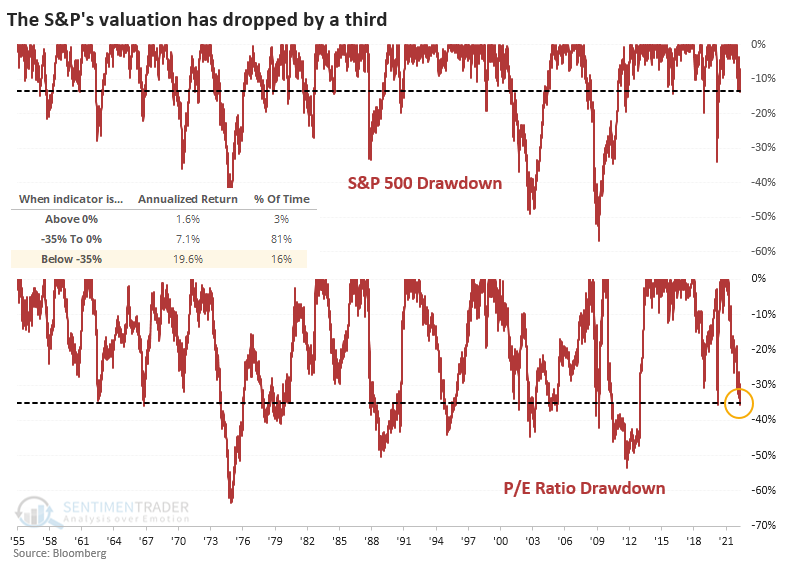
The S&P 500's annualized return when its P/E Ratio was more than 35% off its peak was an impressive +19.6%, thanks to large and persistent rebounds following protracted selloffs.

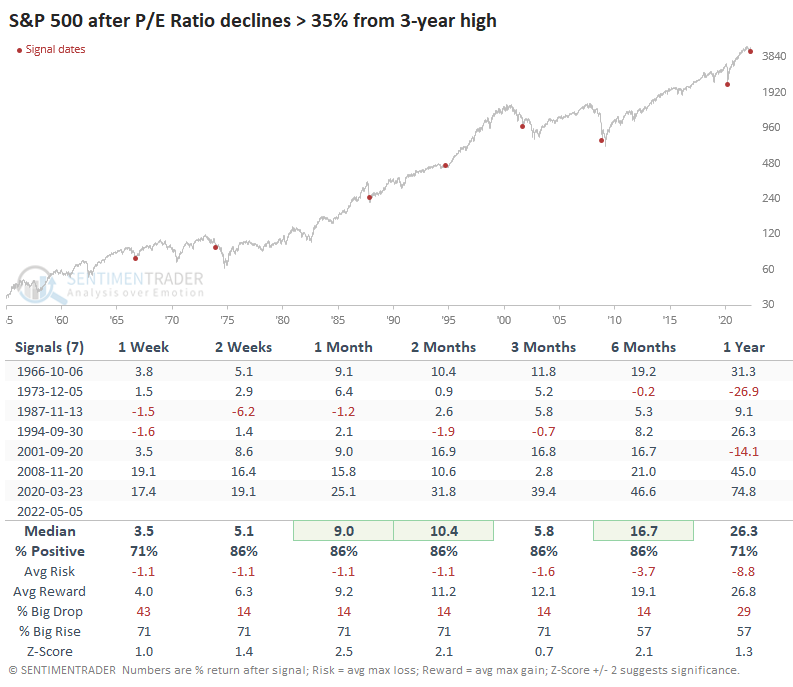
The table below uses a signal-based approach, looking at the S&P's future returns once its valuation dropped by more than 35% from a multi-year high. Over the medium-term, its performance was very good, with only isolated and small losses. But two of them, in 1974 and 2001, triggered during the halfway mark of protracted bear markets.

So, is the S&P 500 index's price more likely to catch down to its valuation, or is its valuation more likely to catch up to its price? Divergences are always tricky, but the table below shows every time the index was in less than a 15% drawdown while its valuation drawdown was at least twice that.

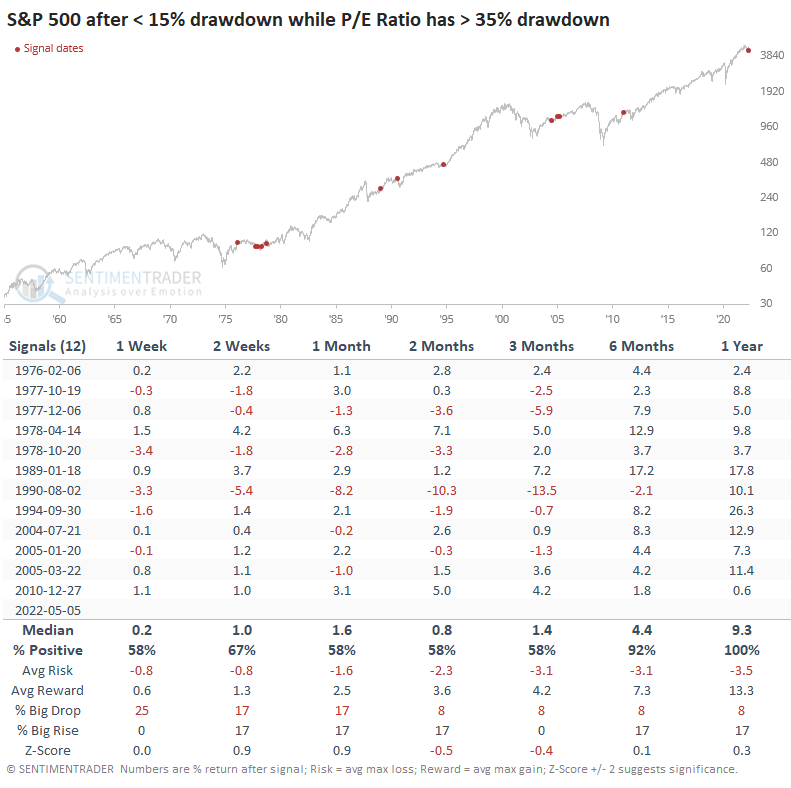
Returns were good for the index going forward, about in line with random up to six months later. From there forward, though, the S&P did very well, at least in terms of consistency. Its average return was mediocre, but it showed a positive return every time over the next year.

What the research tells us...

Investors are dealing with a head-spinning number of cross-currents at the moment, and the market environment doesn't help. It's very poor, rallies are being sold, and extremes aren't generating the kinds of buying interest that characterized much of the past 12 years. The past week witnessed more extremes in pessimism, which even during bear markets tend to lead to multi-week or even multi-month rebounds. The sudden re-valuation of the most important index in the world is becoming compelling because that was a major headwind heading into this decline. Now, we need to see some of the bear market hallmarks evaporate and get some thrusts in buying interest that don't get sold immediately.

PRODUCTS
SentimenTrader
Trading Tools
Indicators & Data API
‍
Strategies & Scanner
‍
Research Reports
FREE
RESOUrCES
Simple Backtest
Calculator
Simple Seasonality
Calculator
The Kelly Criterion
Calculator
Sentiment Geo Map
‍
Public Research Reports
‍
Education
Sentiment Indicators
‍
Technical Indicators
‍
Pricing
Bundle pricing
‍
FAQ
‍
Announcements
‍
COMPANY
‍
About
‍
In the News
‍
Testimonials
‍
Client Success Stories
CONTACT
‍
General Inquiries
‍
Media Inquiries
‍
Financial Professionals Inquiries
‍
© 2026 Sundial Capital Research Inc. All rights reserved.
Setsail Marketing
TermsPrivacyAffiliate Program
Risk Disclosure: The information and tools provided are for research and analytical purposes only and are not intended as investment advice. Market analysis involves uncertainty, and outcomes may differ from expectations. Users should conduct their own due diligence and consider their individual circumstances before making any financial decisions. Past performance is not necessarily indicative of future results.

Hypothetical Performance Disclosure: Hypothetical performance results have many inherent limitations, some of which are described below. No representation is being made that any account will or is likely to achieve profits or losses similar to those shown; in fact, there are frequently sharp differences between hypothetical performance results and the actual results subsequently achieved by any particular trading program. One of the limitations of hypothetical performance results is that they are generally prepared with the benefit of hindsight. In addition, hypothetical trading does not involve financial risk, and no hypothetical trading record can completely account for the impact of financial risk of actual trading. for example, the ability to withstand losses or to adhere to a particular trading program in spite of trading losses are material points which can also adversely affect actual trading results. There are numerous other factors related to the markets in general or to the implementation of any specific trading program which cannot be fully accounted for in the preparation of hypothetical performance results and all which can adversely affect trading results.

Testimonial Disclosure: Testimonials appearing on this website may not be representative of other clients or customers and is not a guarantee of future performance or success.