
The S&P 500's V-shaped bottom and 50% retracement

Key points:
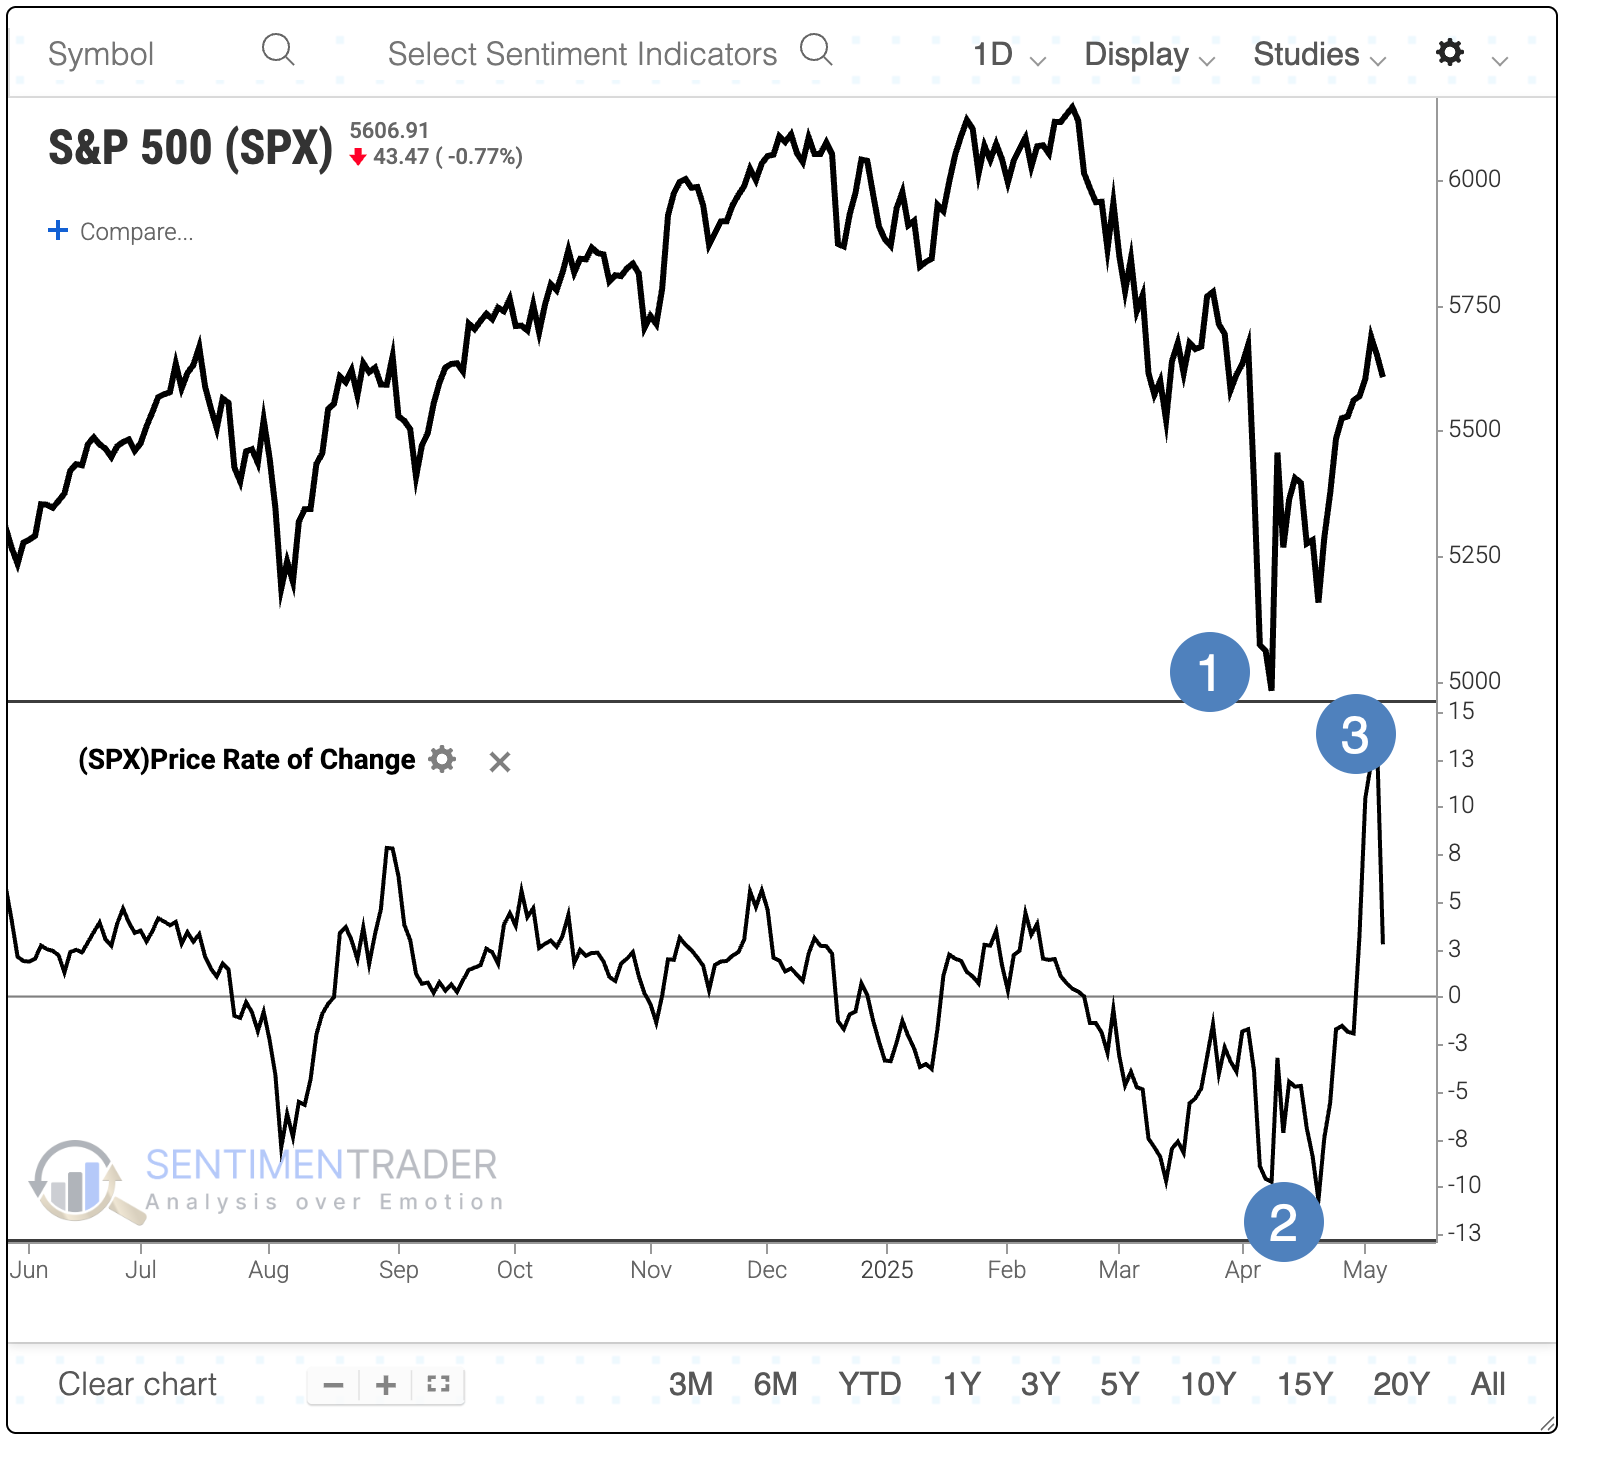
- The S&P 500 declined fast and recovered fast, hinting at a V-shaped recovery
- It also retraced more than 50% of its decline within 18 sessions, which is historically quick
- Similar behavior tended to see sustained rallies, with the 1930s and 2001 being the prime exceptions
A mostly V-shaped recovery
Stocks have rallied hard since bottoming in April, and V-shaped bottoms have occurred often since the global financial crisis. Nobody wants to miss another, so the natural inclination is to wonder, "Is that it?"
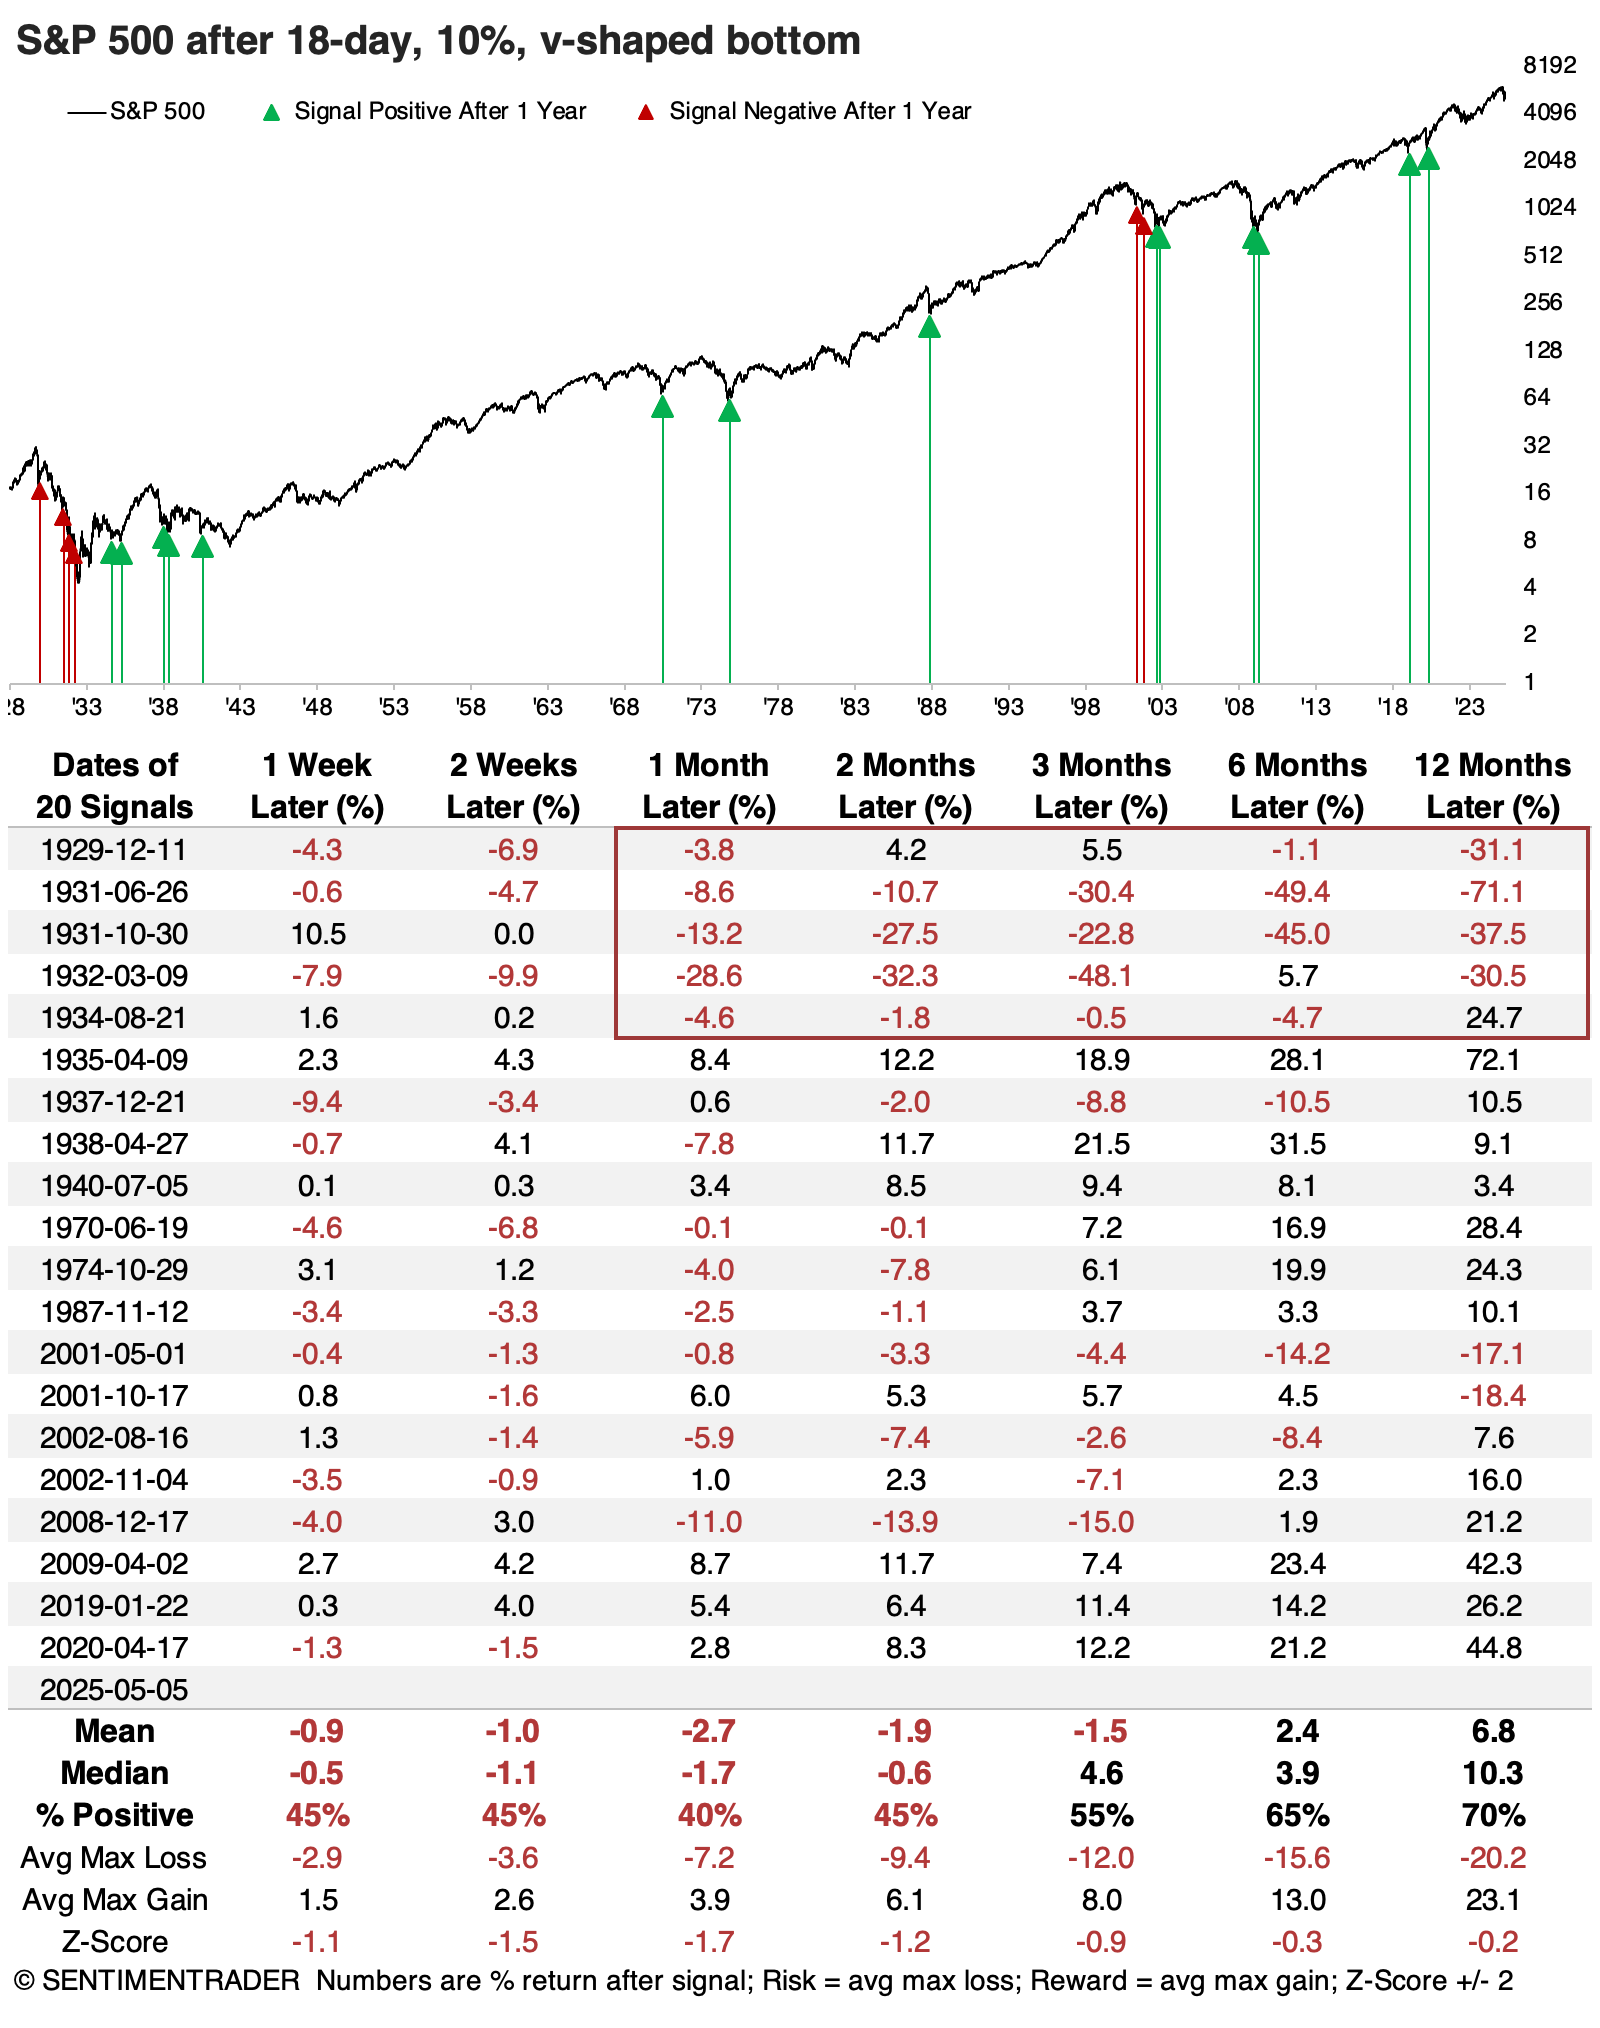
We've measured price action like this many times over the decades, and it can be helpful to look at the probabilities. What we're looking at are times when the S&P 500:
- Declined to a 9-month low
- Suffered at least a 10% decline over 18 trading days to get to that low
- Rebounded at least 10% over the following 18 days without violating the low
Many of these V-shaped bottoms turned out not to be bottoms at all. The S&P's returns following these patterns were unimpressive, especially on shorter time frames, and especially especially during the Great Depression.
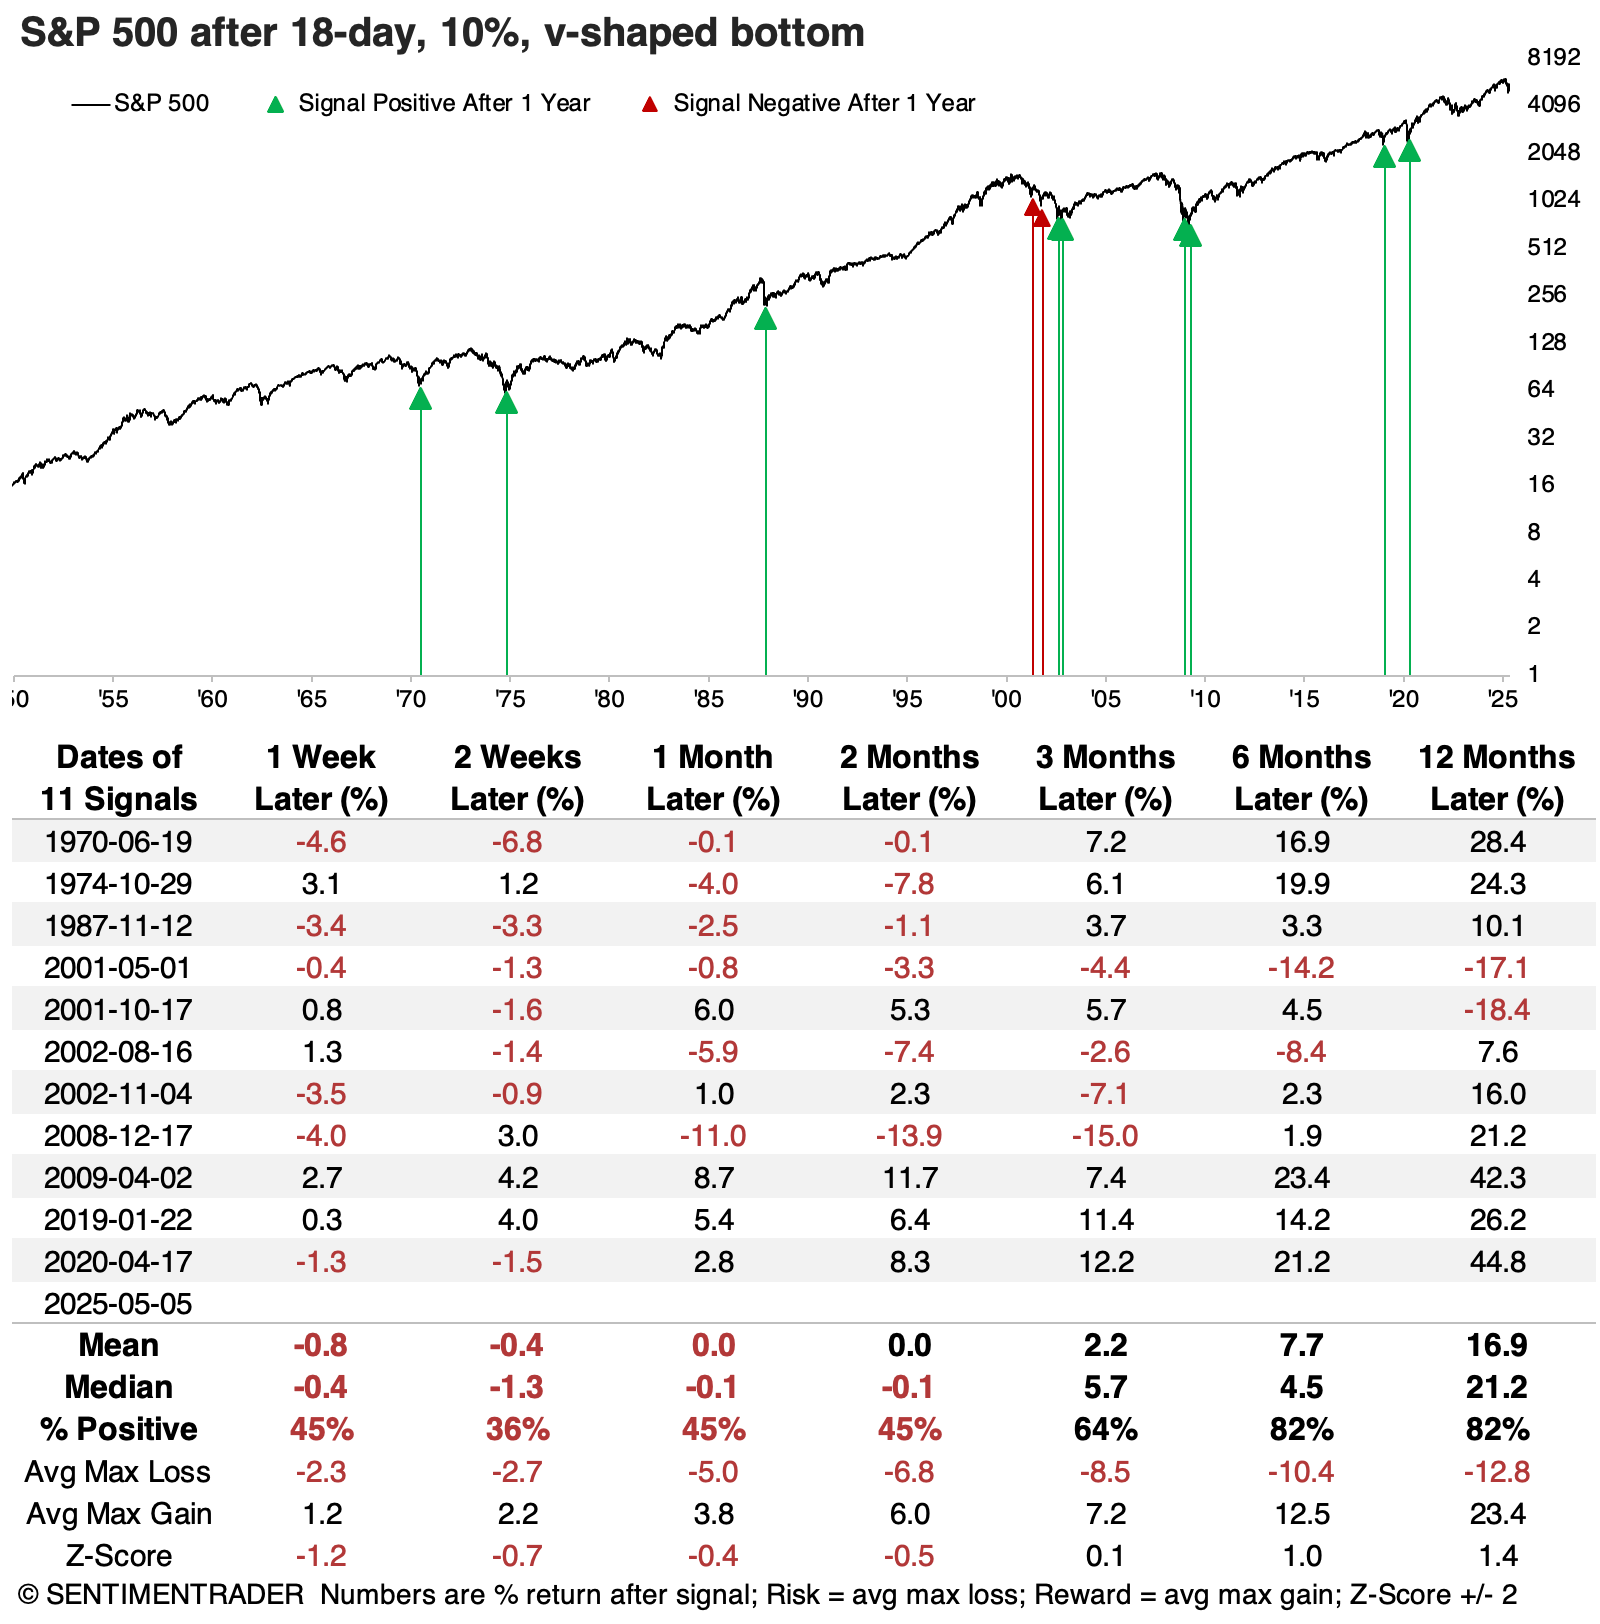
Since we're (probably) not in or nearing a depression currently, the table below filters the signals to only include those since the index became a 500-stock index in 1957. Returns over the next few weeks were still weak, with all but two signals suffering a loss either two or four weeks later.
The only absolute failures occurred during the 2001-02 bear market. Anyone trading at the time likely remembers the vicious rallies during this period, and the false dawns that obliterated investor sentiment as the rallies continued to fail.
A fast, hard retracement
Over the years, we've examined how much and how fast stocks retrace significant declines. Very often, those retracements contain good information. The more of a decline that is retraced and the quicker it occurs, the more bullish it is for future returns.
That should be a good sign now, as the S&P 500 has clawed back more than half of its losses. However, it just barely missed the 62% retracement (okay, 61.8%) that technicians often refer to since it is a Fibonacci number.
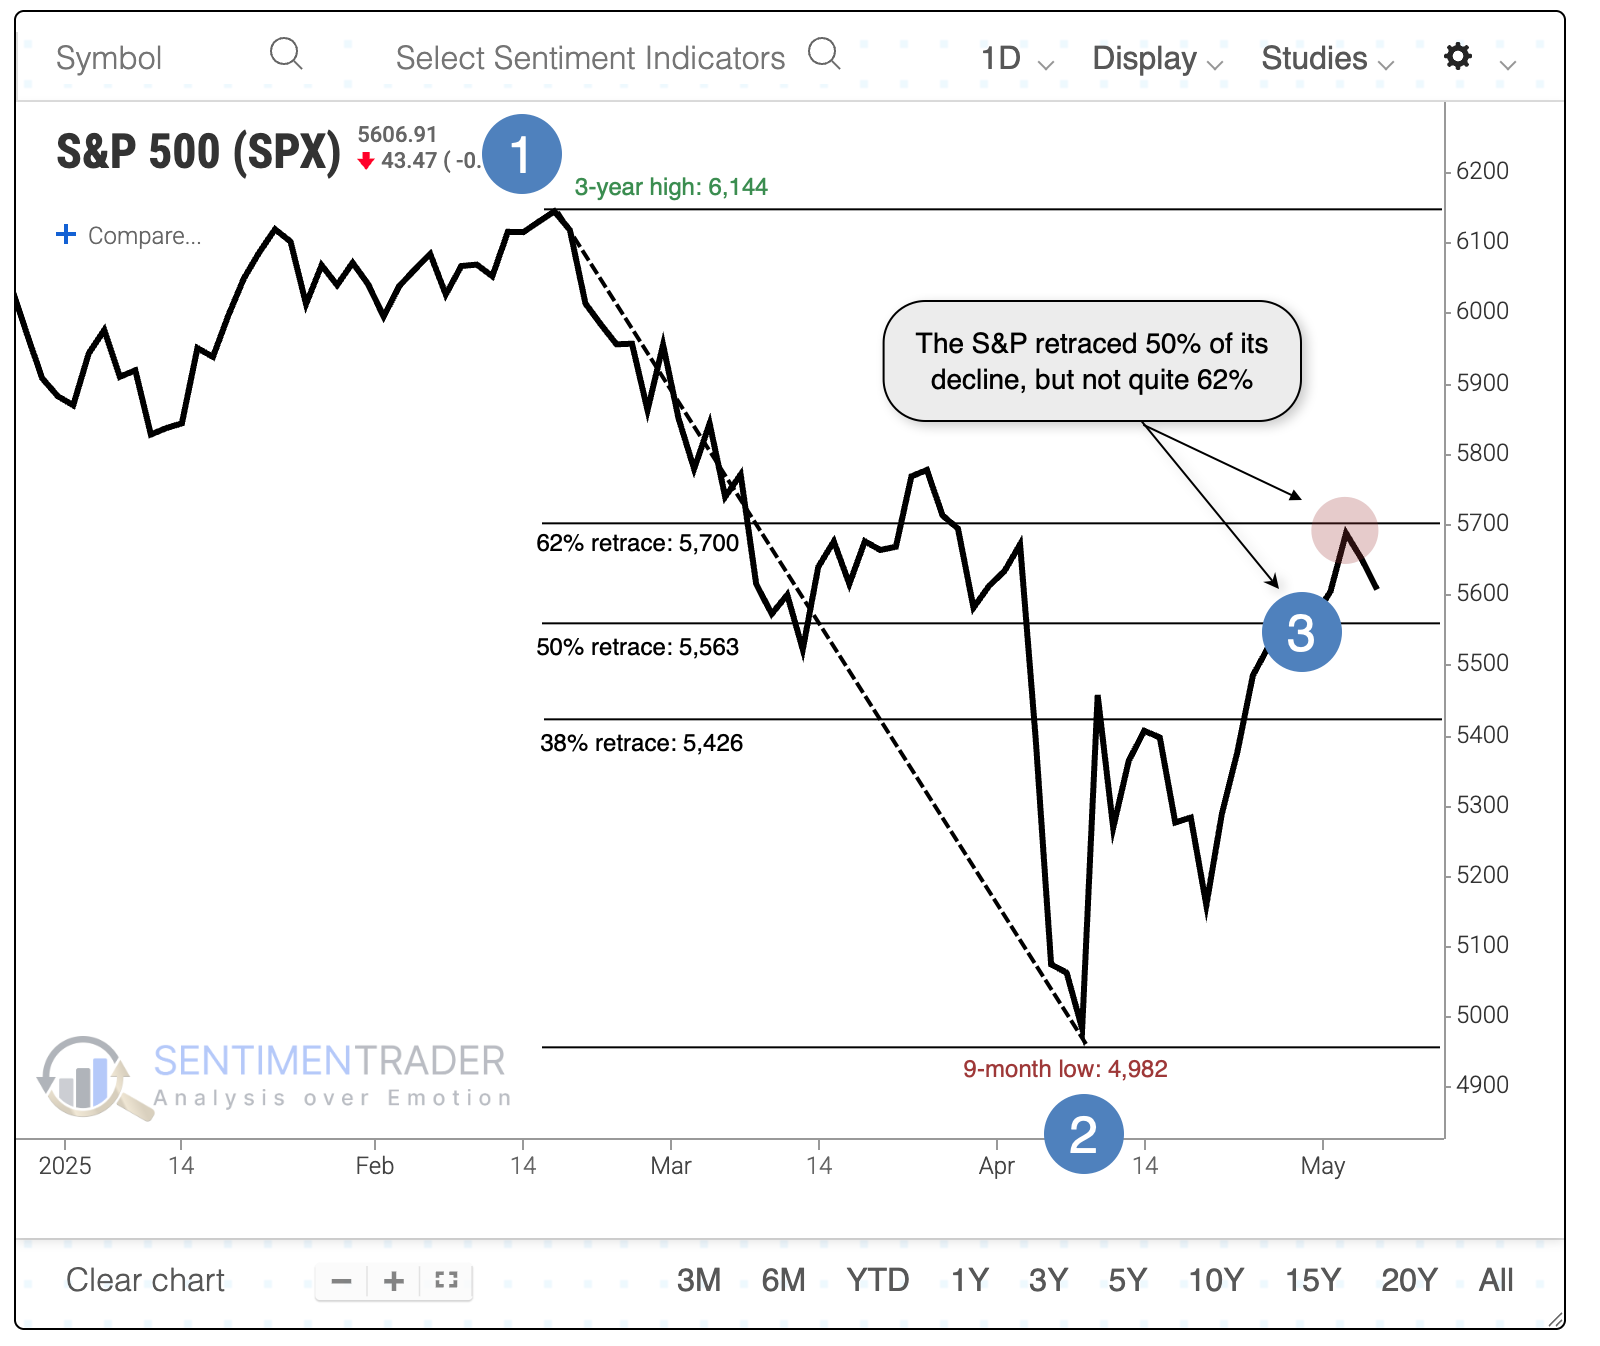
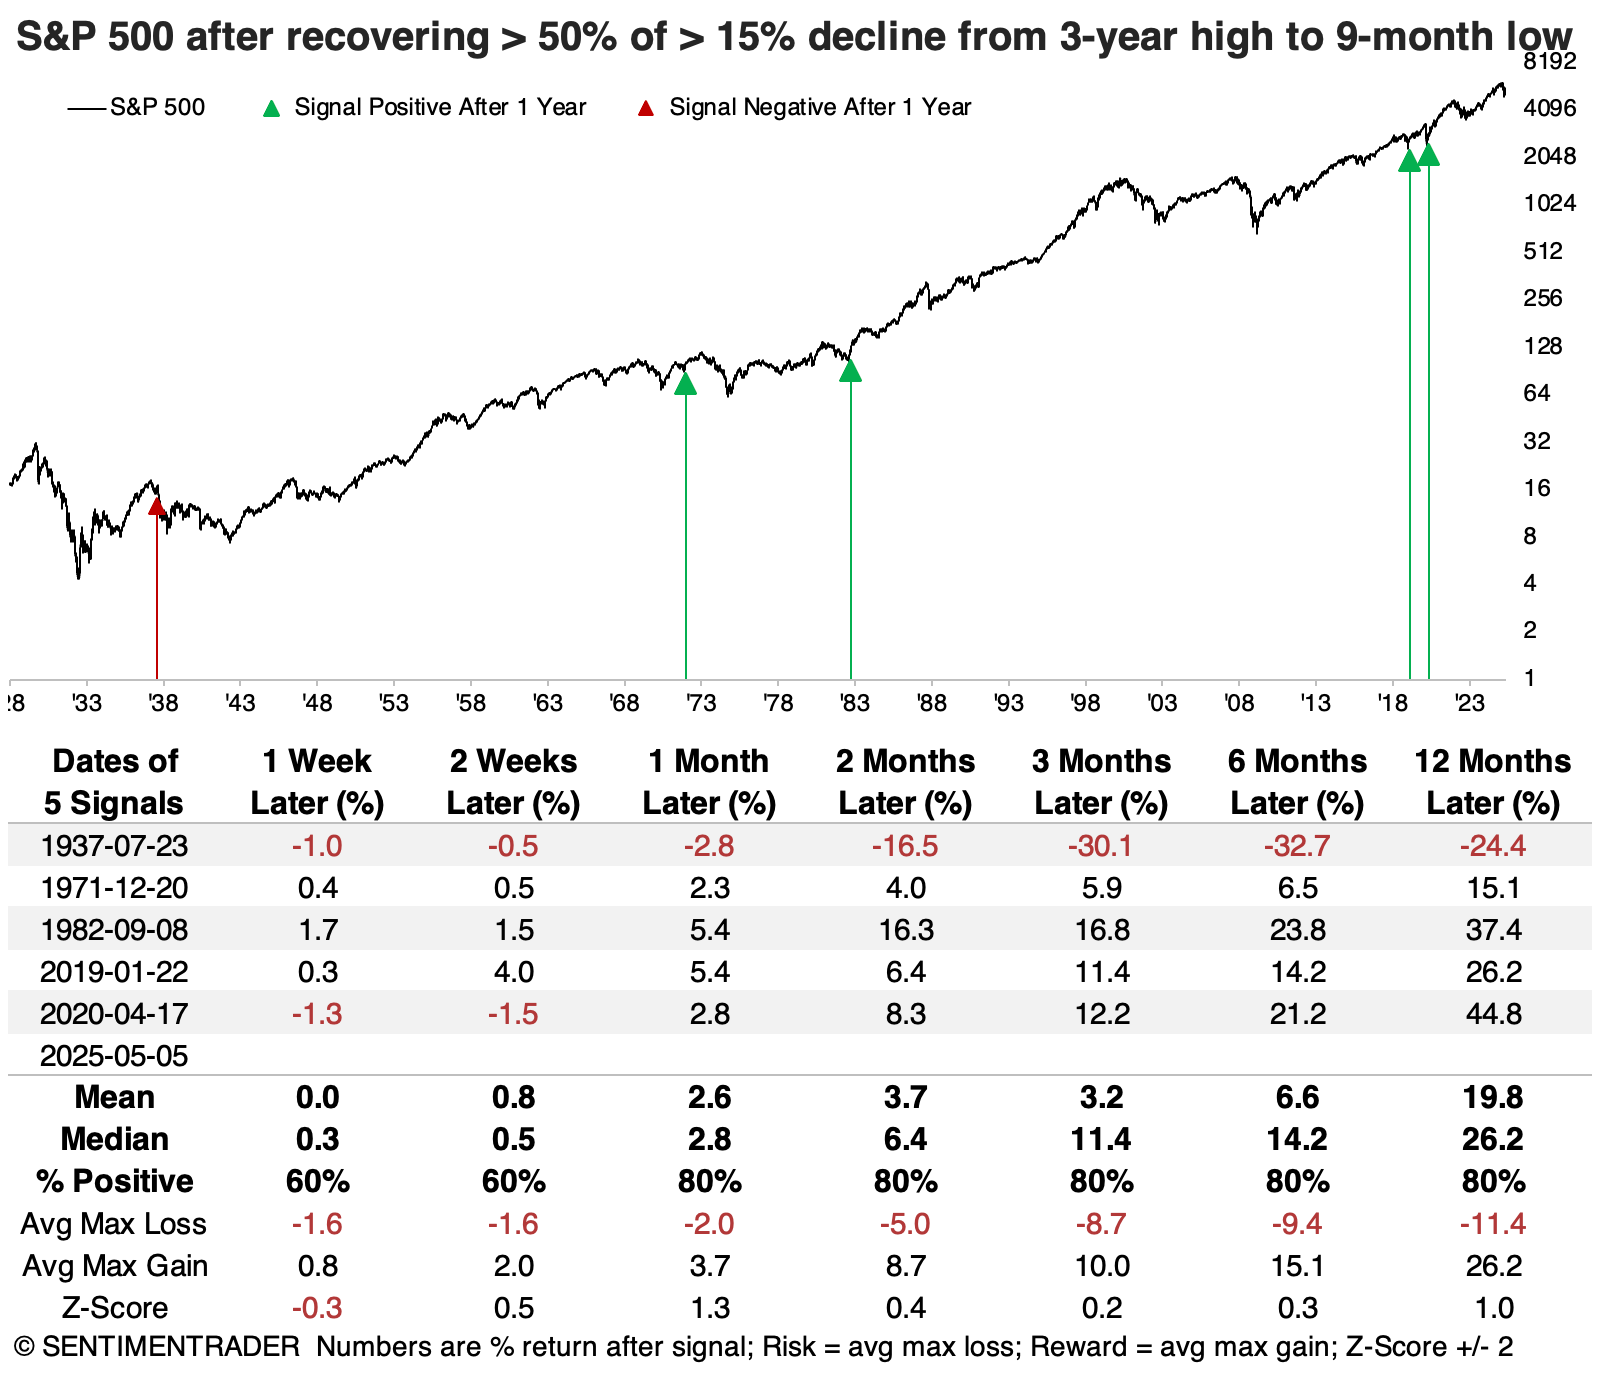
It was a good sign when the index declined at least 15% from a three-year high to a nine-month low and recovered at least half of that decline within 18 sessions, except during the Great Depression. The other four instances never lost more than 5% from the signal date through the following year.
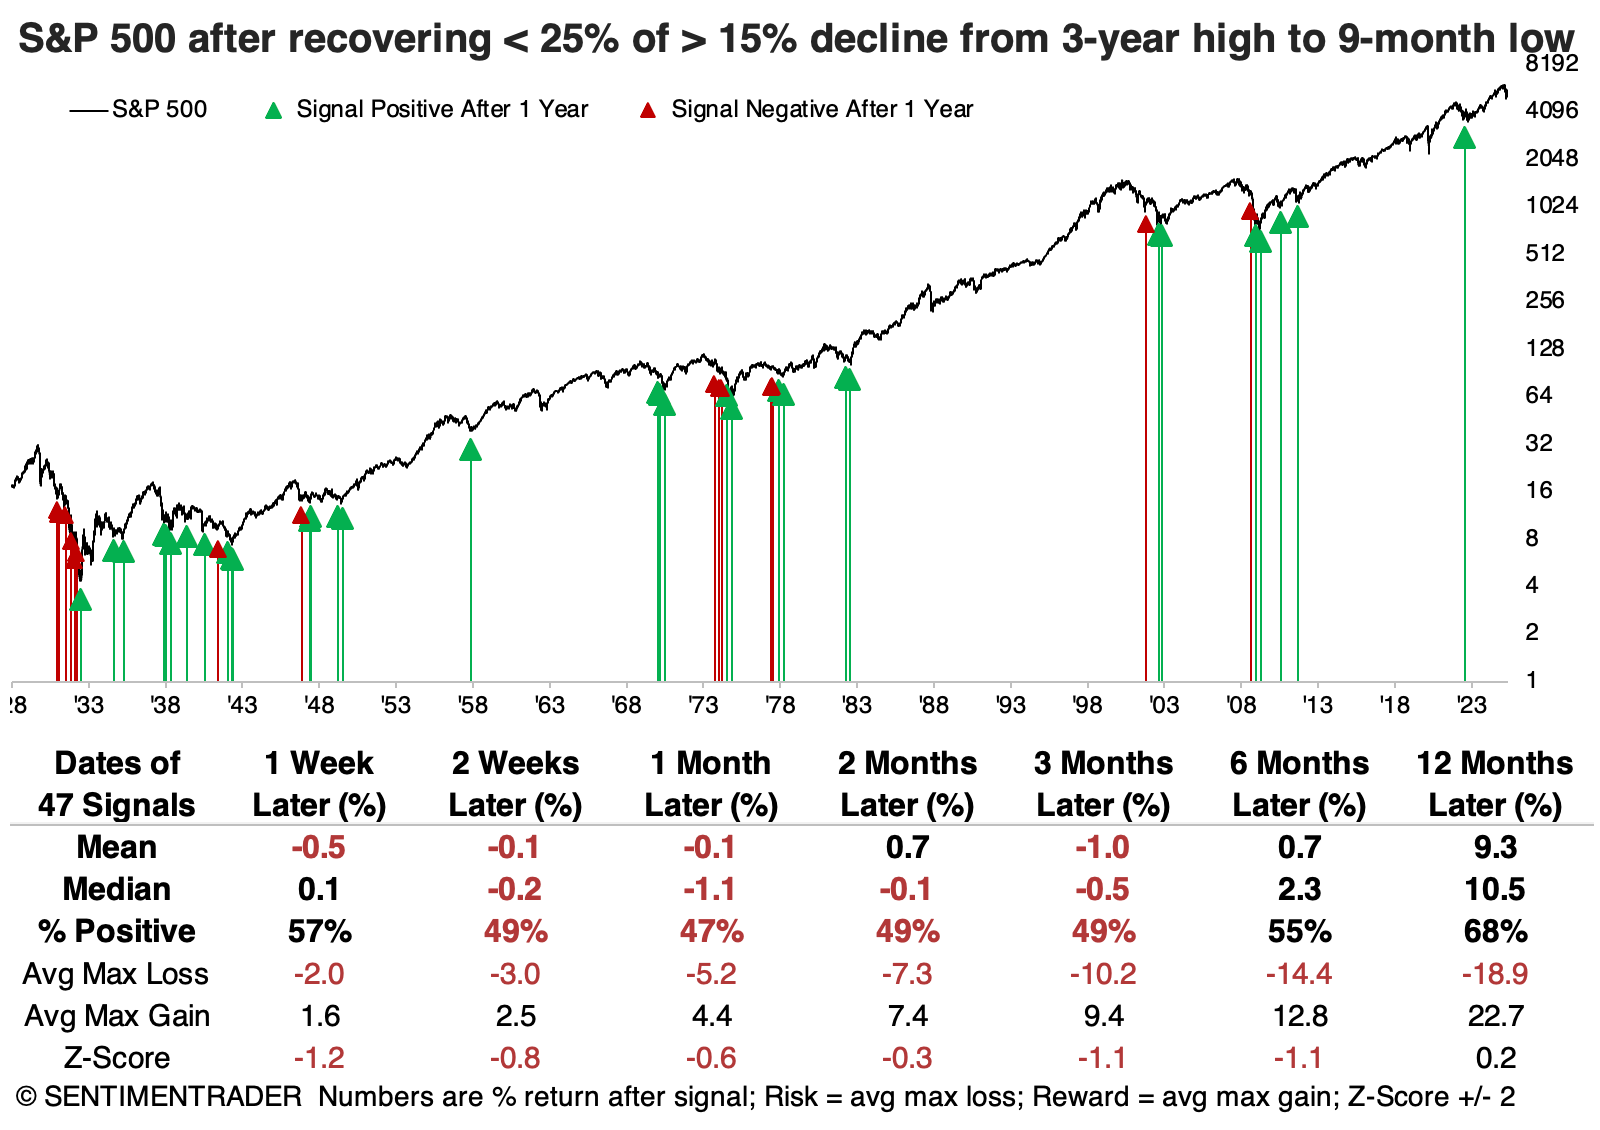
We like to look at counterexamples, so the summary stats below show the opposite cases. These are times when the S&P could not retrace more than a quarter of its losses over the first 18 days from a low. Returns were weak up to three months following these tepid retracements, with a poor ratio of risk to reward.
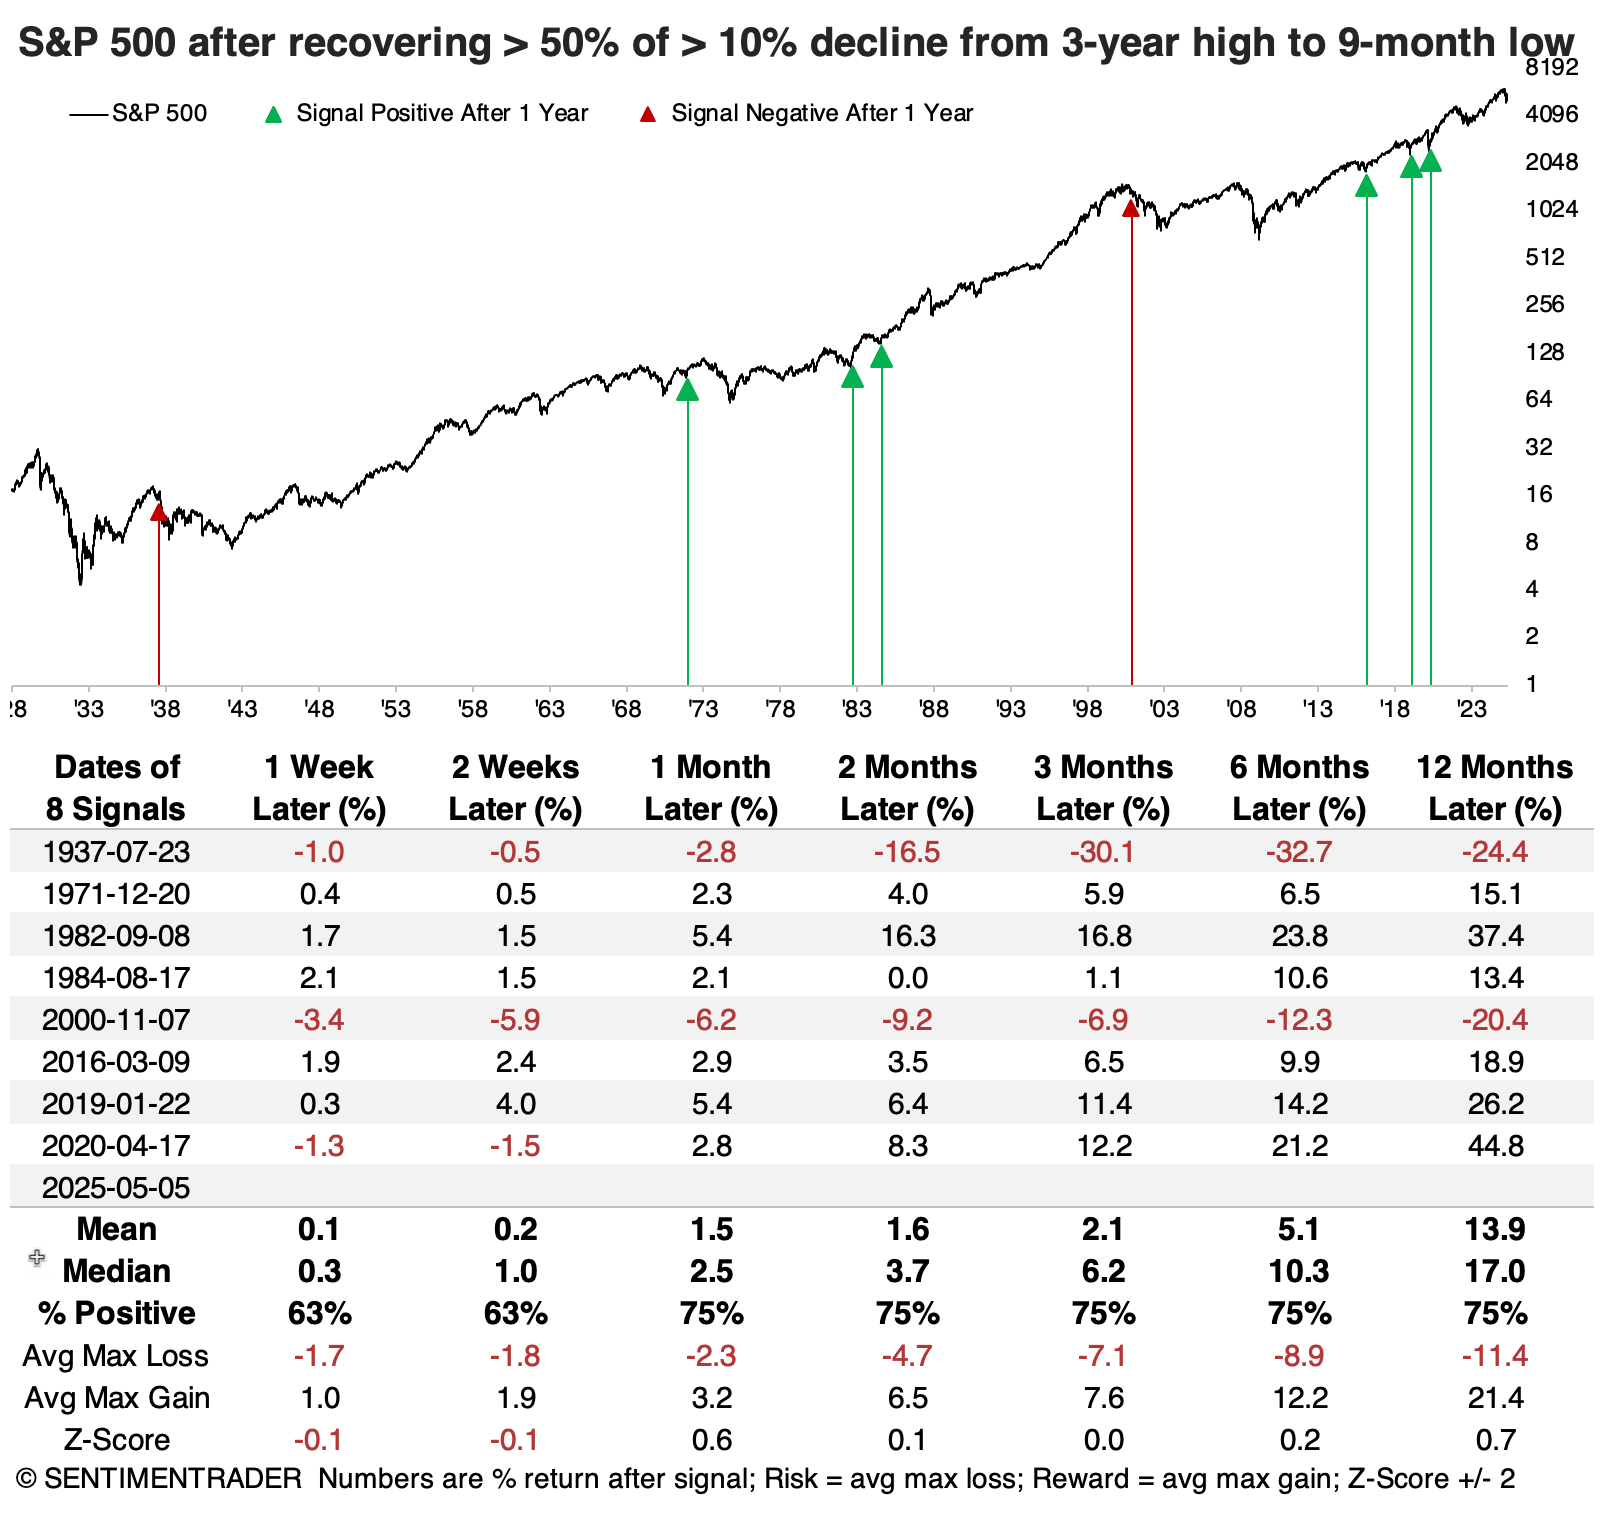
The sample size above is tiny, so if we relax the parameters by looking at 10% declines (instead of 15%), we get a few more instances. These were mostly successful, but it added a failure in 2000 as the internet bubble was popping. Again, all the successful signals never saw more than a 5% drawdown within a year. Both failures lost more than 5% within the first two months.
What the research tells us...
Market structure may have changed enough in the past 20 years so that V-shaped bottoms will be more common than in the past. Some evidence suggests this is likely the case; it's also a dangerous theory. Buying every sharp decline on the assumption that there will be a V-shaped bottom is an investor's equivalent of playing roulette.
Instead of buying and hoping, measuring the speed and magnitude of declines and rallies can help determine whether a bottom is more likely to last. Based on behavior since the April low, it does seem more likely than usual that the rally is sustainable. Of course, nothing is guaranteed, and all we're dealing with are probabilities. The good news is that the probabilities shifted in bulls' favor.