
The S&P 500 scrapes new low relative to gold

Key points:
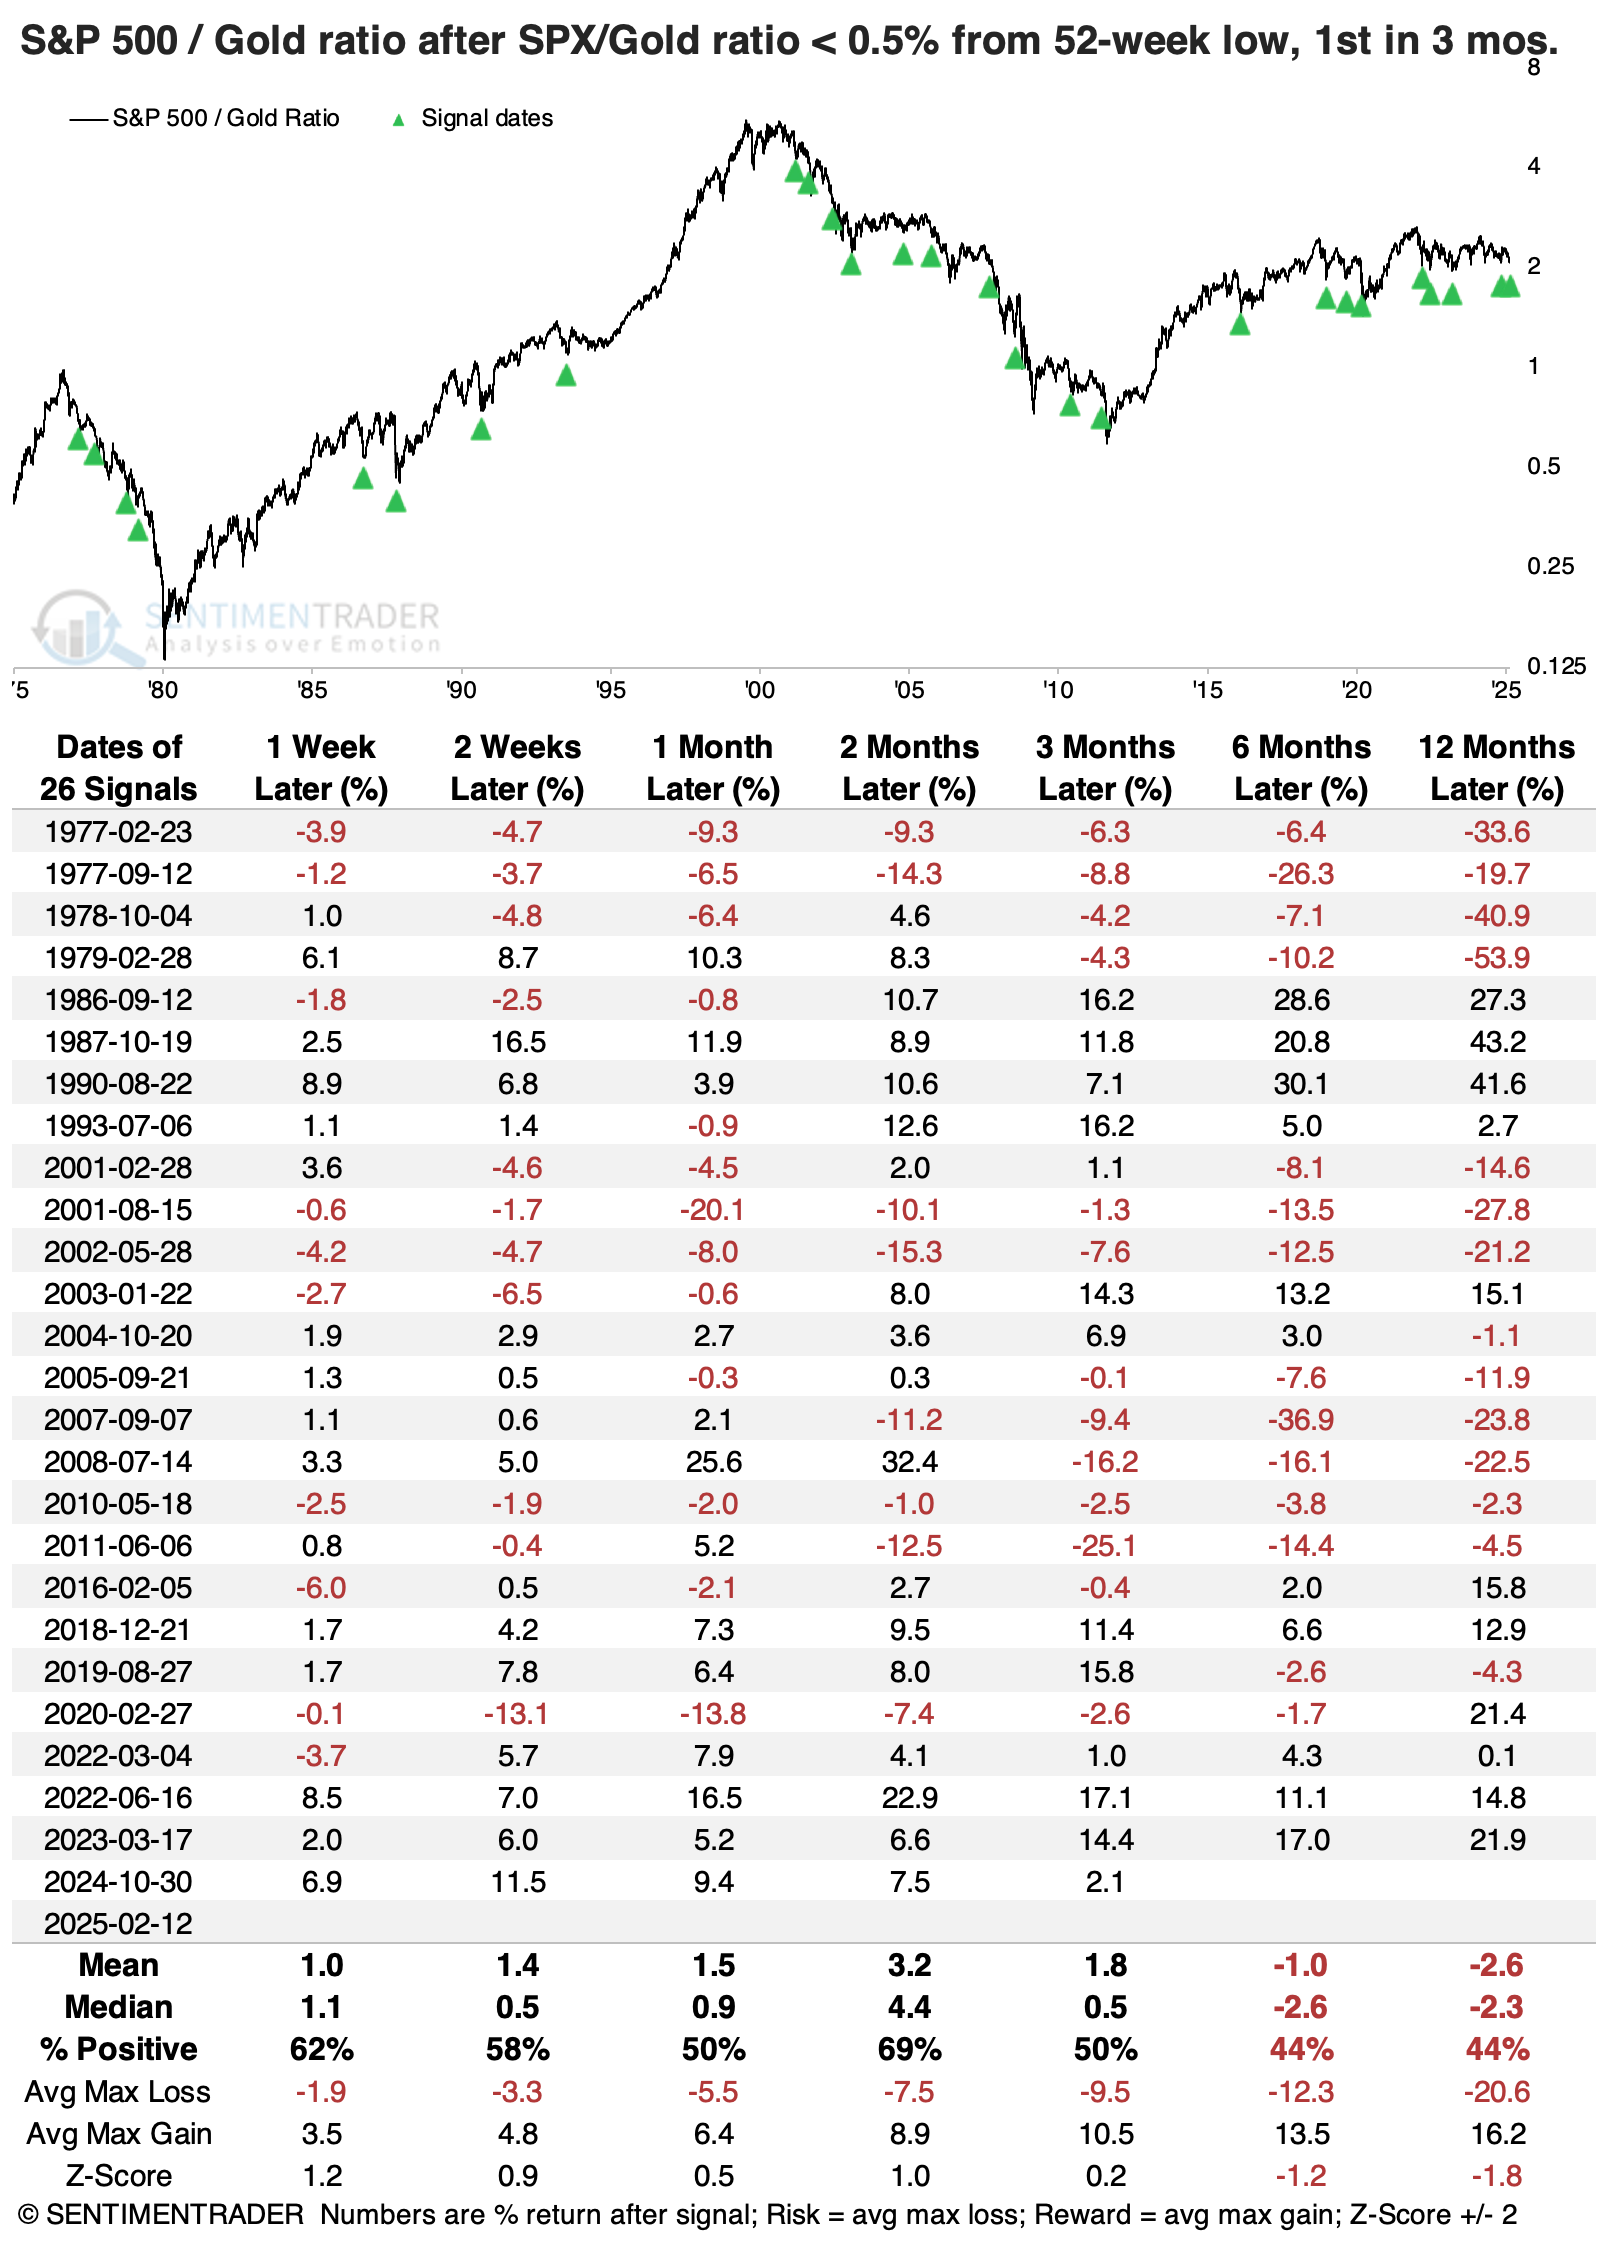
- The S&P 500 came close to a 52-week low relative to gold
- After other times the ratio nearly reached a low, stocks tended to rebound more than gold
- Over longer time frames, gold showed a consistent tendency to outperform
Stocks nearly fall to new low, relatively
As well as stocks have done lately, gold has done just as well, or better. That's not a typical scenario.
Because the S&P 500 hasn't quite kept up to gold's gains, the ratio between the two has steadily declined and came within a hair's breadth of hitting a 52-week low.
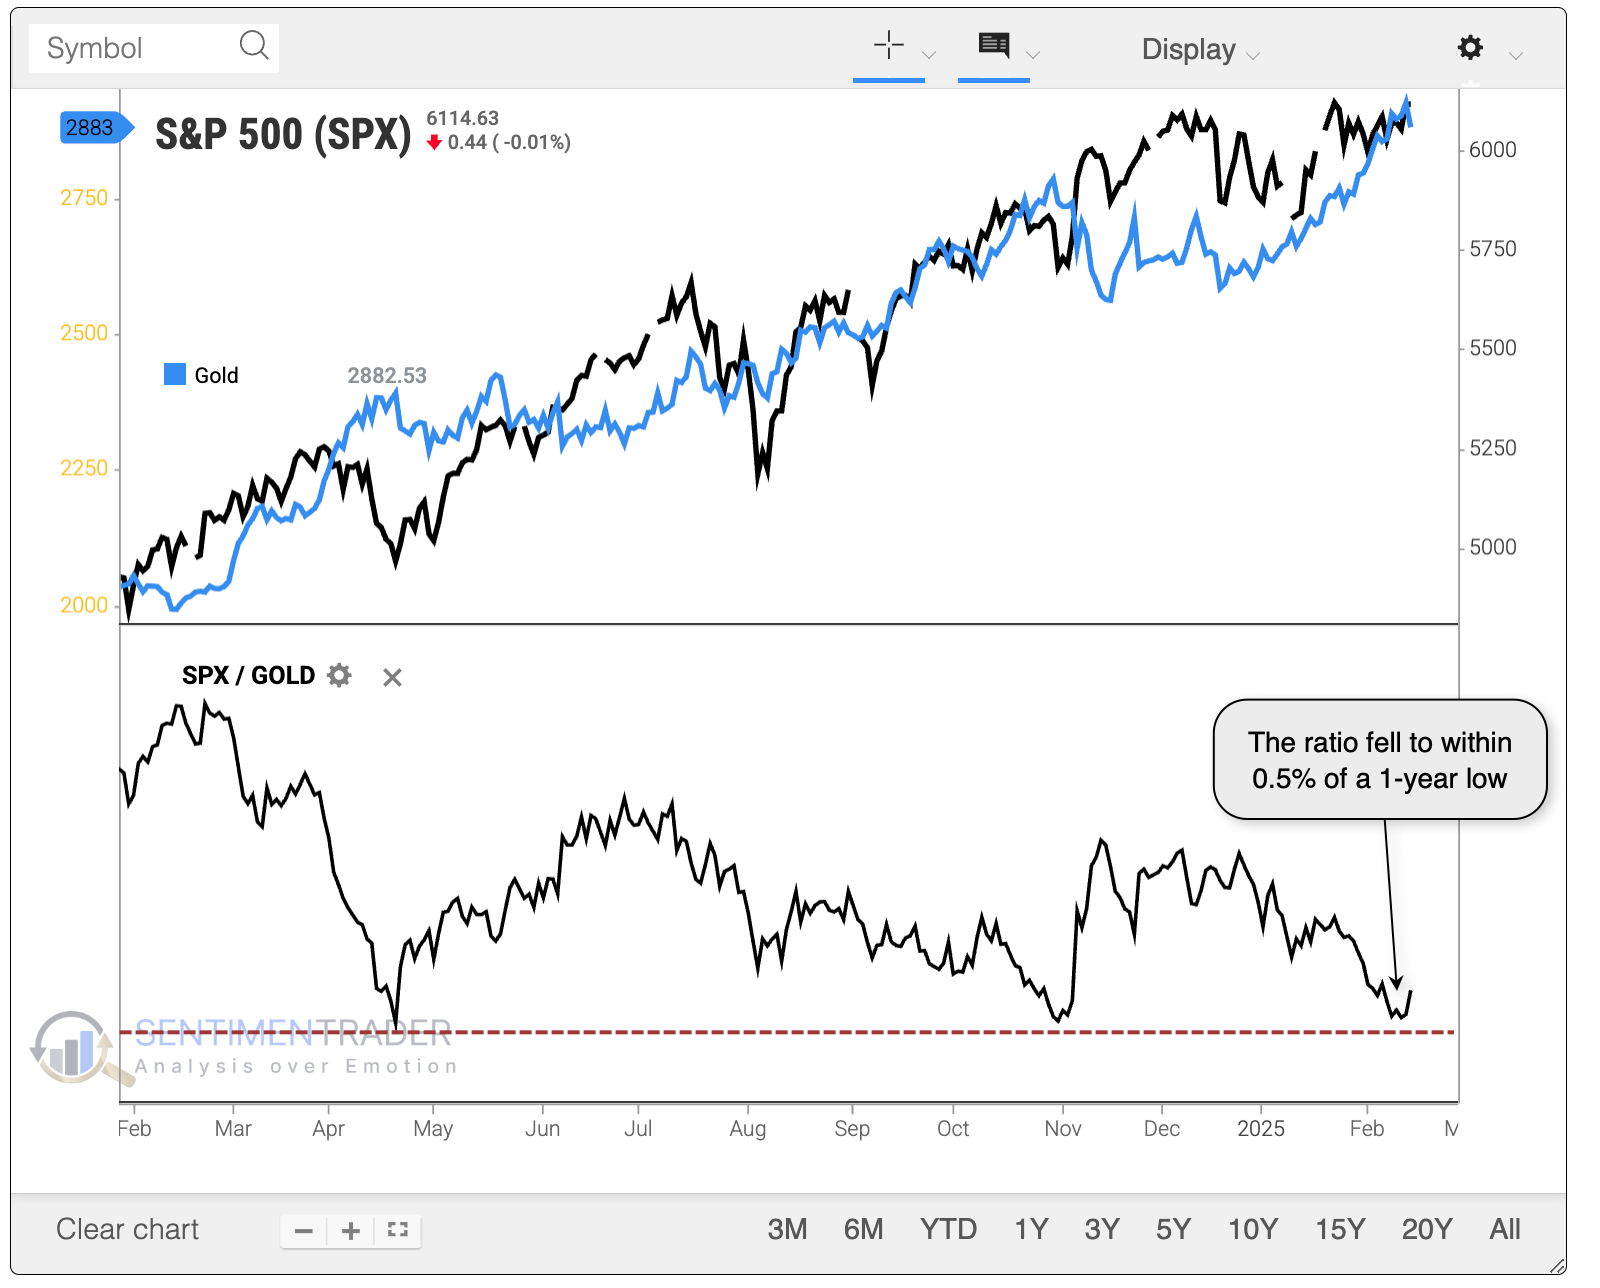
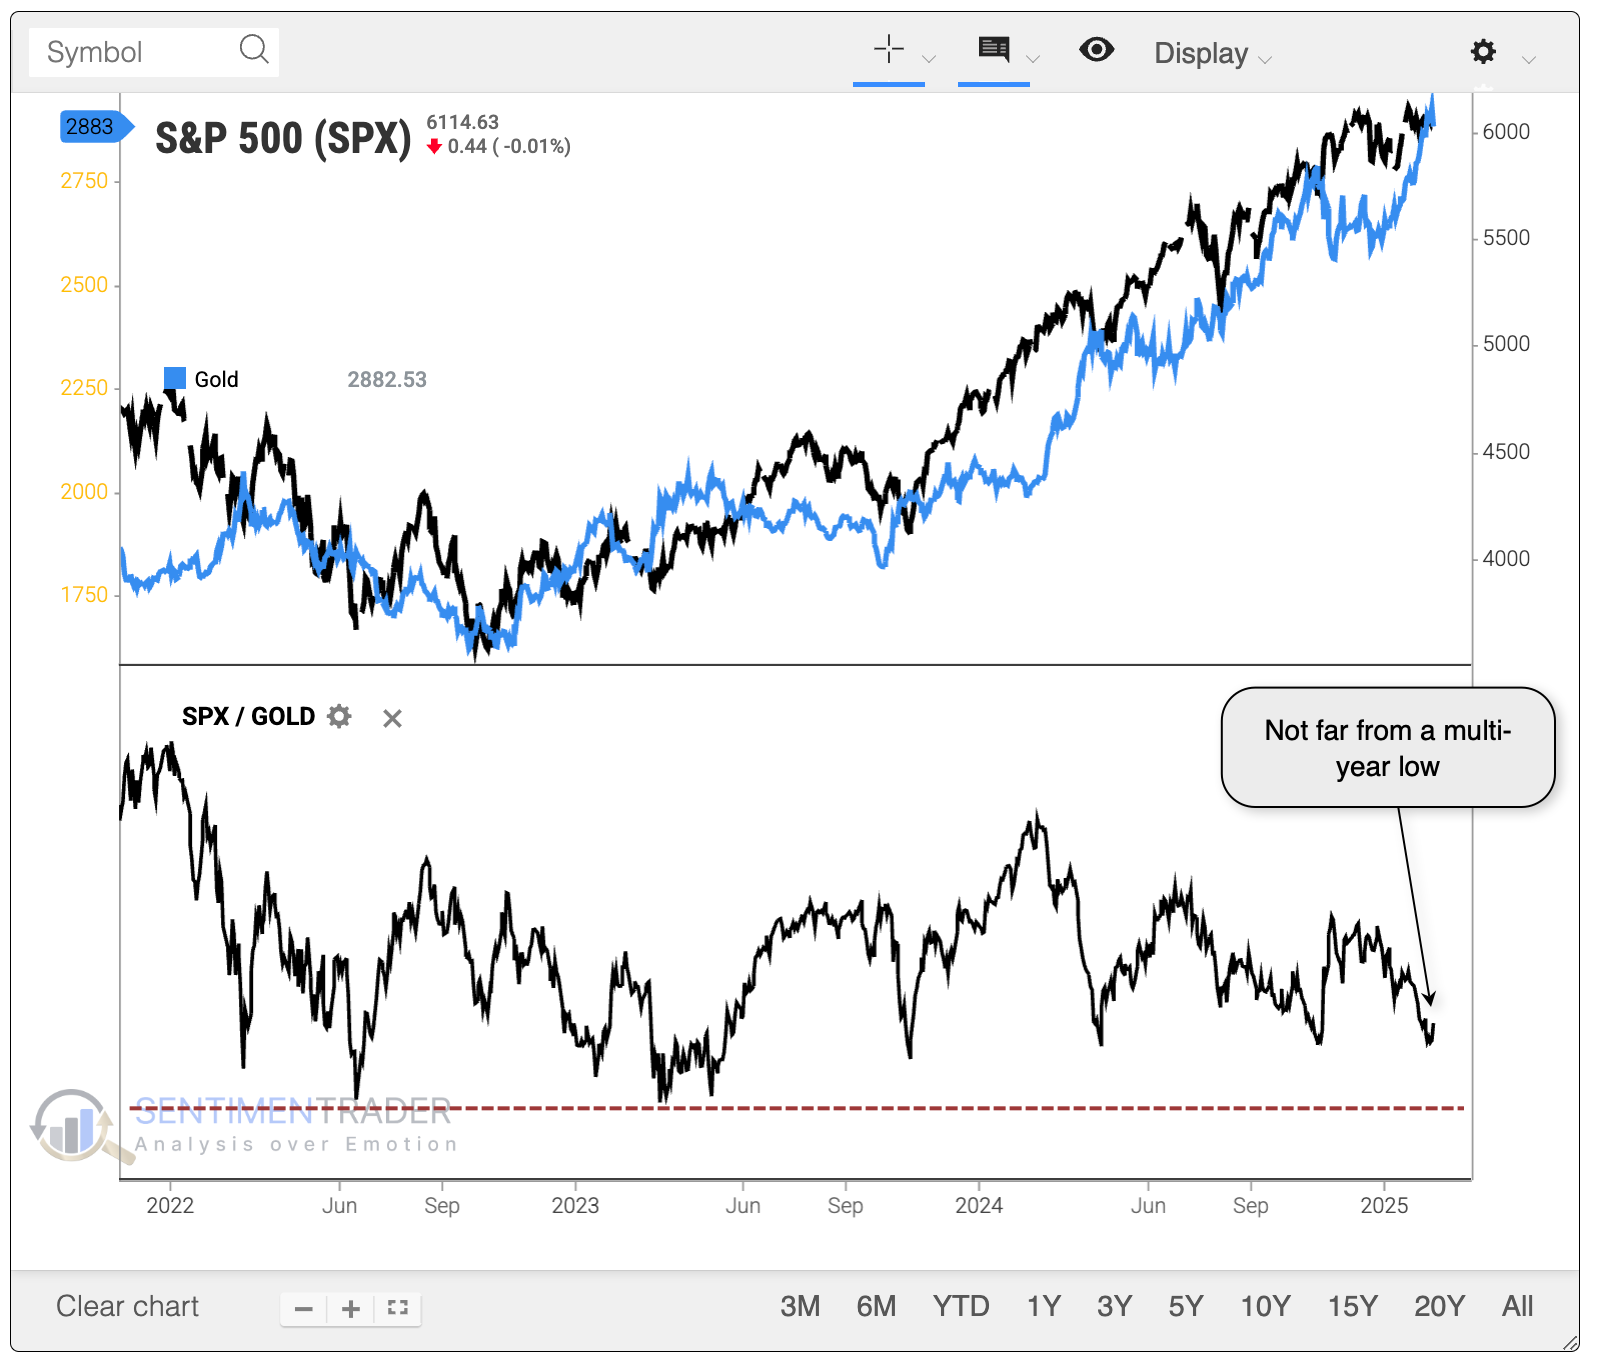
It wouldn't take much more of a decline in the former and/or rally in the latter to hit a multi-year low.
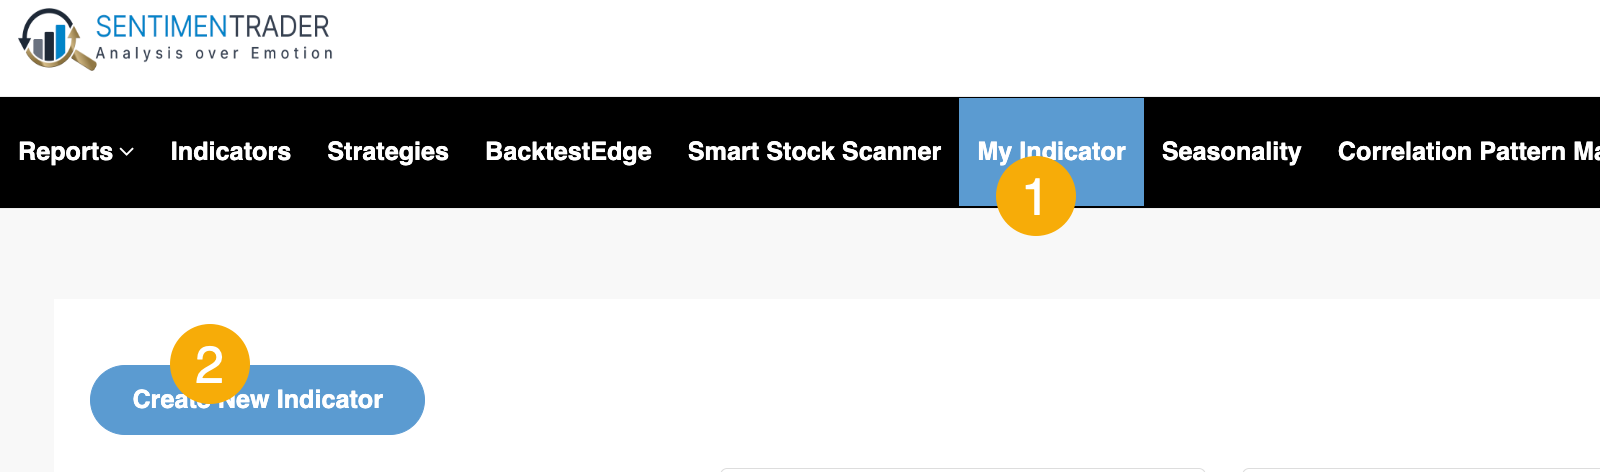
As a quick aside, you can quickly and easily monitor this ratio (or thousands of other combinations) by clicking 1) My Indicator and then 2) Create New Indicator.
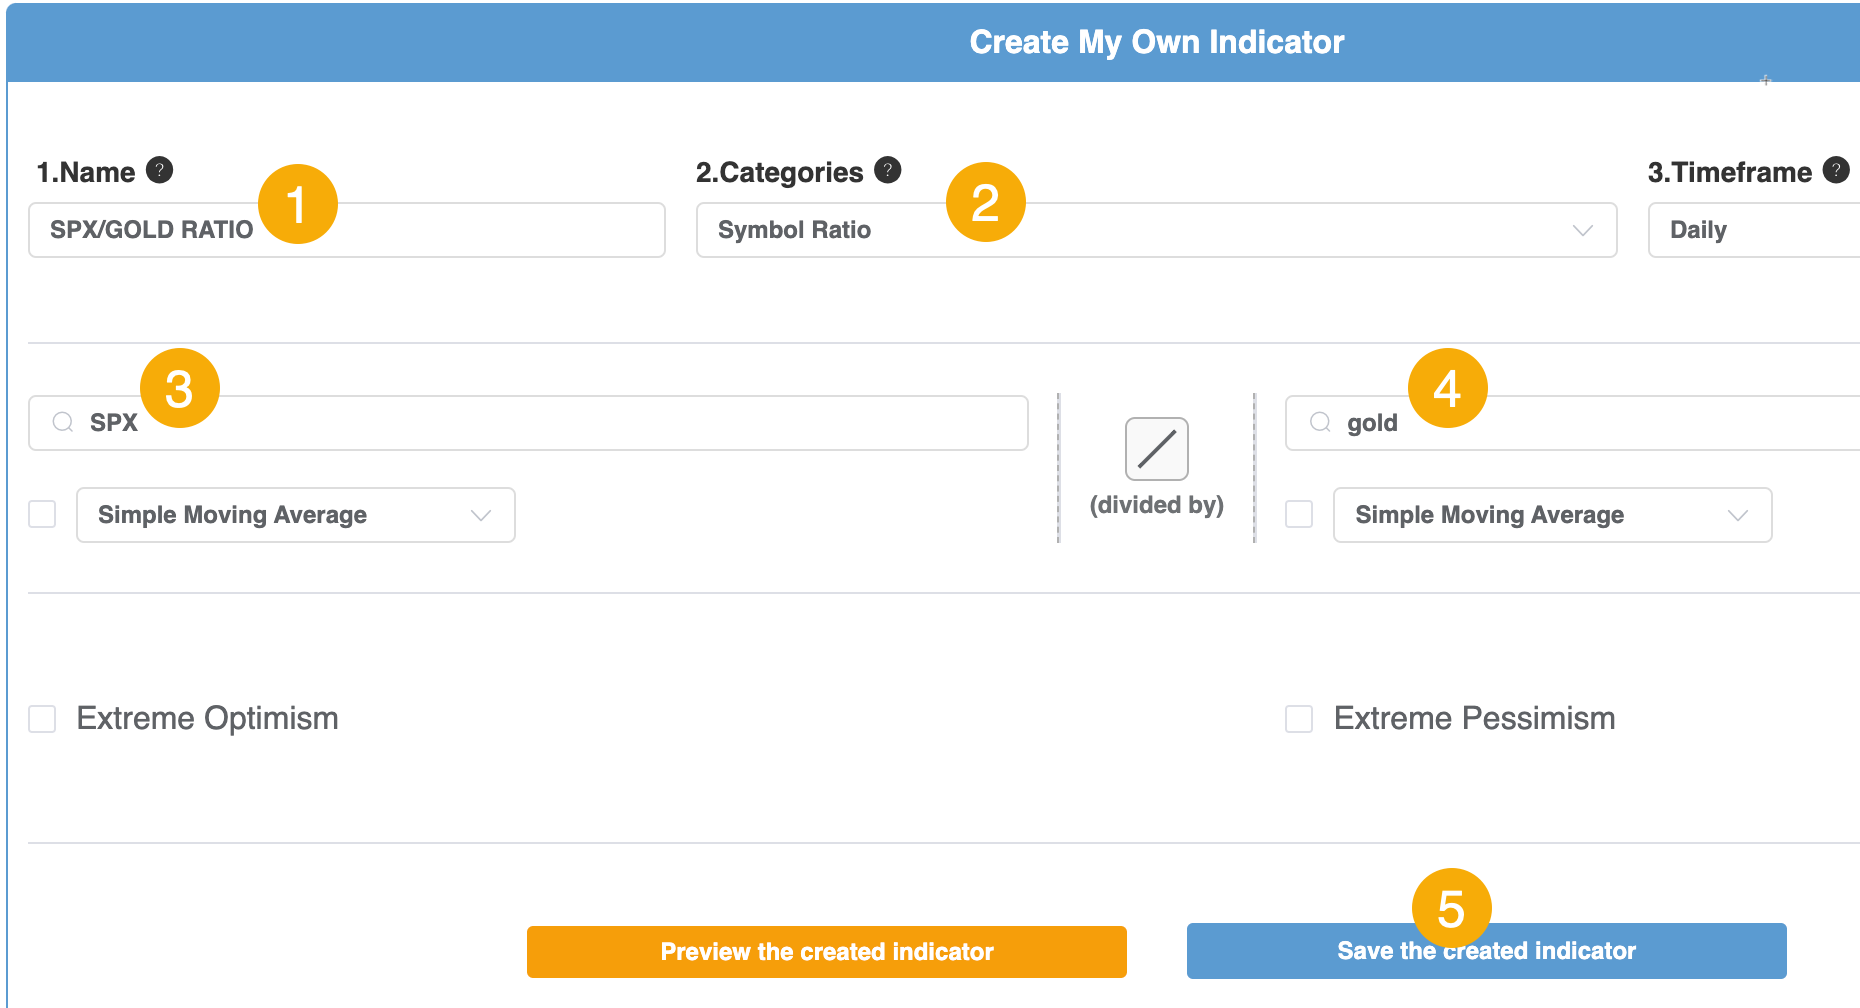
When the page opens, 1) Enter a name for your new indicator, 2) Select Symbol Ratio, 3) Type SPX in the first indicator box, followed by 4) Gold in the second, and 5) Click the Save the Created Indicator button.
A good time for mean reversion, for a while
After the ratio between the S&P and gold fell to within 0.5% of a 52-week low for the first time in months, it tended to snap back in the weeks and months ahead. However, the six- and twelve-month returns and consistency were negative, suggesting that gold continued to outpace stocks over longer time frames.
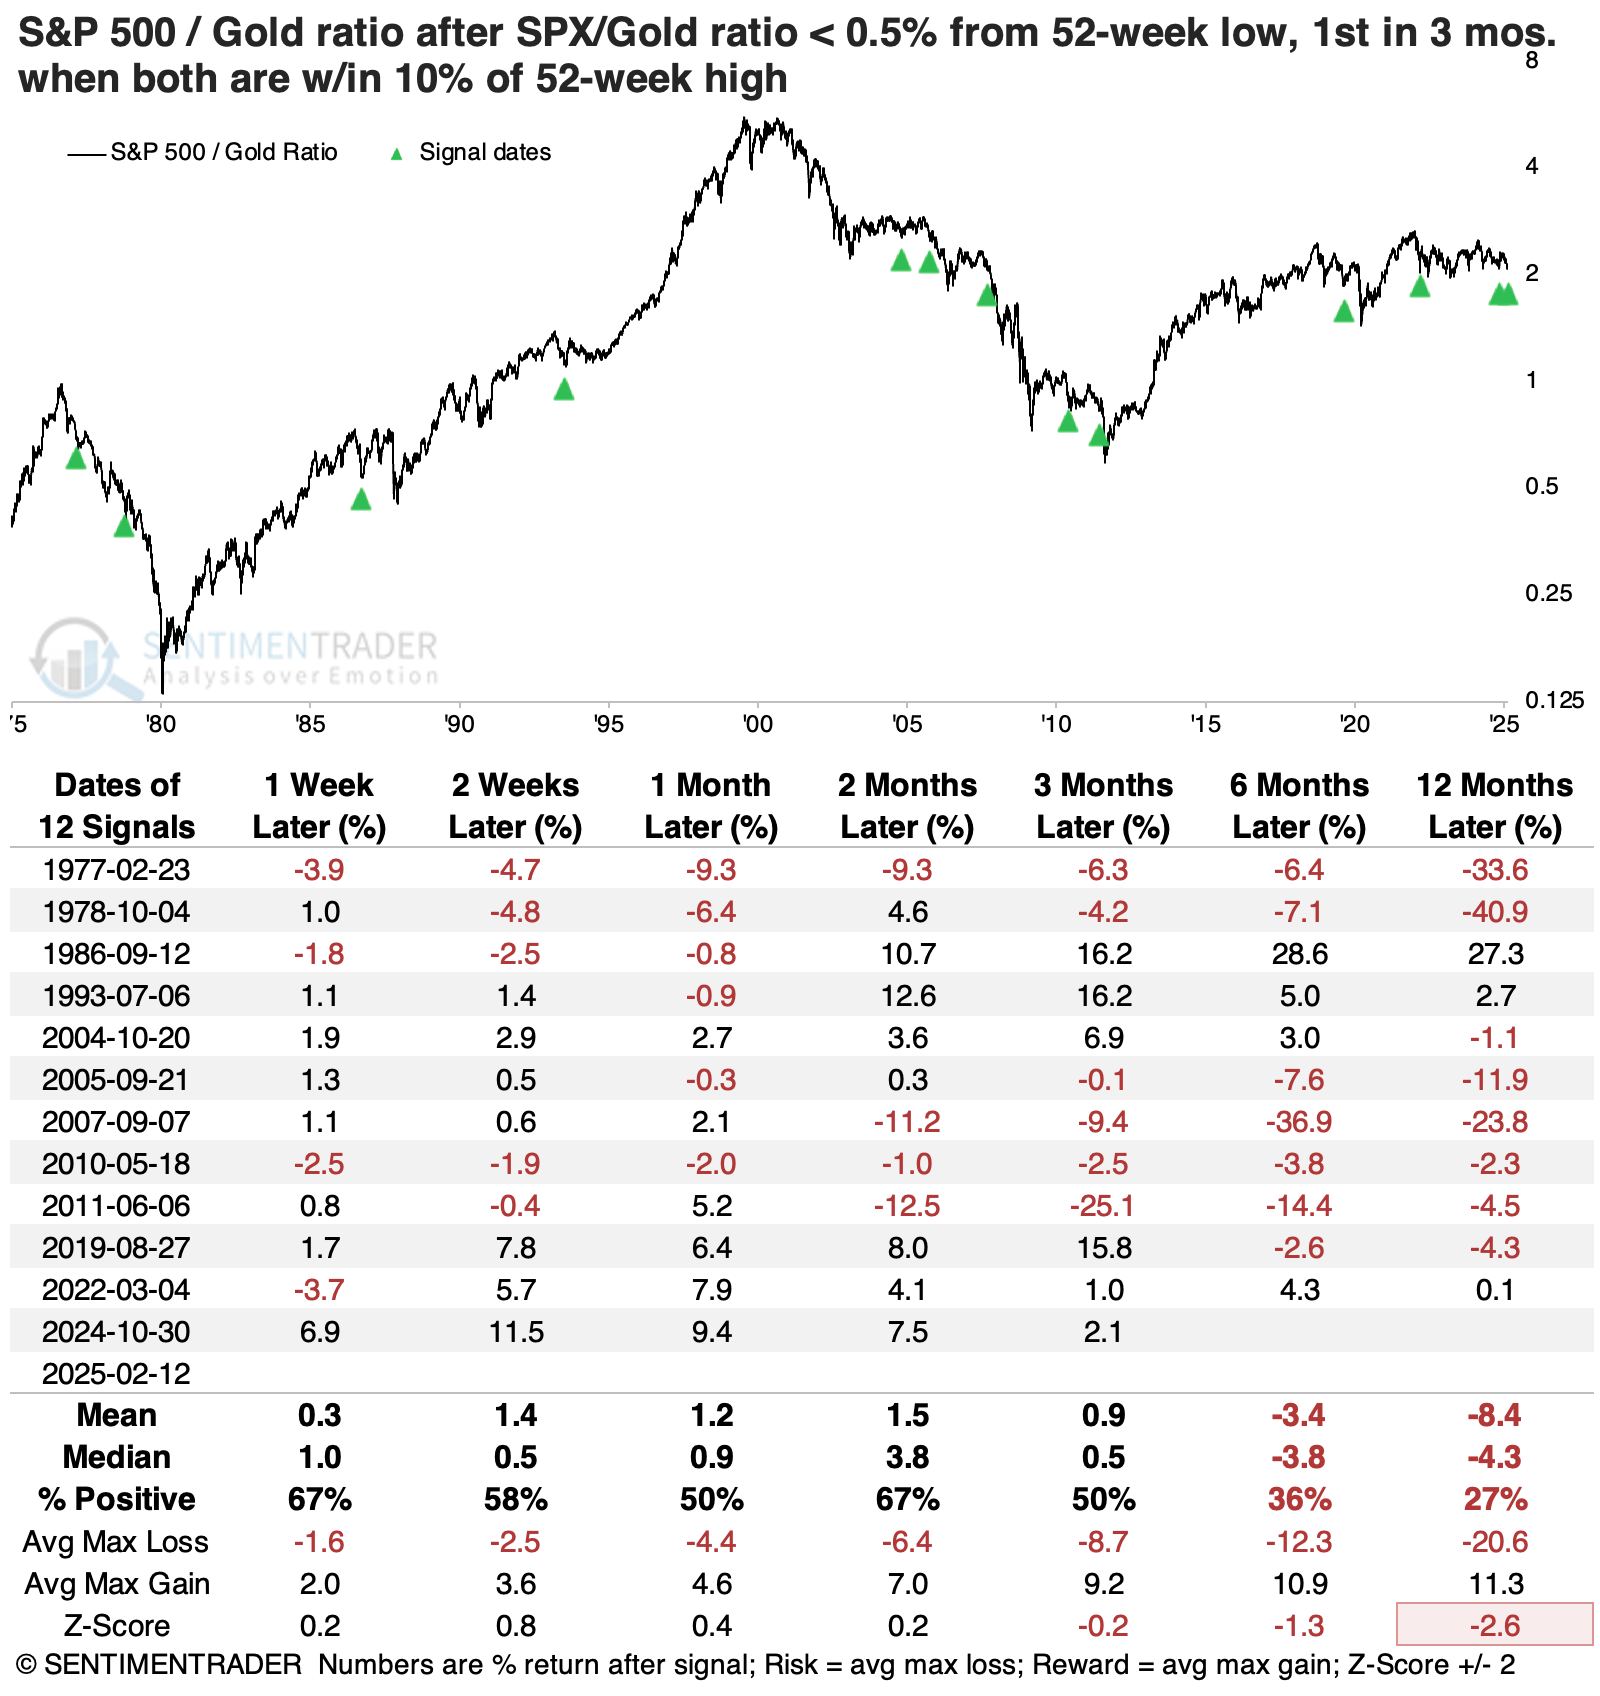
Typically, gold shines brighter than stocks because there is some flight to safety. Investors get nervous about a drop in stocks and flee to what is sometimes considered a safe haven in gold. Clearly, that isn't the case now because both assets are within 10% of their highs.
The table below filters the instances above to only include those signals when both were within that threshold. Again, stocks tended to snap back more in the shorter term, but gold did better in the longer term. Of the twelve signals, only one showed a substantial gain in the S&P relative to gold over the next year.
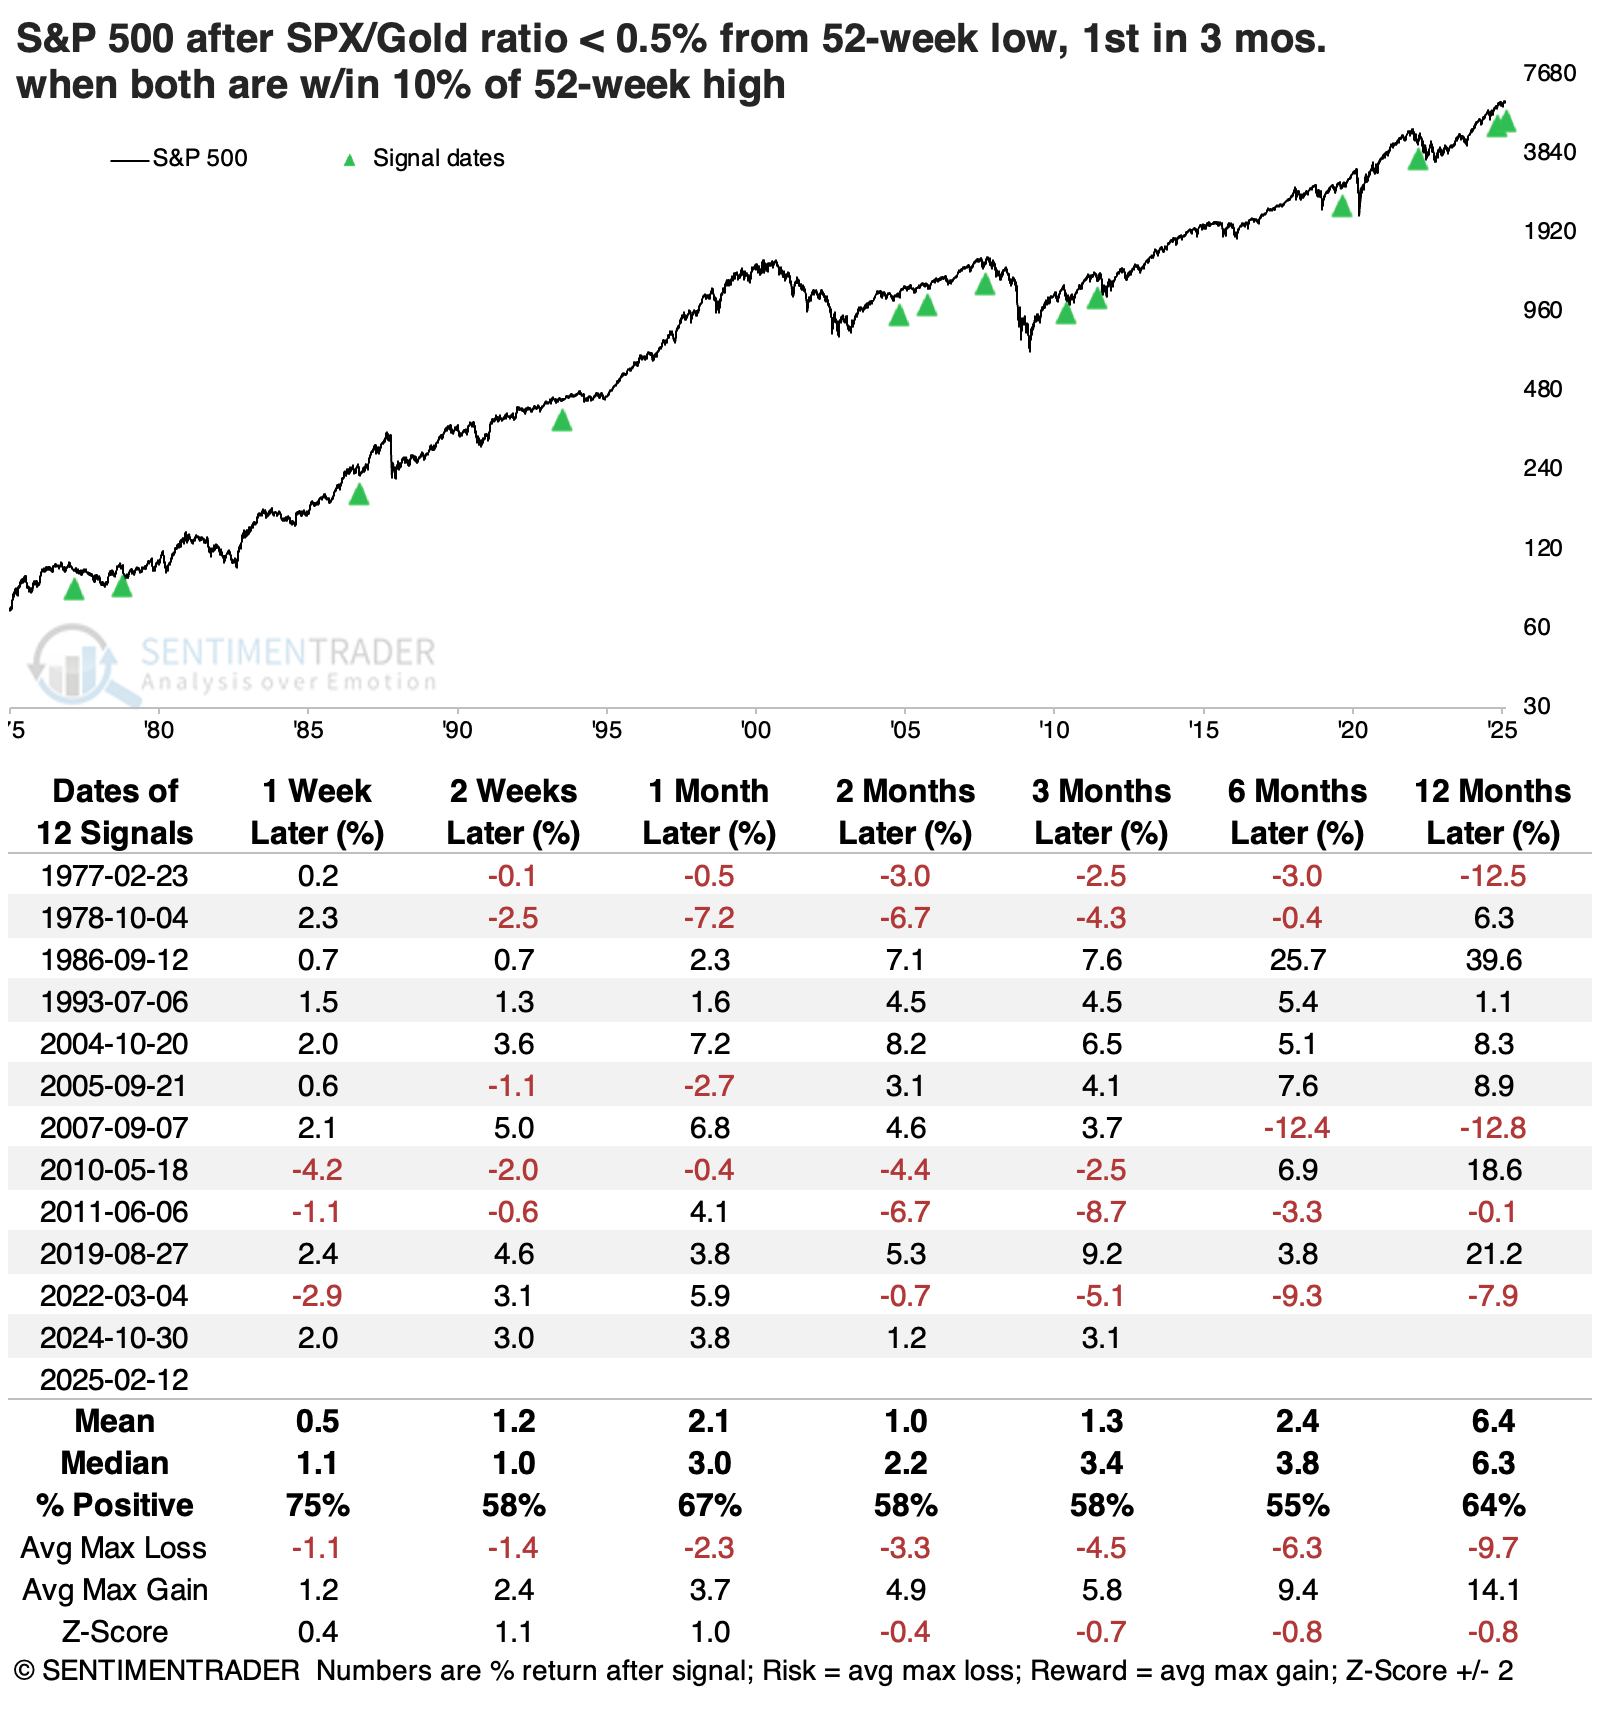
Below, the S&P 500's absolute returns were pretty good in the weeks ahead, with only one substantial loss in the following month. After that, its returns were below average, with only one double-digit rally six months later.
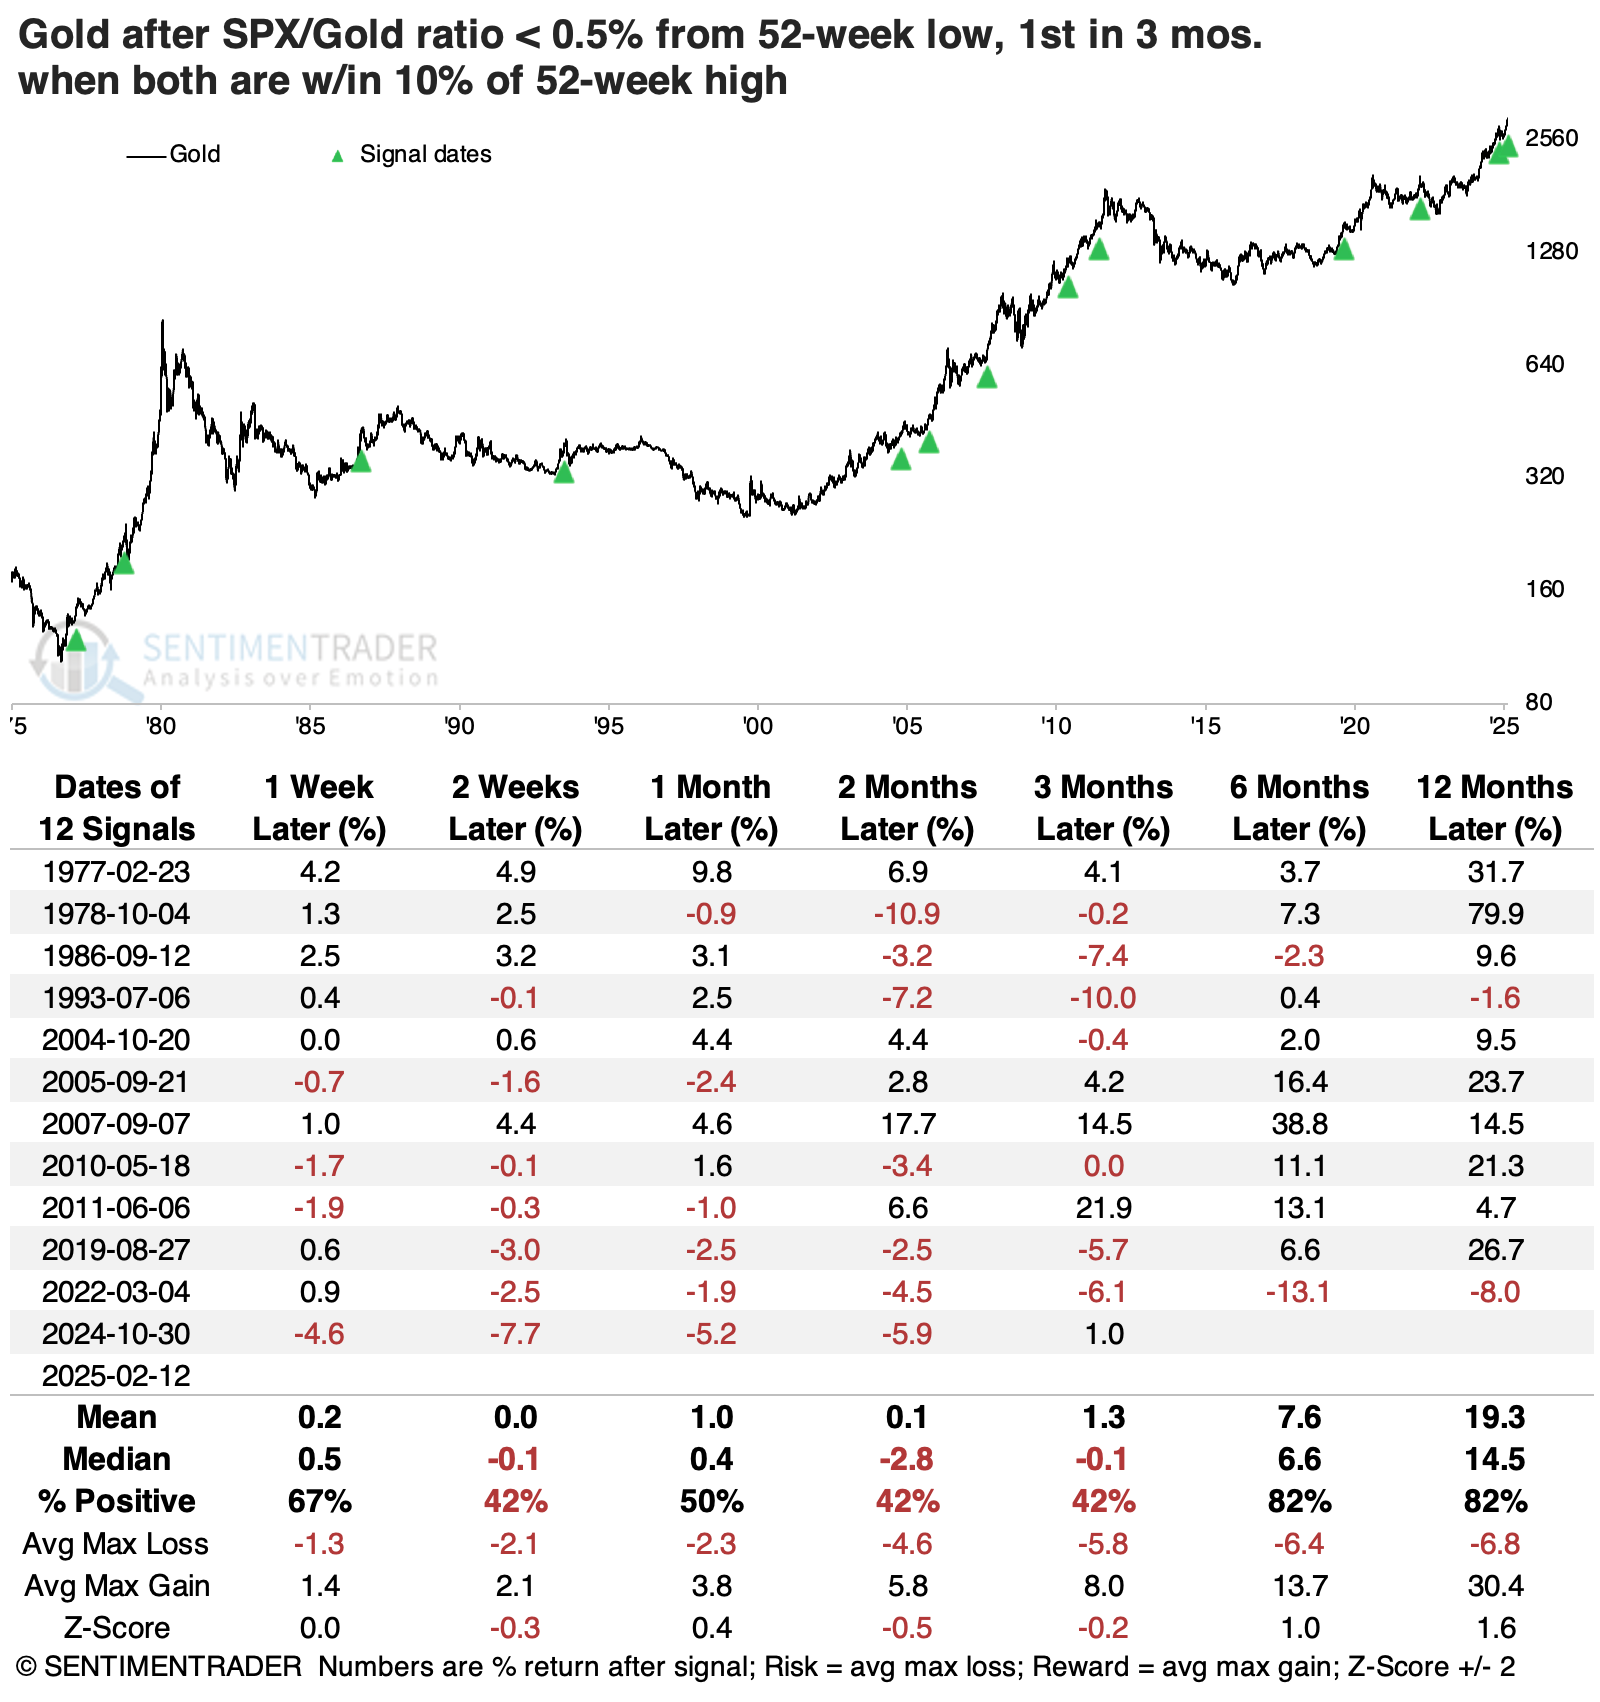
Gold tended to see profit-taking behavior in the weeks and months following these signals. Only twice did it see substantial gains over the next three months. But these signals tended to cluster during secular bull markets for the metal, and over the next 6-12 months, its returns were quite good, with the 2022 signal being the only one with losses over both of those time frames.
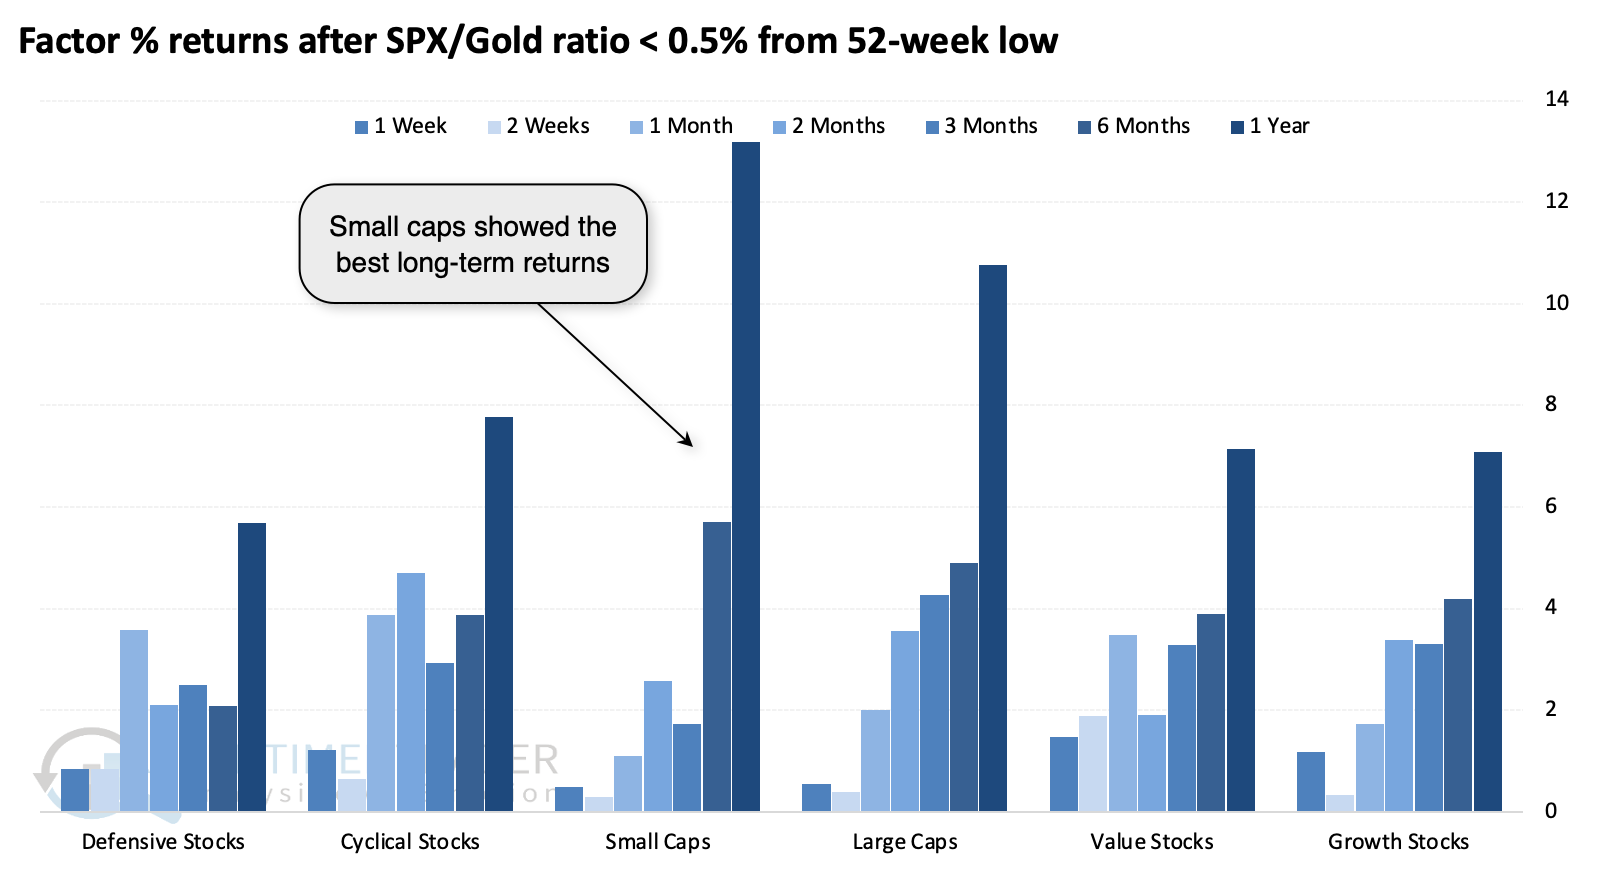
Among other factors, small-cap stocks enjoyed the largest median returns following these declines in the S&P 500 to gold ratio.
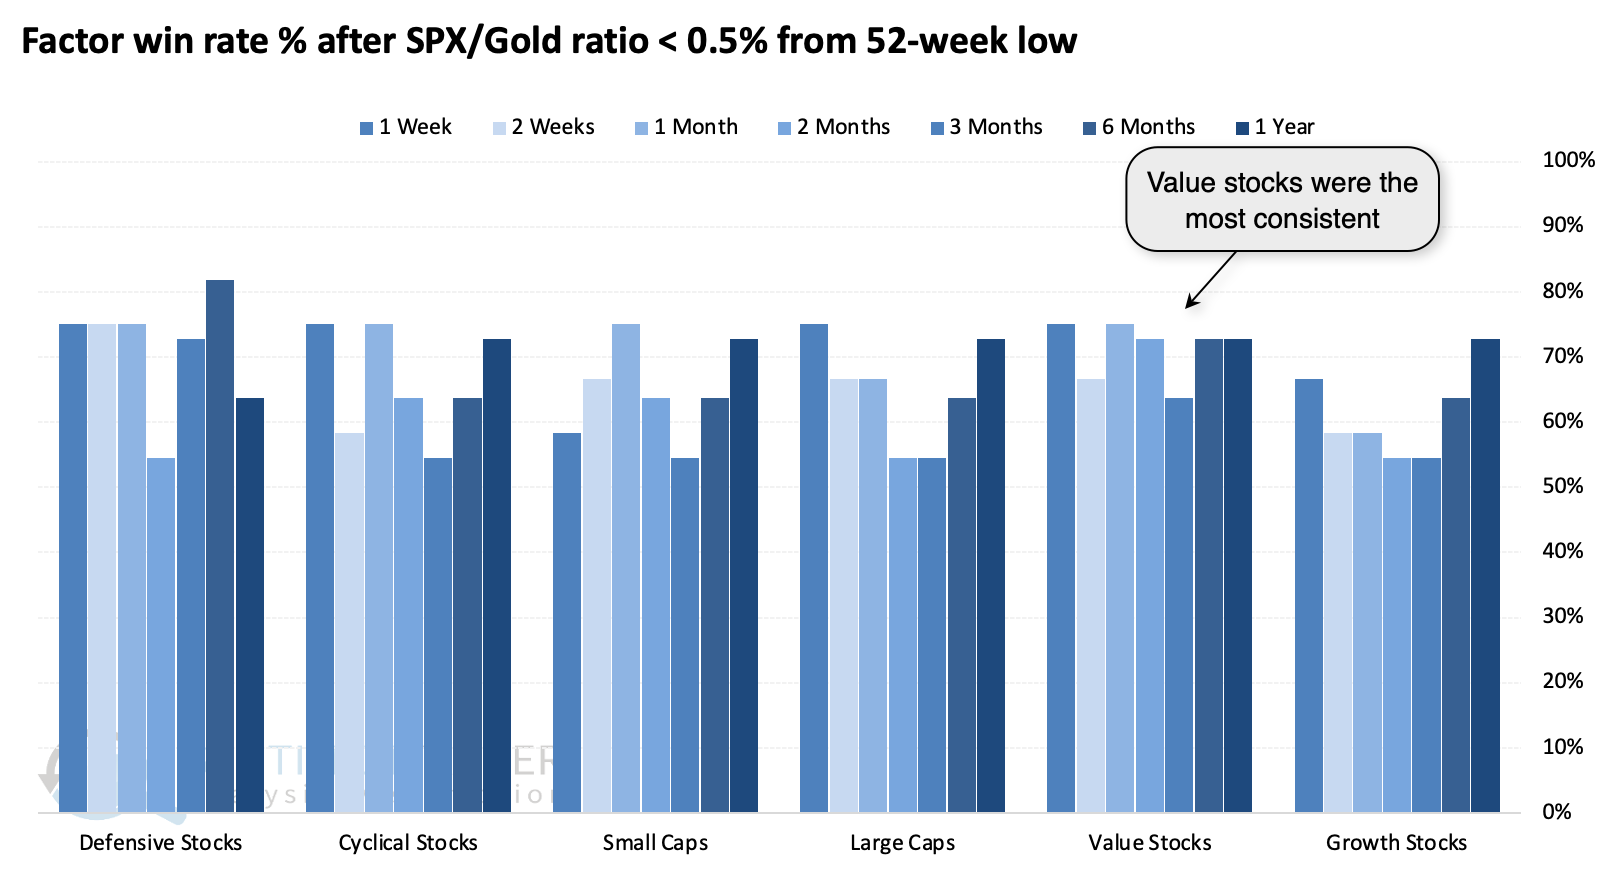
While they didn't enjoy the most significant returns, value stocks were the most consistently positive.
What the research tells us...
It's been a good year already for most investors, whether they're invested in stocks, bonds, or commodities. Investors tend to be squirrely whenever something like gold does so well, thinking something isn't quite right. If investors were so confident, why would they bid up the price of gold?
These anxieties proved prescient a few times, but they weren't consistent enough to consider them a warning sign for stock investors, especially in shorter time frames. Over the next several months, stocks tended to rebound against gold. However, that raises the risk of overconfidence because over the next six to twelve months, gold actually outperformed stocks most of the time.