Products
SentimenTrader Trading Tools
‍
Backtest Engine
My Trading Toolkit
Correlation Analysis
Seasonality
Market Prediction
Indicators & Data API
‍
Proprietary Indicators & Charts
Market Data API
Strategies & Scanner
‍
50+ Trading Strategies
Smart Stock Scanner
Smart Option Scanner
Research Reports
‍
Research Solutions
Reports Library
Free Resources
Simple Backtest Calculator
Simple Seasonality Calculator
The Kelly Criterion Calculator
Sentiment Geo Map
Public Research Reports
Education
Sentiment Indicators
Technical Indicators
Pricing
Company
About
In the News
Testimonials
Client Success Stories
Contact
Log inLoginSign up
< BACK TO ALL REPORTS

The S&P 500 reclaims its most important level

Jason Goepfert
2025-03-26
The most benchmarked equity index in the world popped back above the most-watched technical indicator in the world. The S&P 500 reclaimed its 200-day average after two weeks below it. Following long stretches above its average, these brief violations have often shown cracks in the trend, and would be worrisome if bulls don't follow though.

Key points:

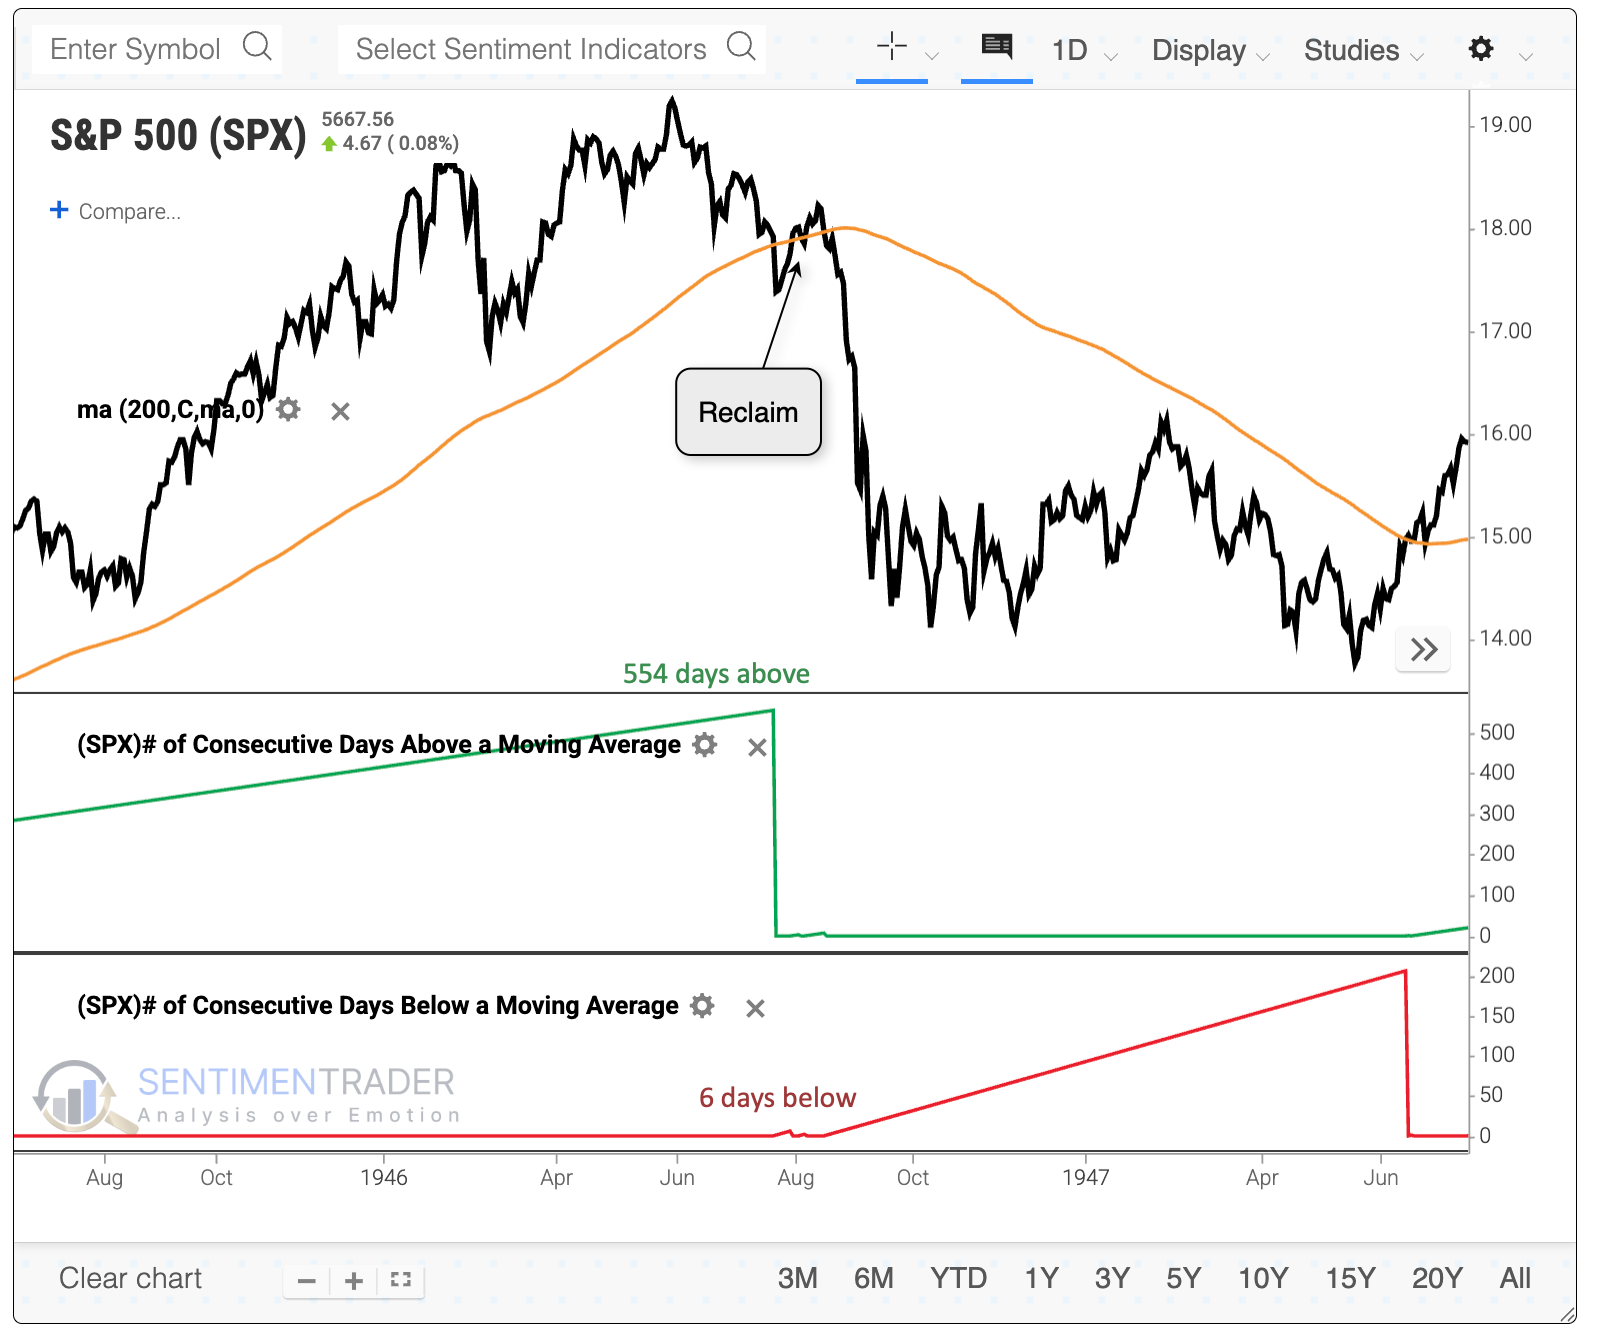
  • The S&P 500 went more than a year above its 200-day average and just reclaimed it after two weeks below
  • The index shows much better performance when above average than below, so this should be a good thing
  • Ironically, brief stints below average after long bull markets have shown vulnerabilities that often morphed into deeper trouble

Just a short stint below average

Since the S&P 500 fell into a correction, its path has mostly followed the "good" precedents that didn't fall into bear markets. It's also good that there was evidence of deep pessimism and a rush back into stocks with overwhelming force.

The rally early this week allowed the S&P to reclaim its widely watched 200-day moving average, as well. Nothing but good things there, as the index's annualized return is astronomically better when above its average than when below.

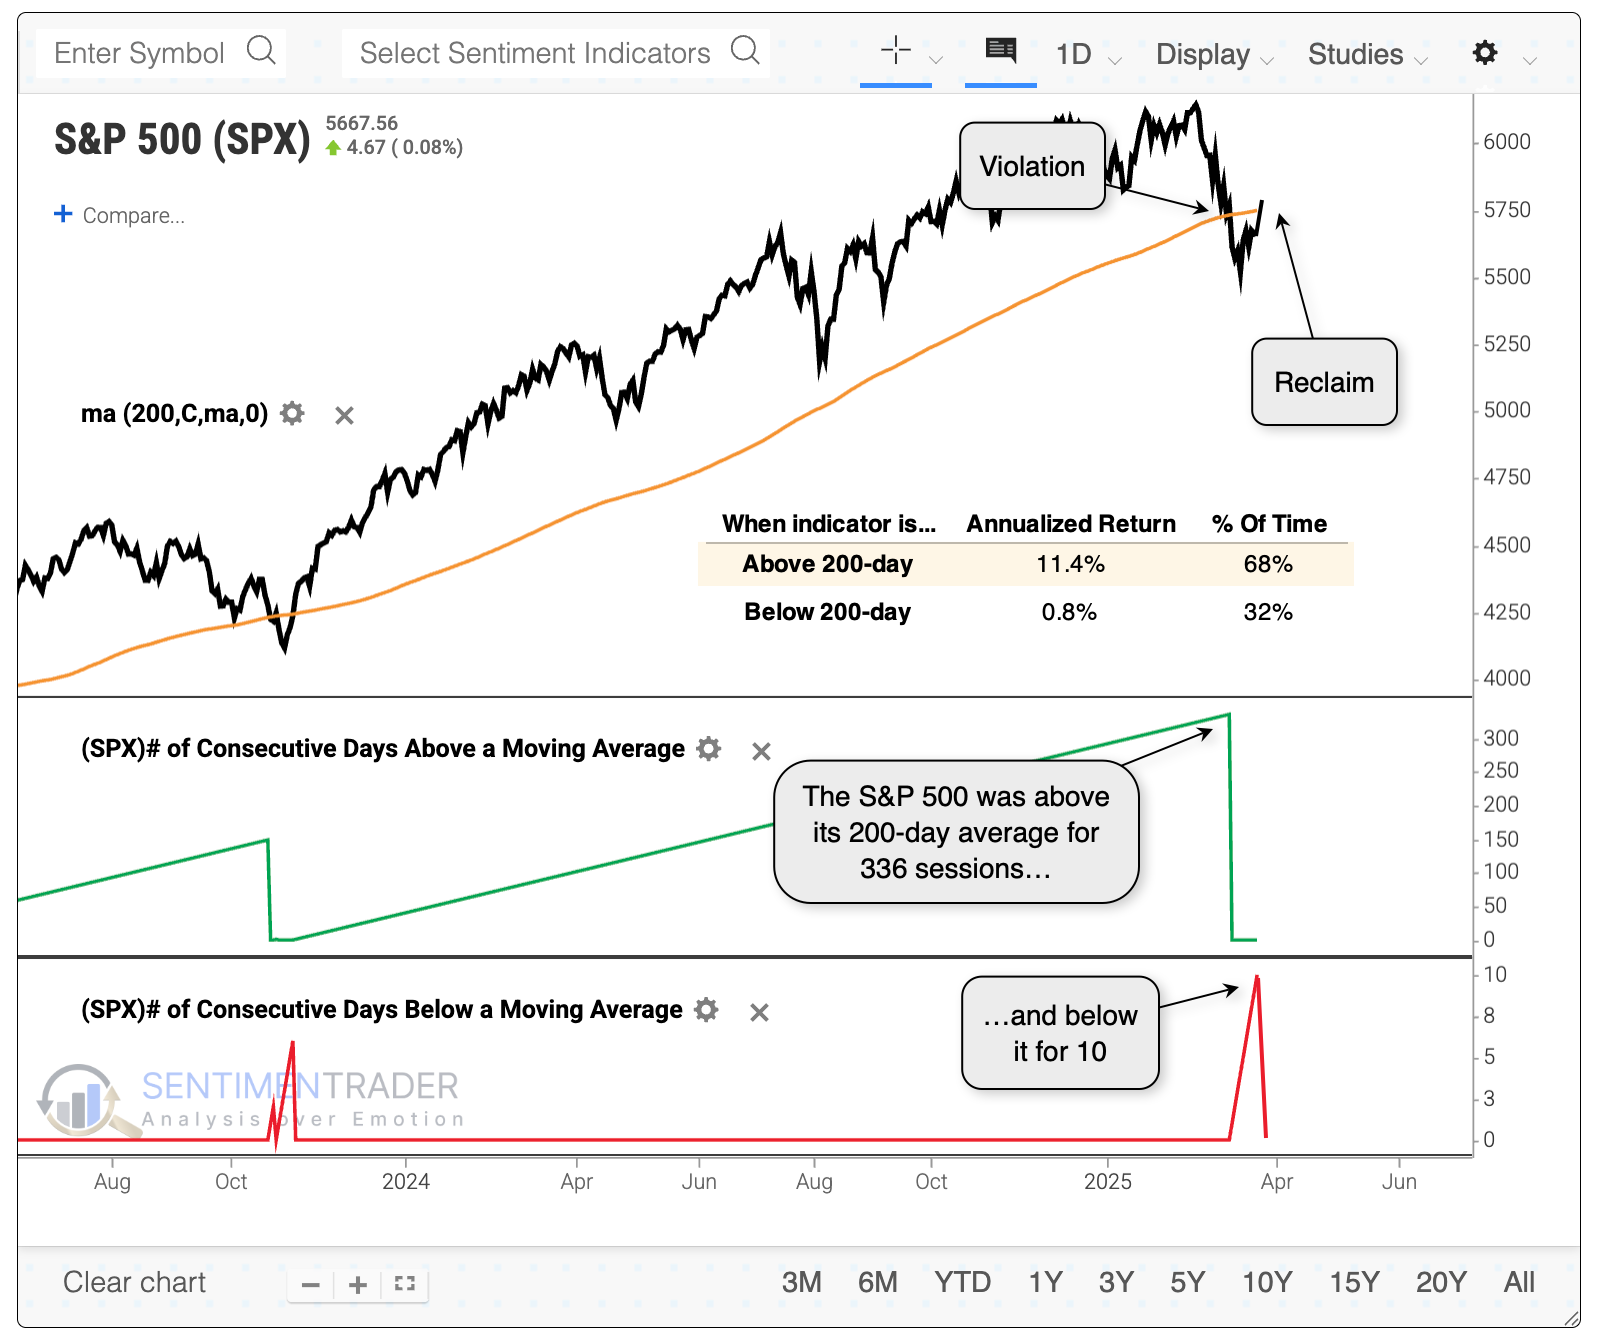
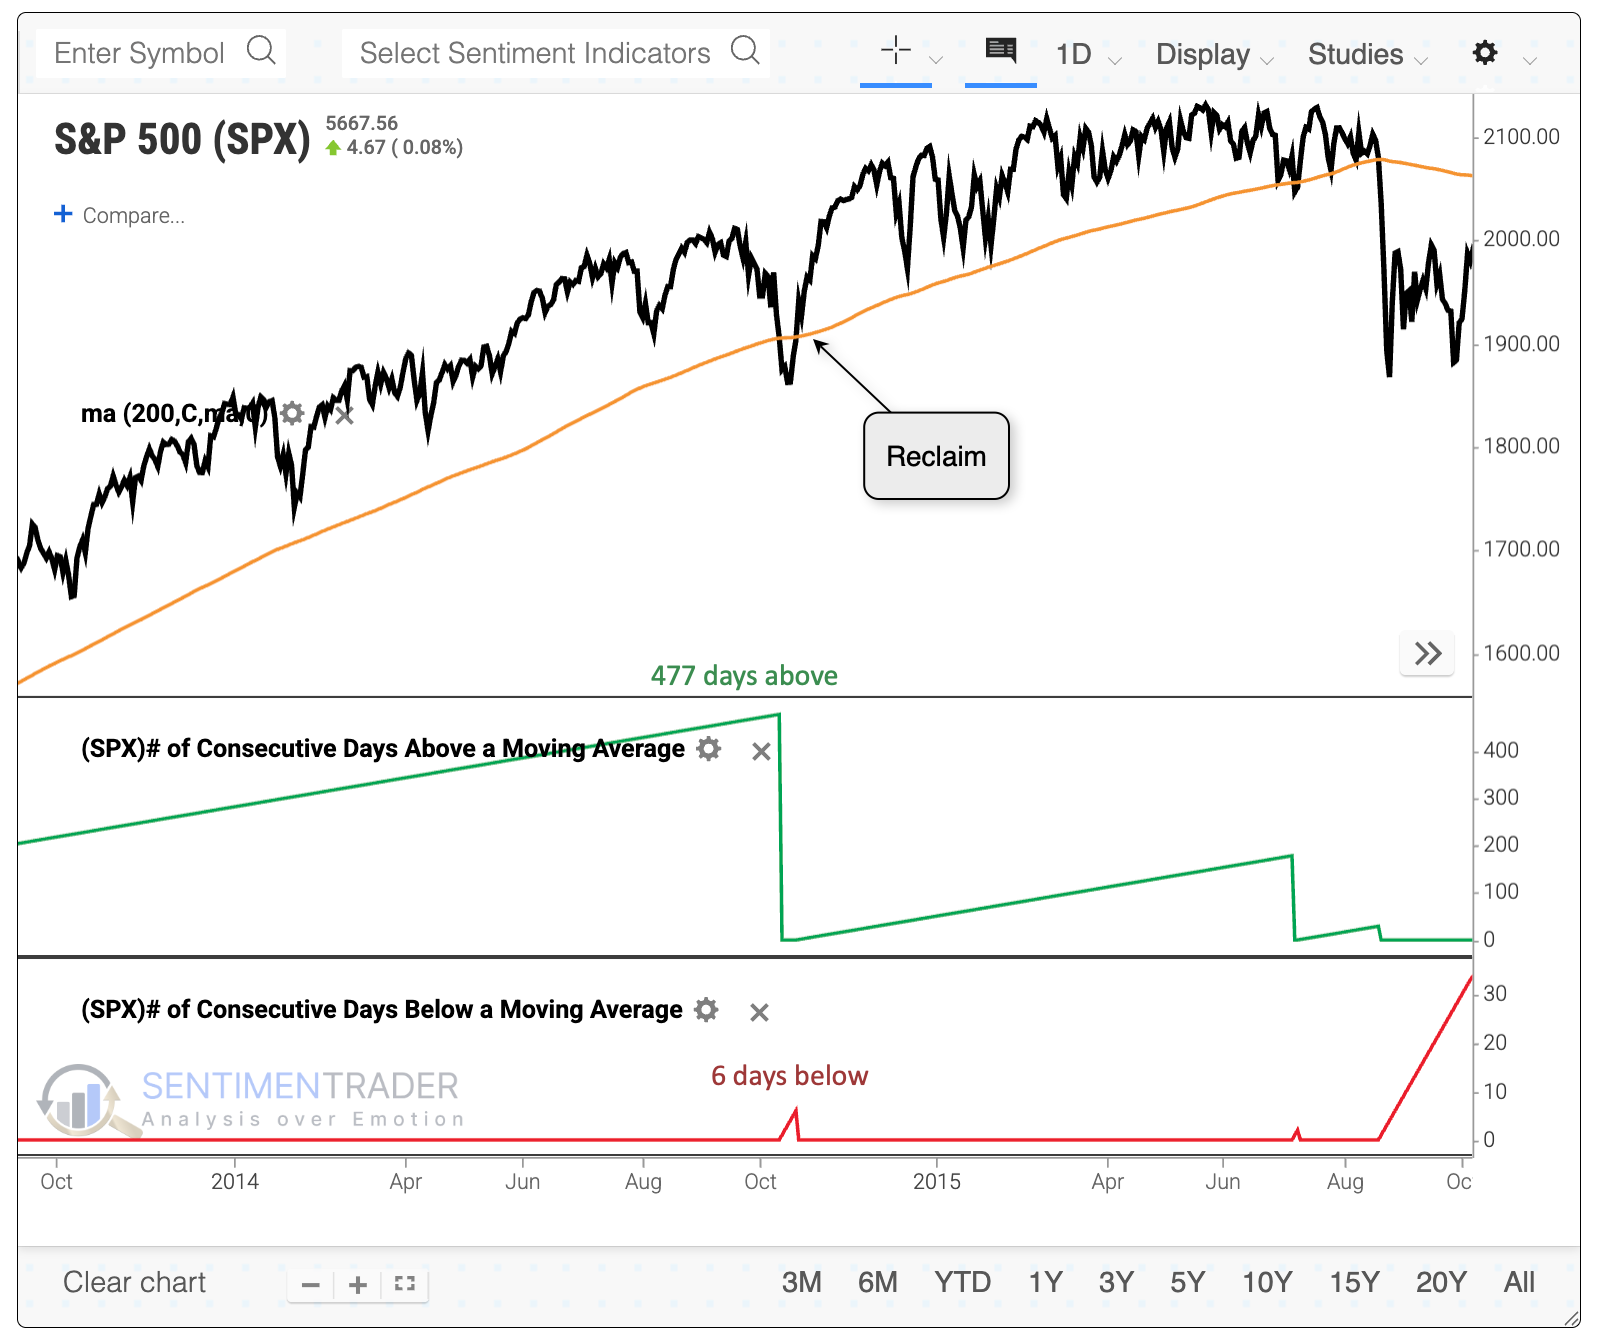
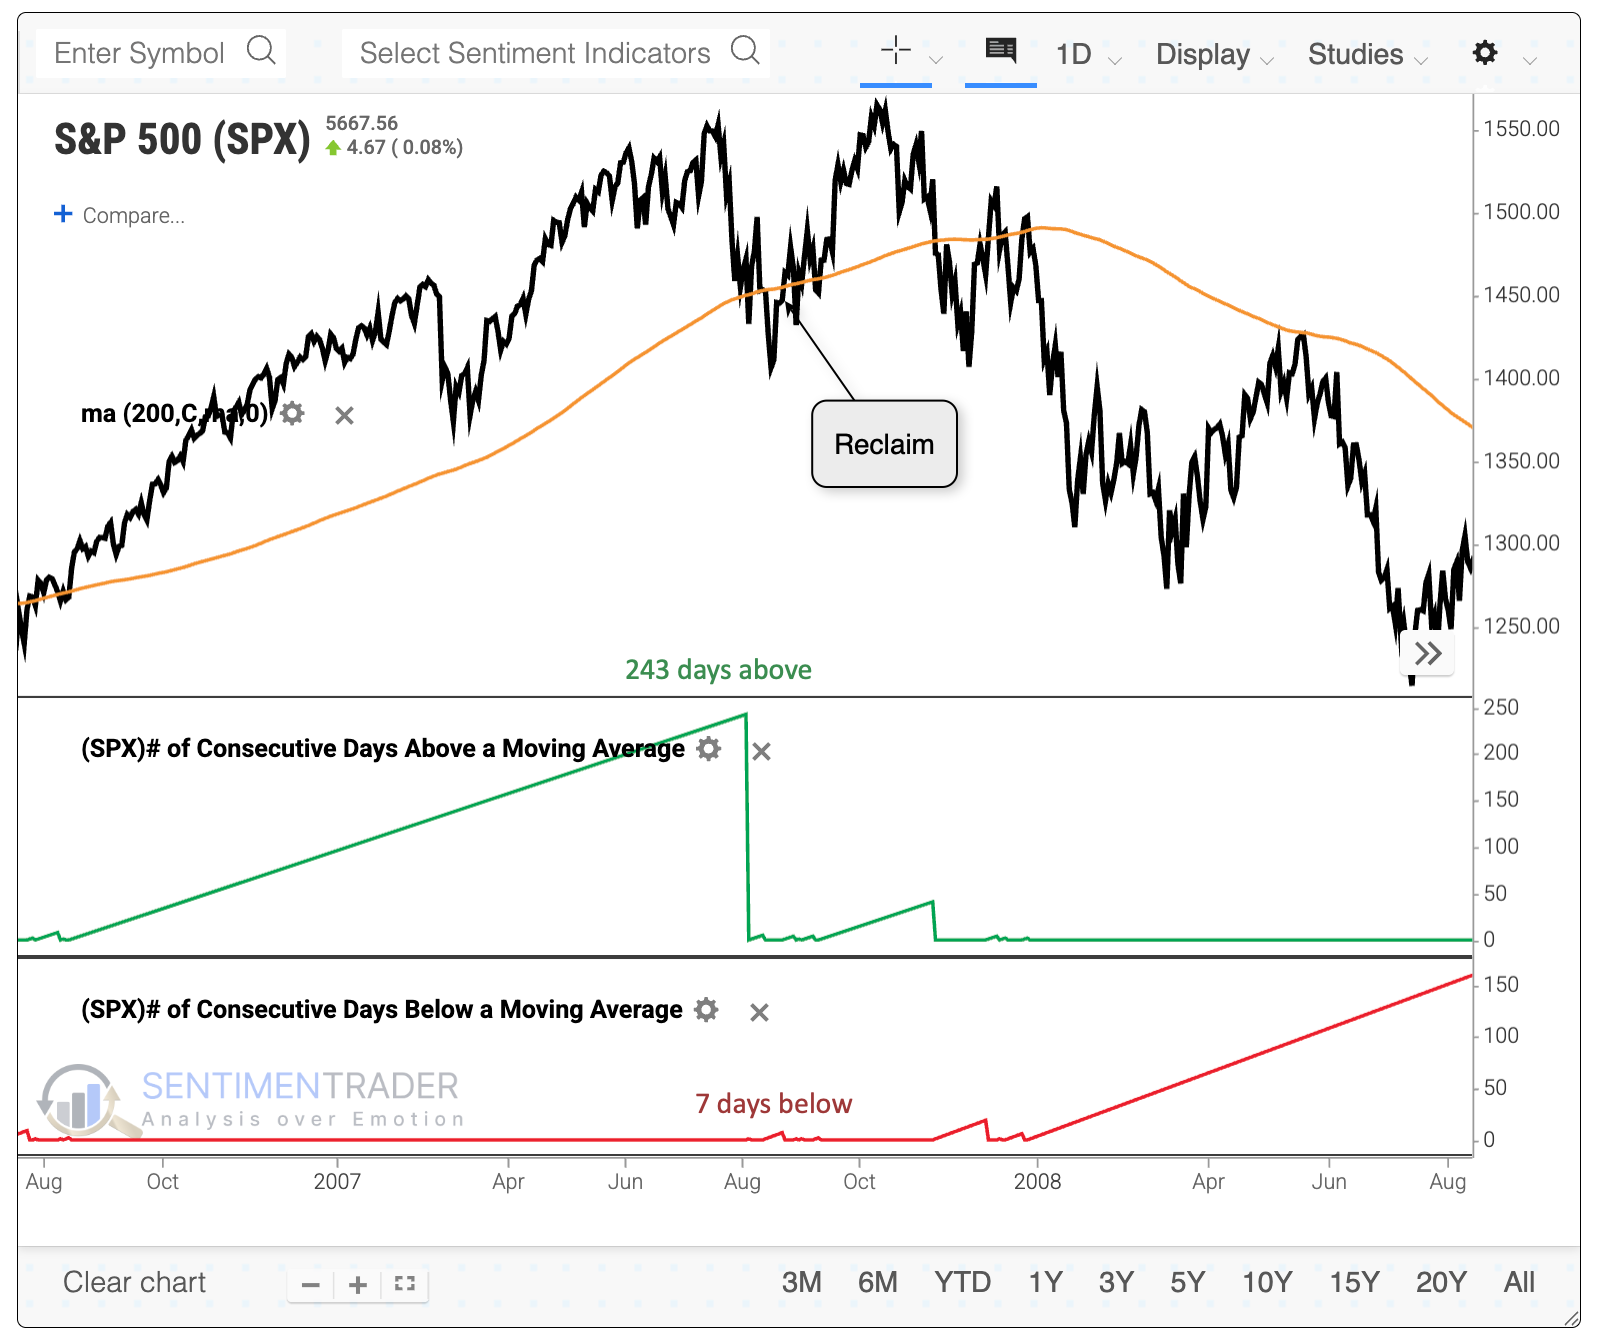
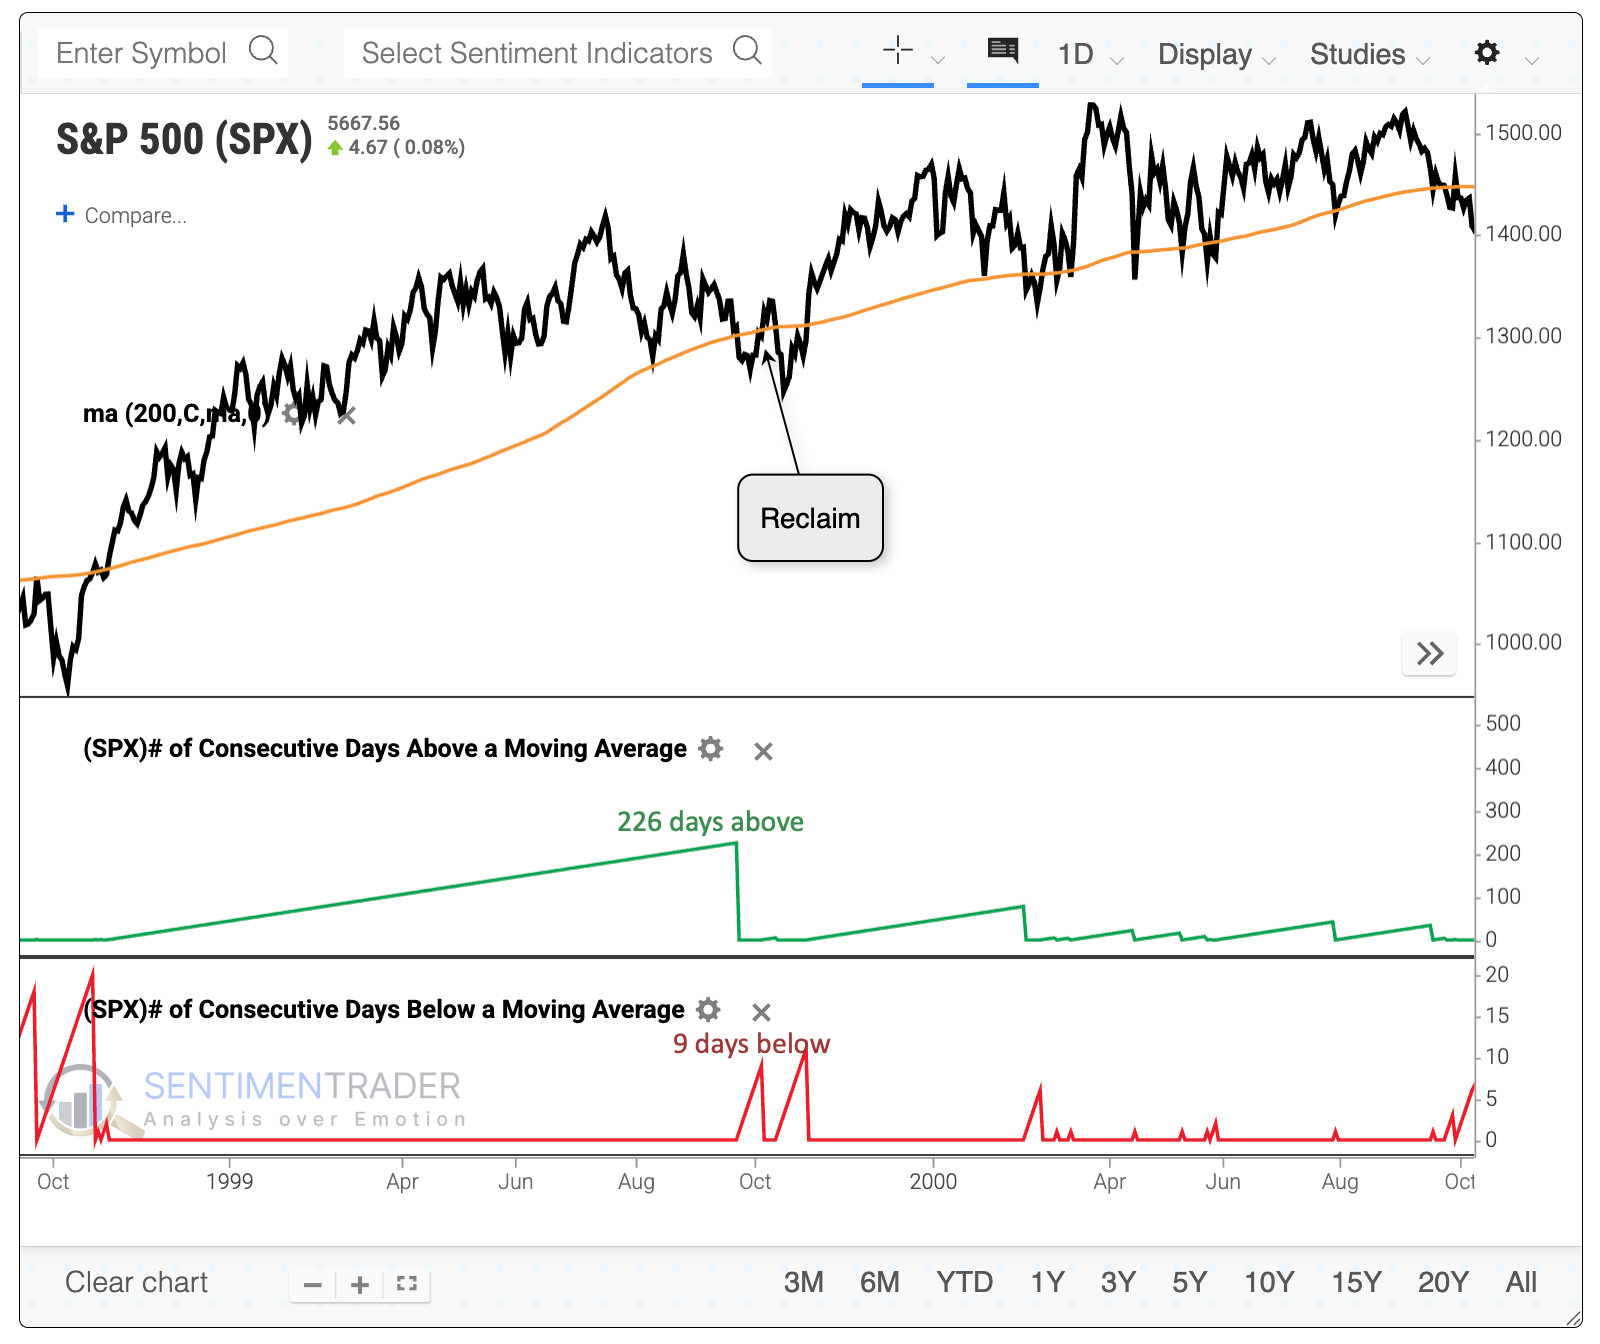
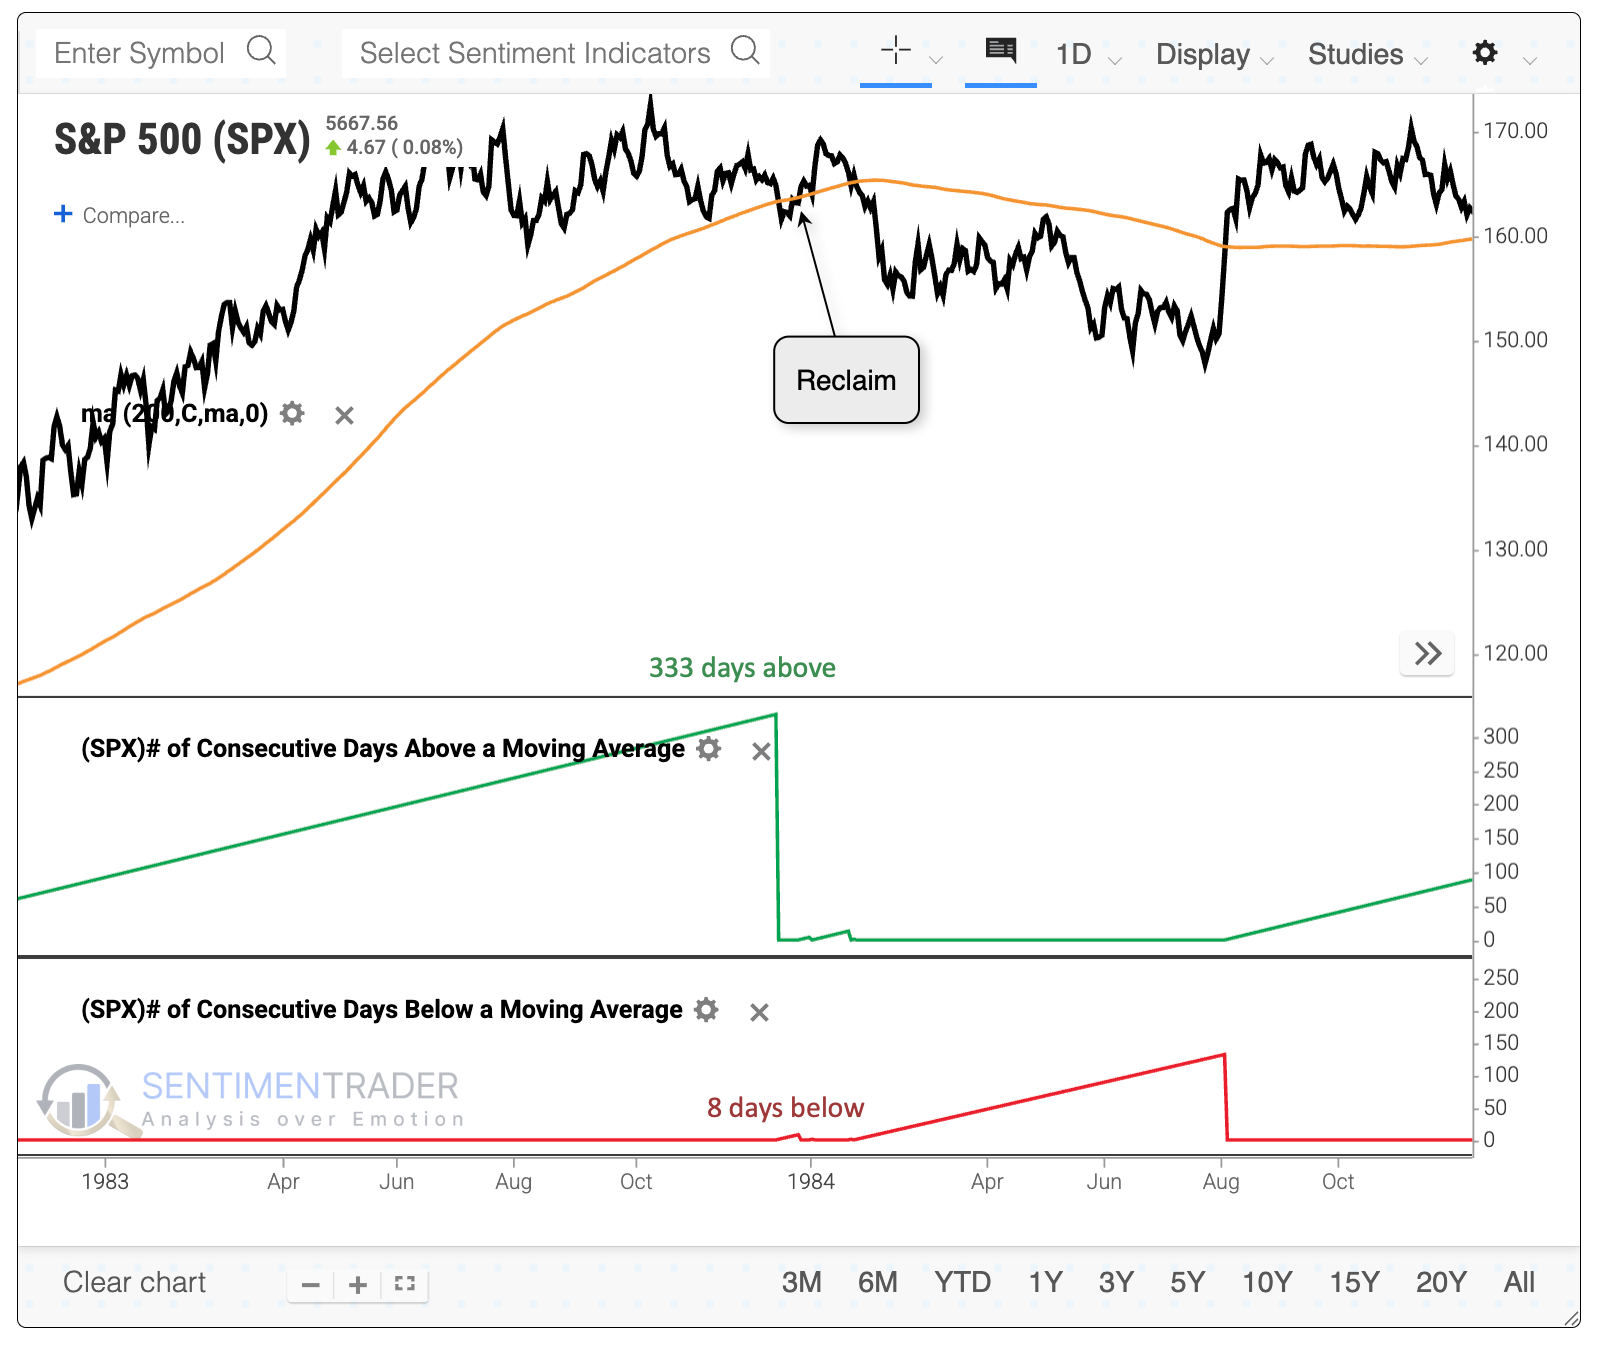
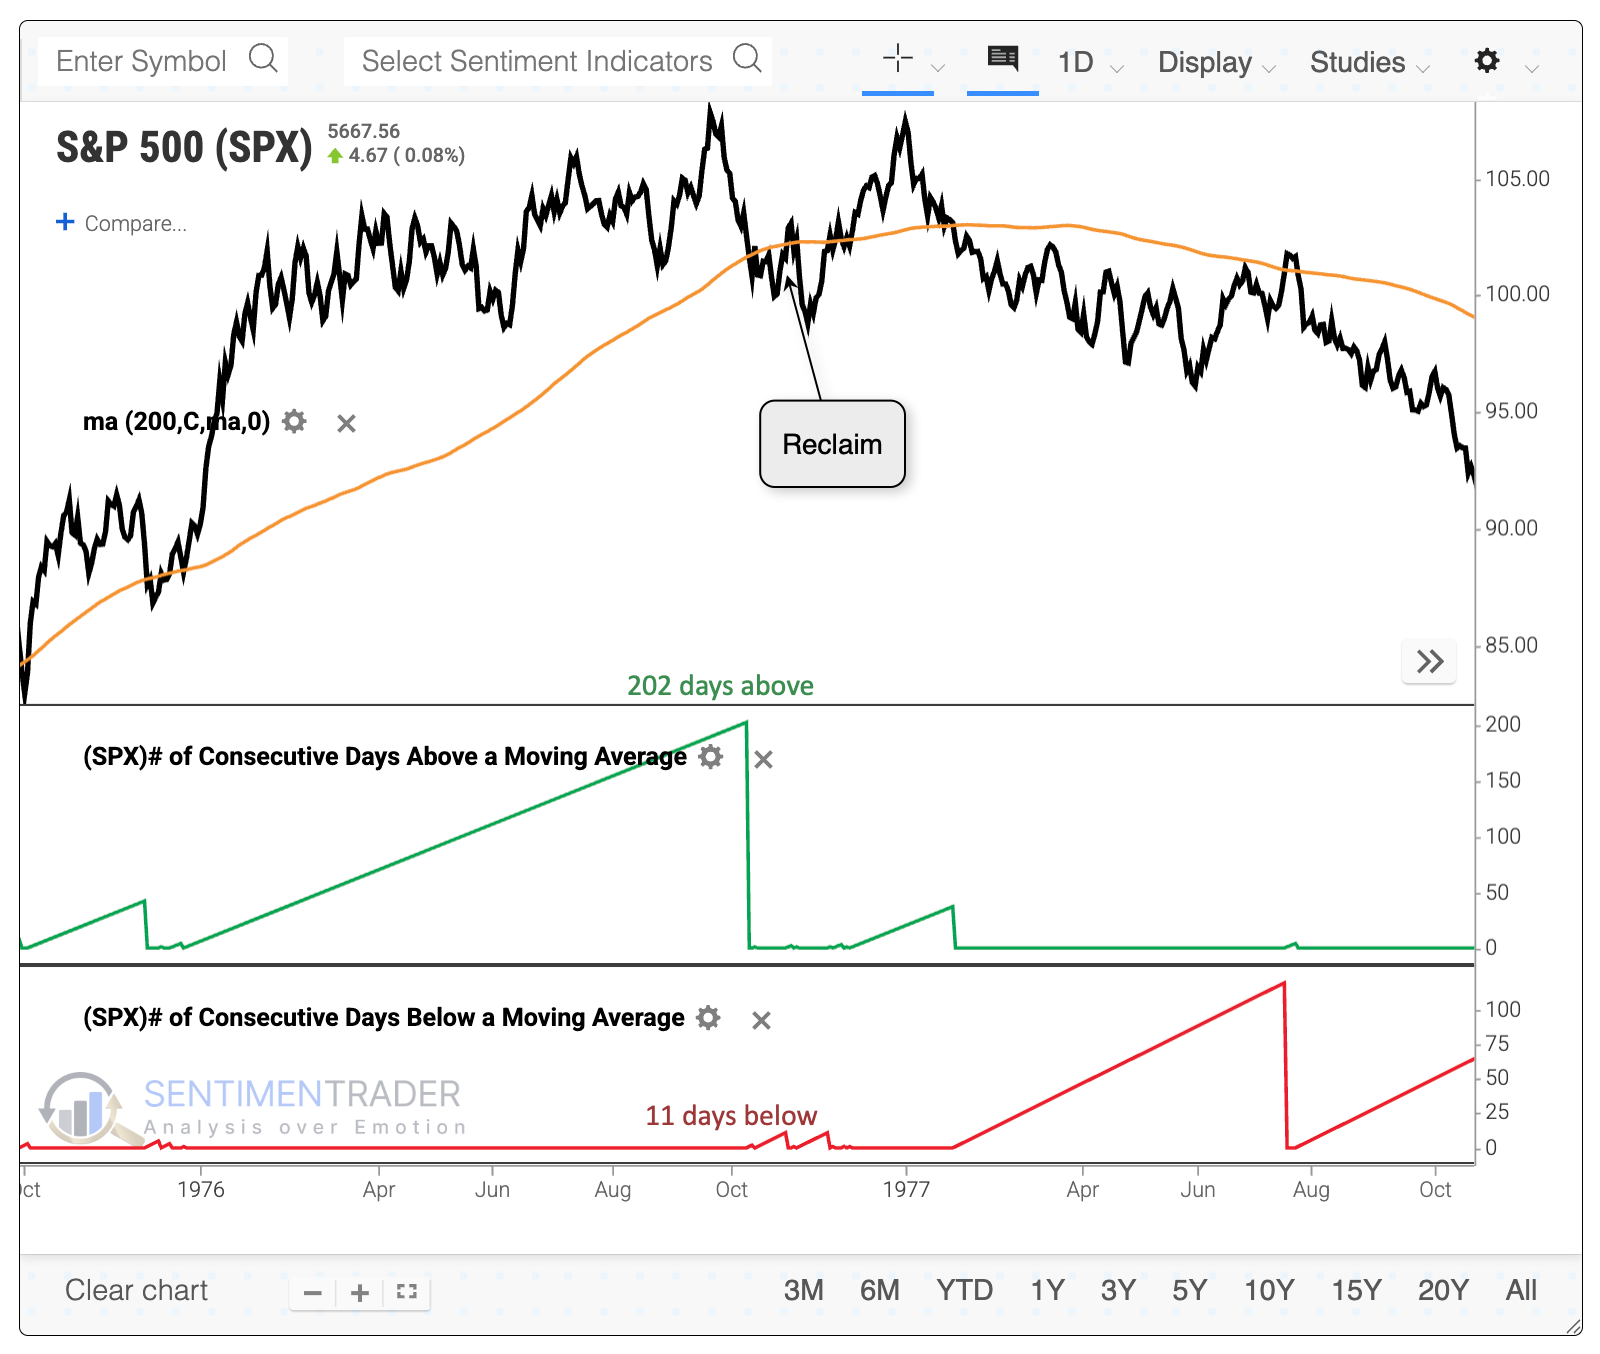
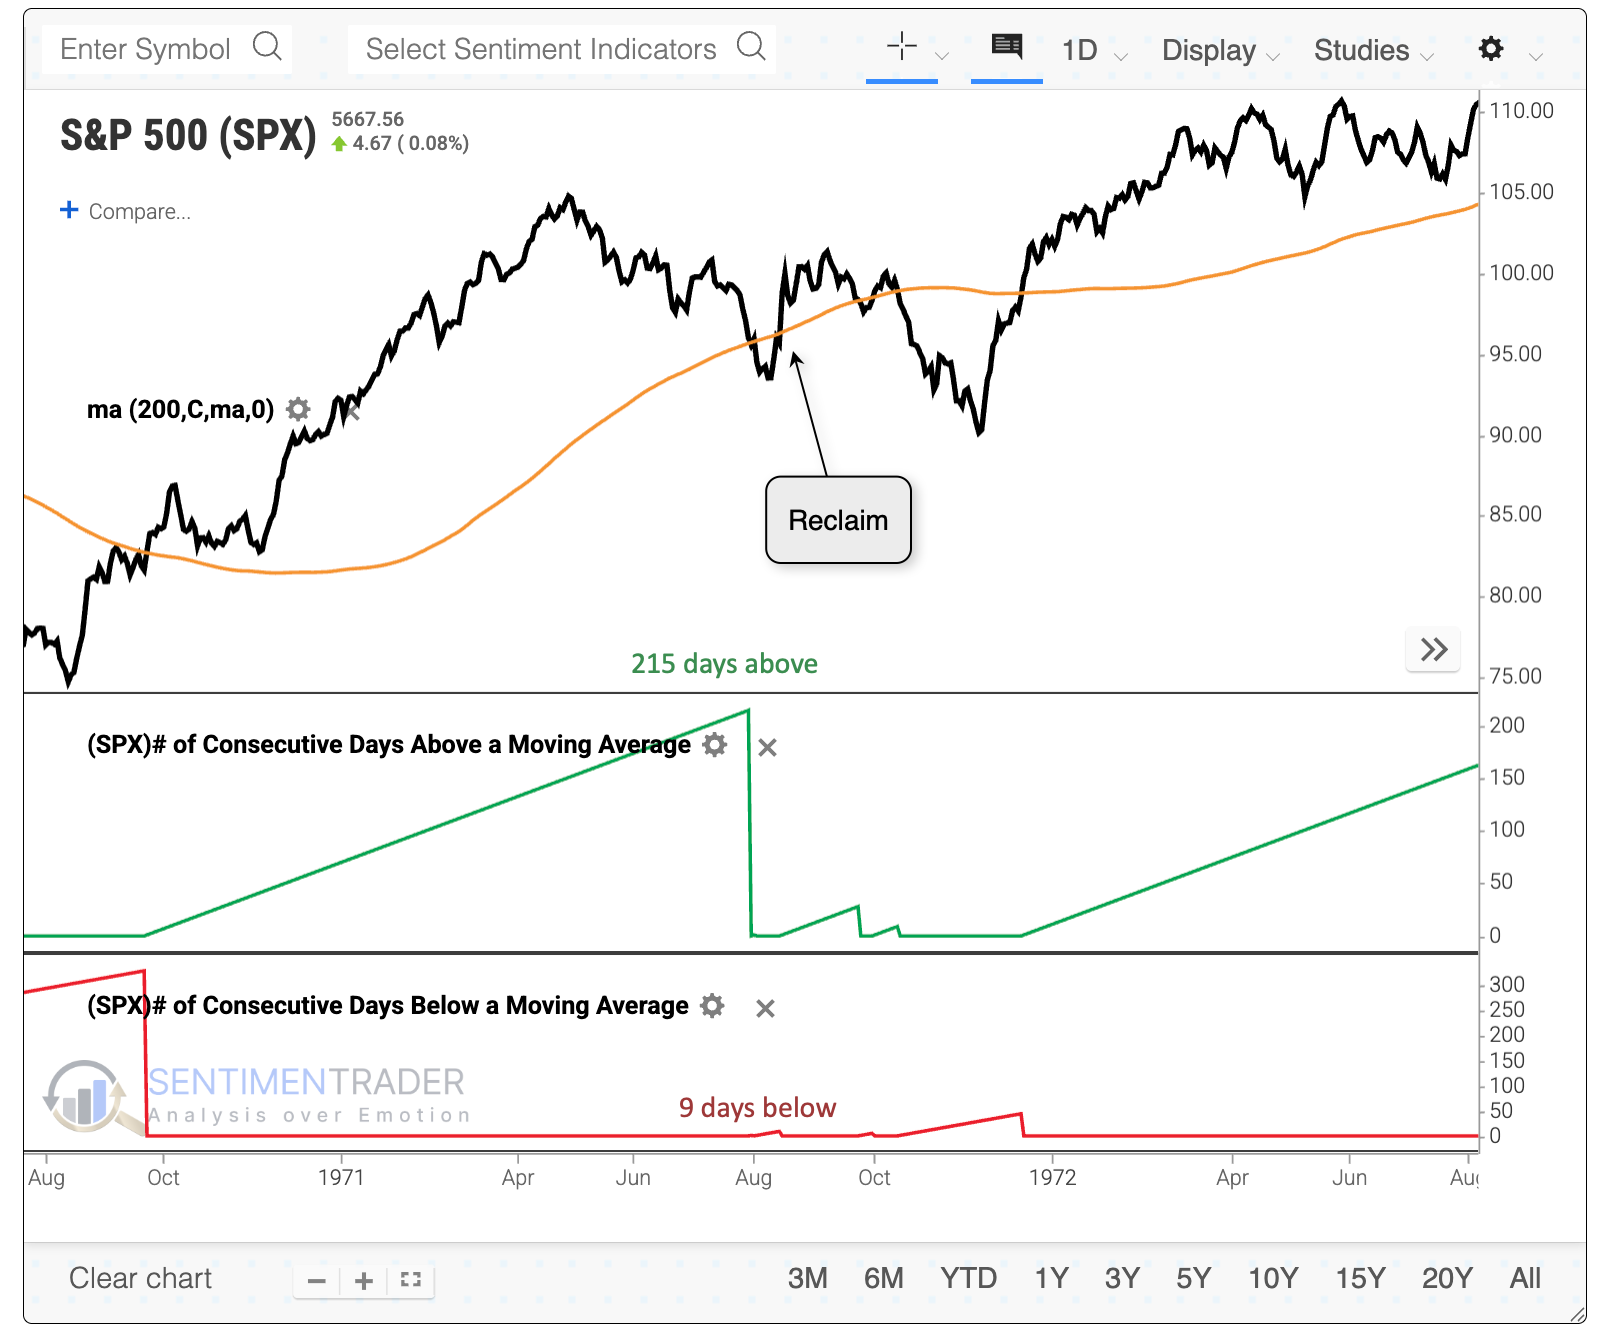
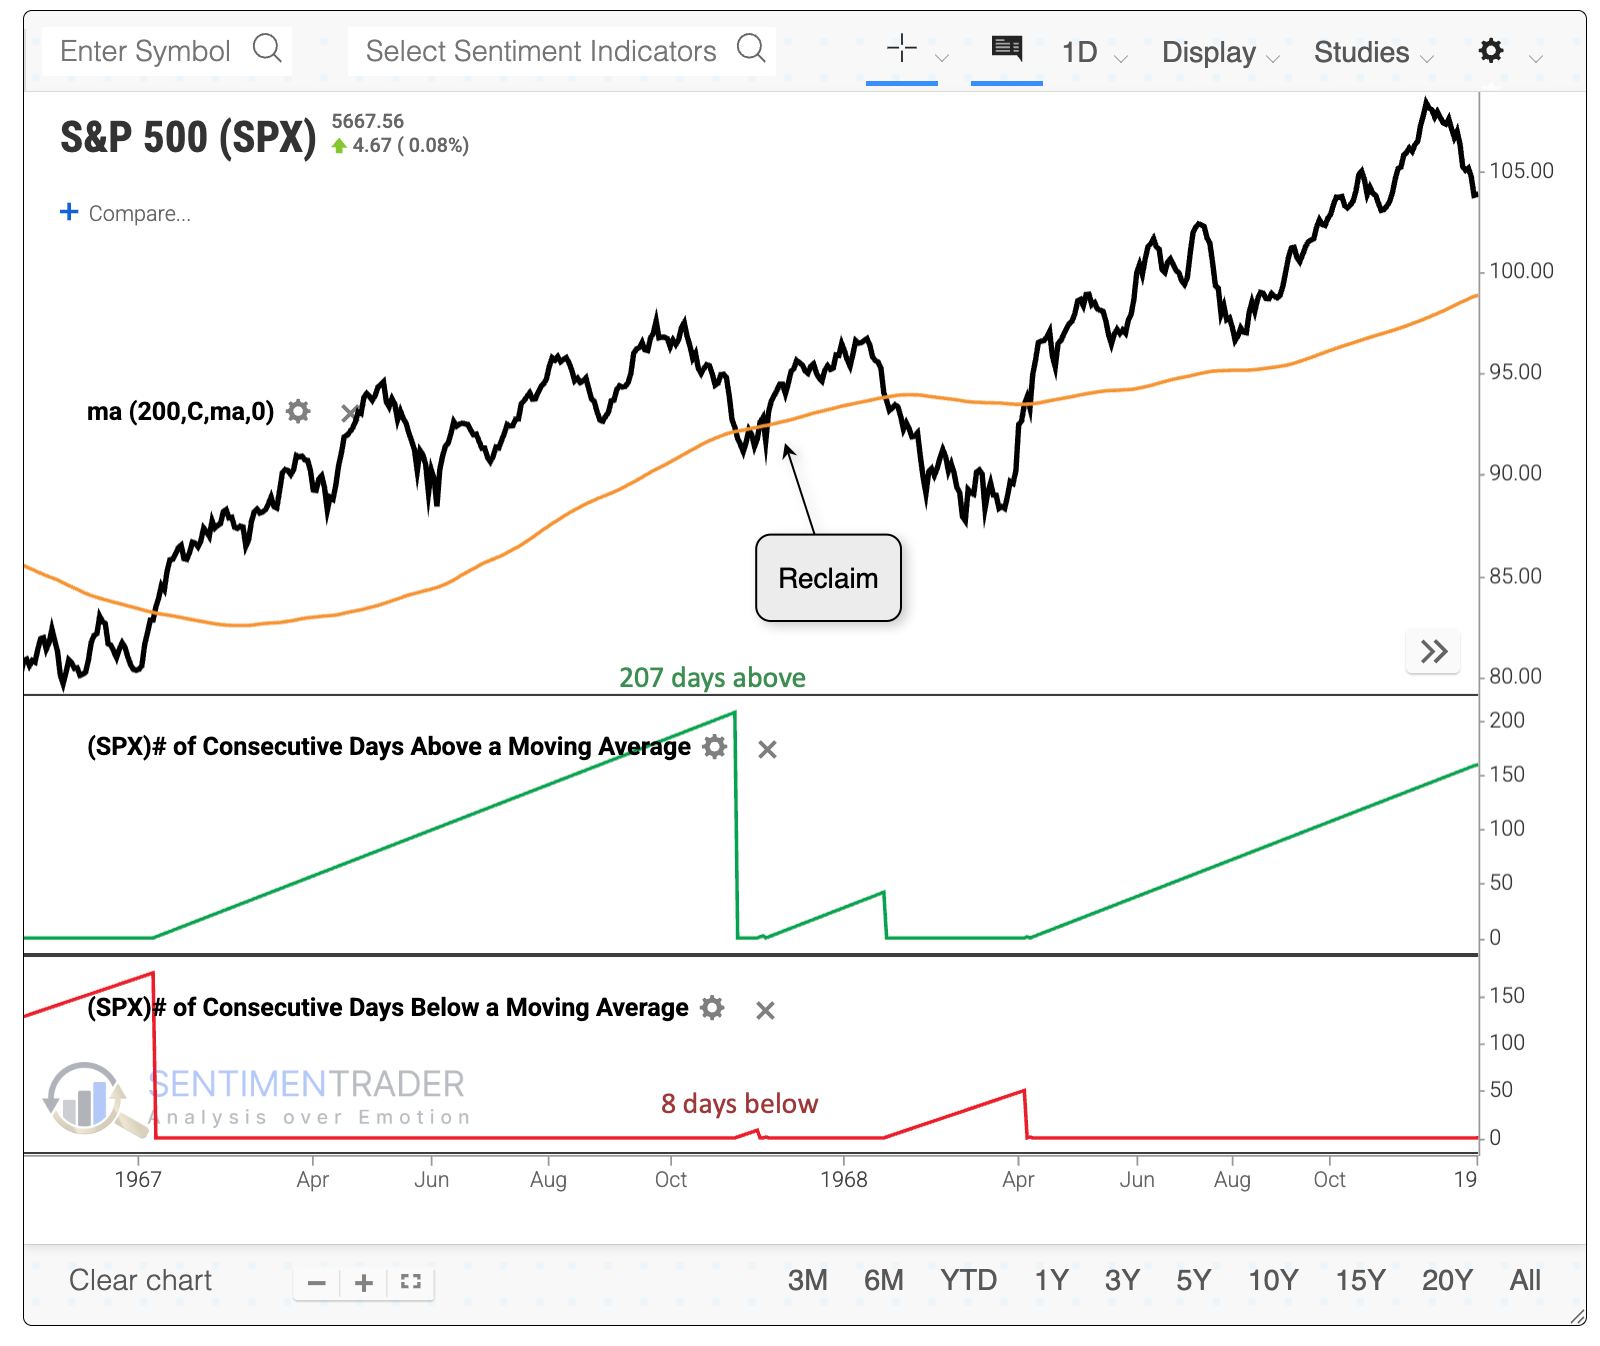
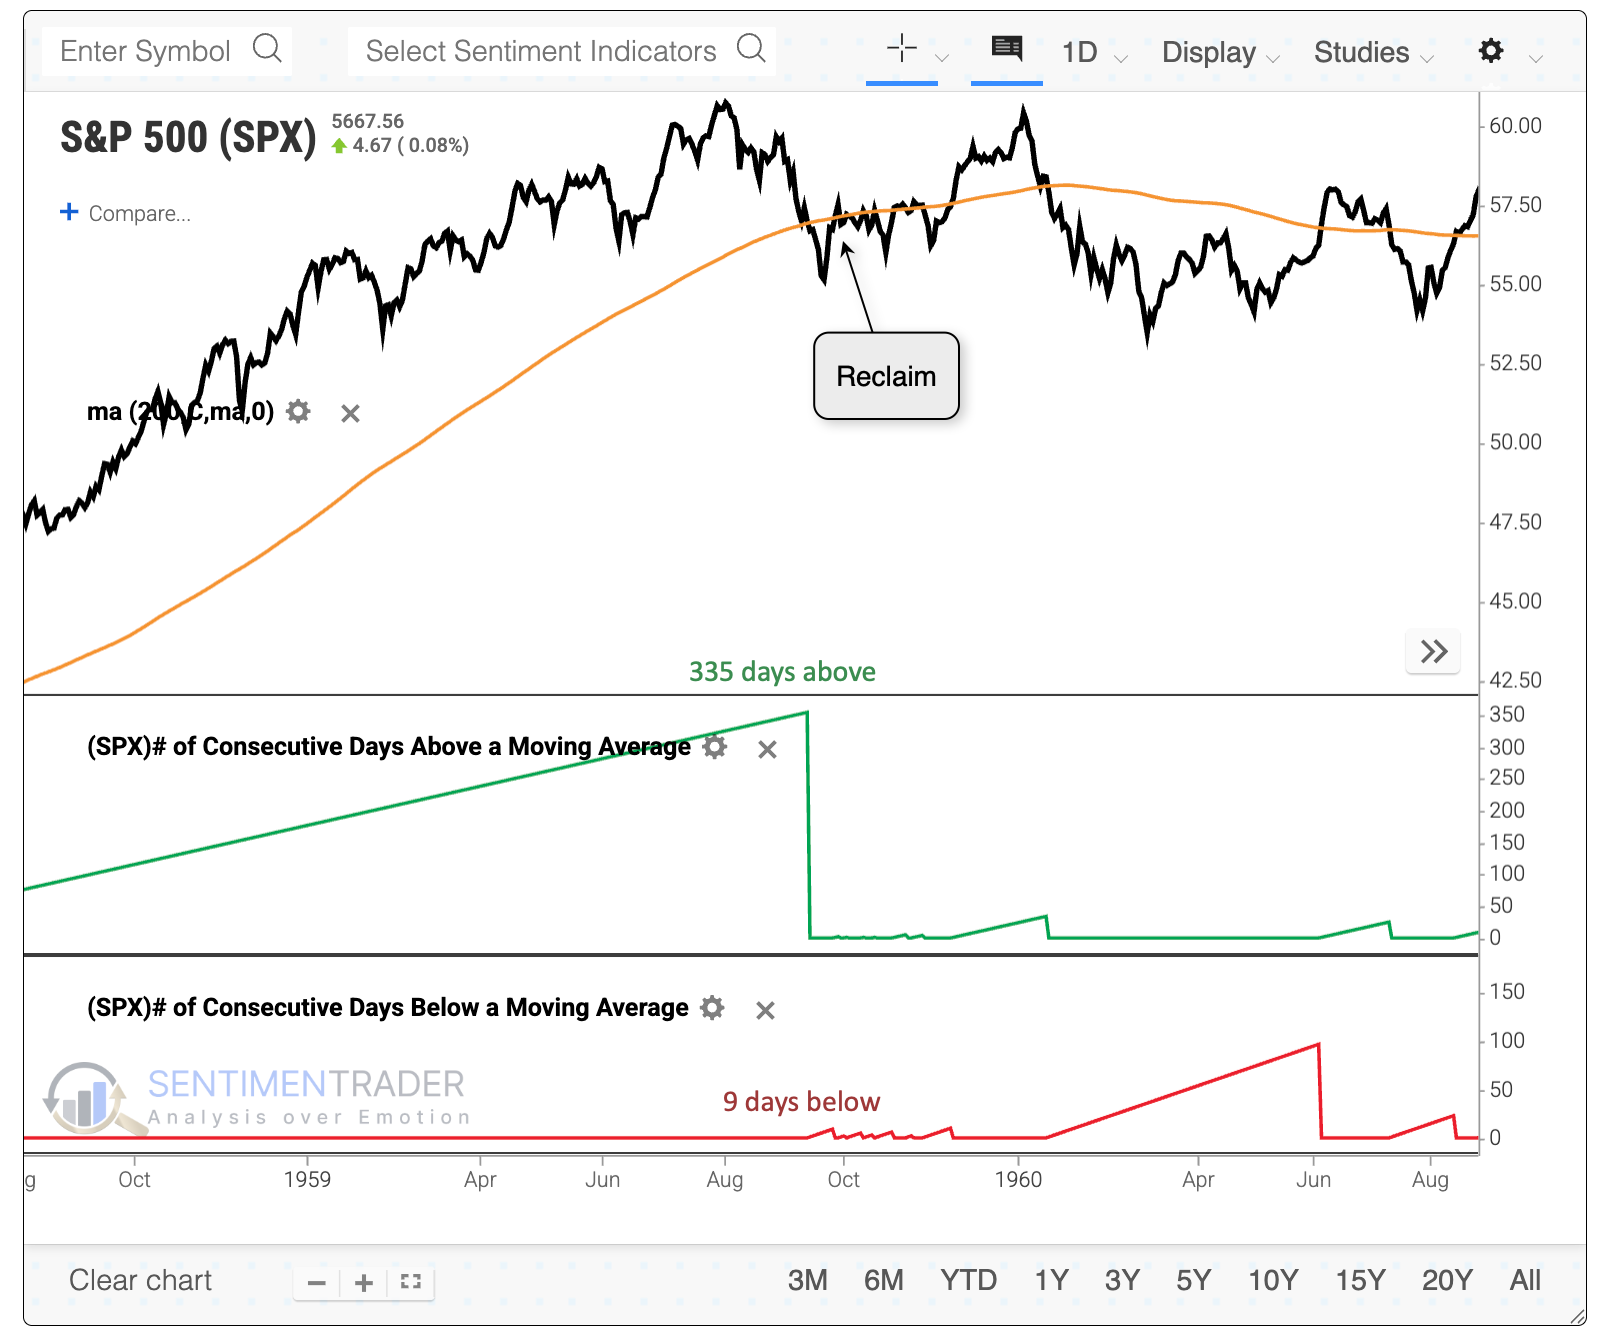
The Backtest Engine 2.0 allows users to plot (and test) how many days a stock or index has been above or below a moving average of any length. The above chart shows that the S&P 500 had been above its 200-day moving average for more than 300 sessions, then below it for only 10 before rising above it once again.

This seems like bull market behavior - a long, uninterrupted uptrend, then a drop that immediately attracted dip-buyers. When looking at historical precedents, though, something stuck out - the last four times this occurred were ahead of limited and unsustainable upside in 1999, 2007, 2014, and 2022. The S&P suffered a negative return either three or six months following 8 of the 10 signals.

We're looking at any time the S&P went more than 200 sessions above its 200-day average and then dropped below it for between 5 and 15 sessions before reclaiming it.

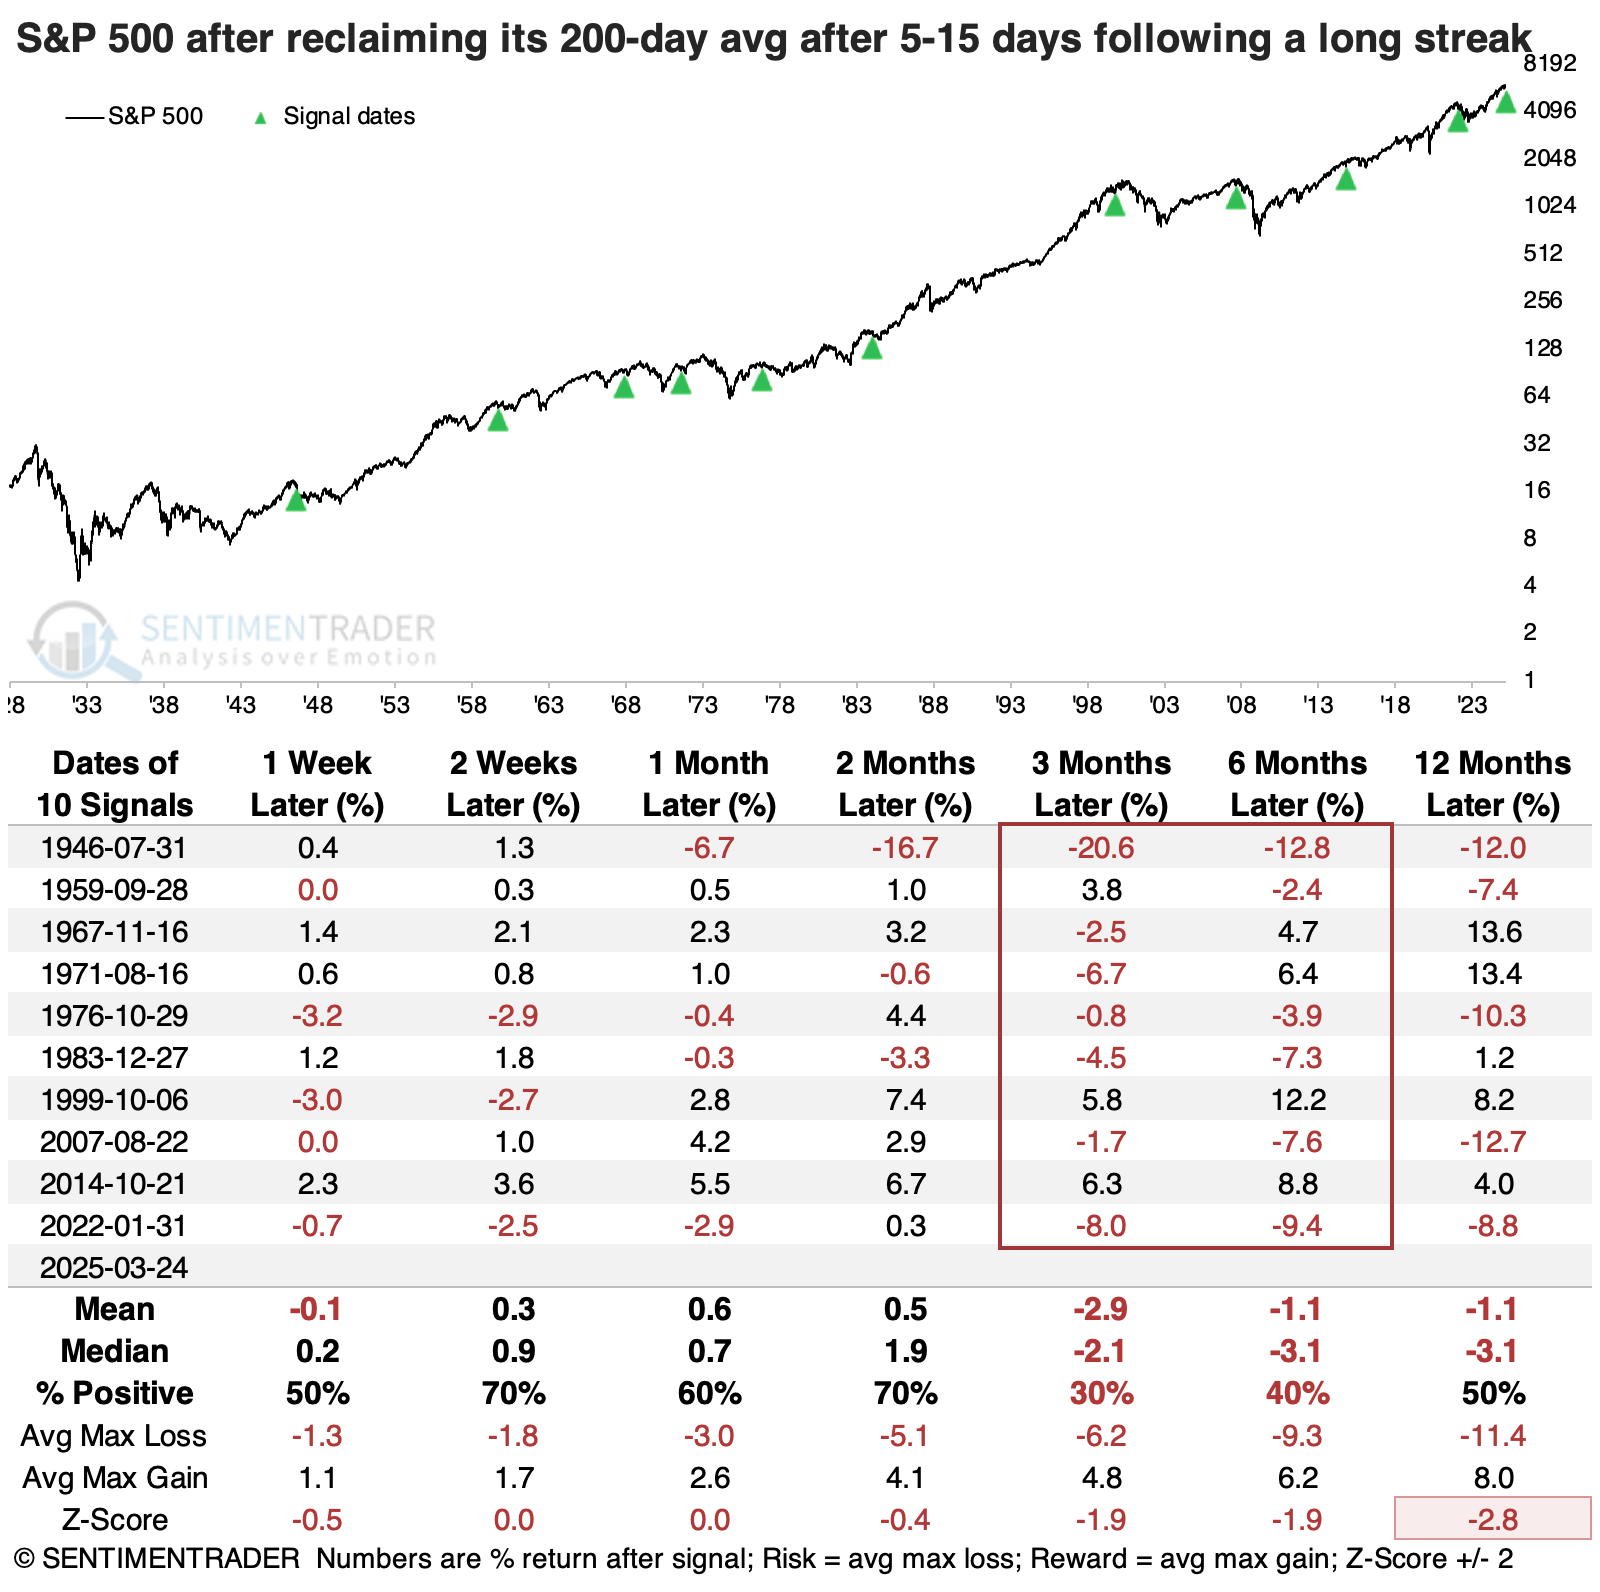
A drawdown analysis shows a negative skew, with more -10% drawdowns than +10% drawups. Only four of the ten signals showed more reward than risk over the following year.

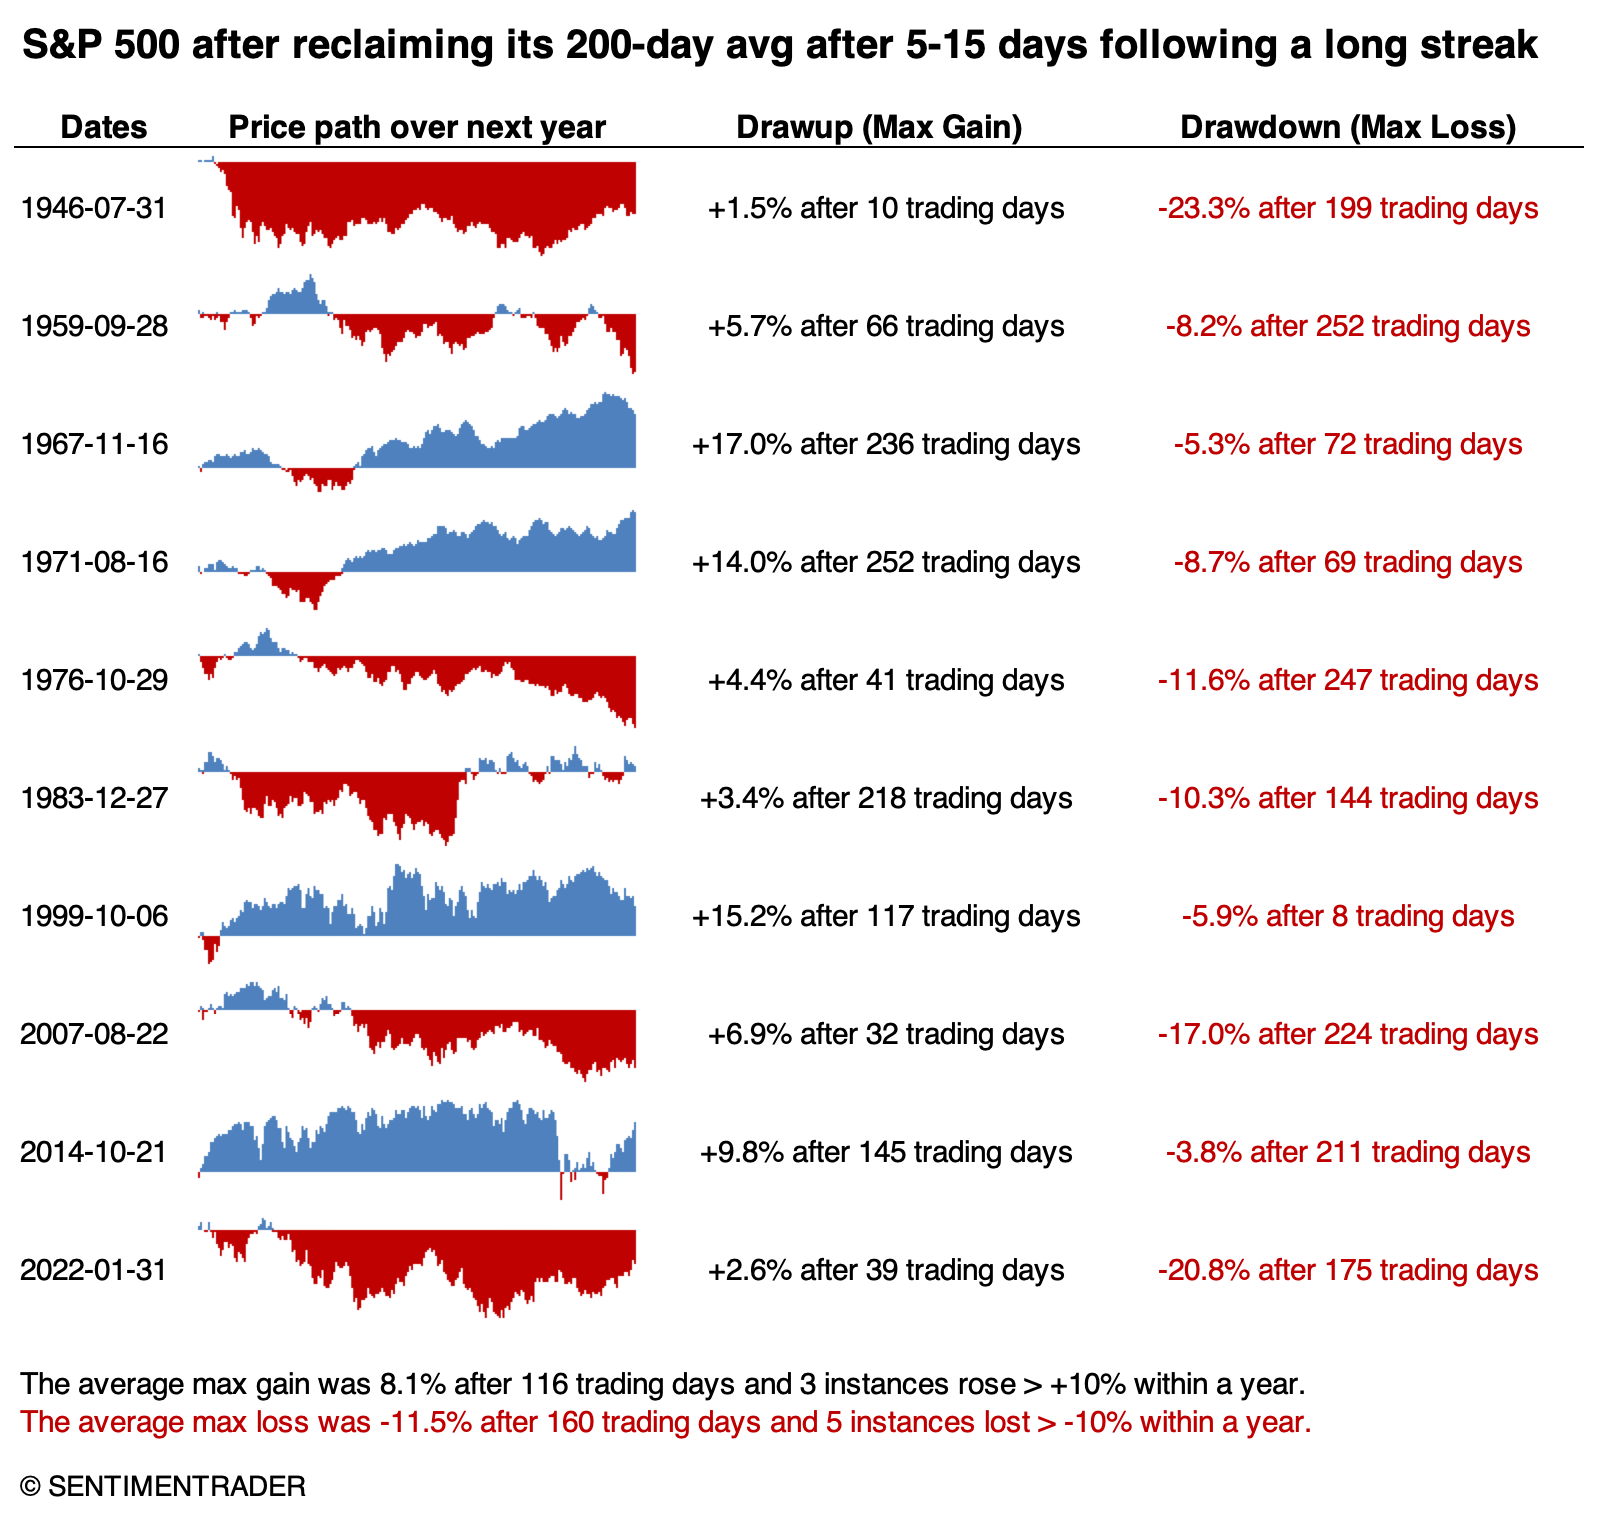
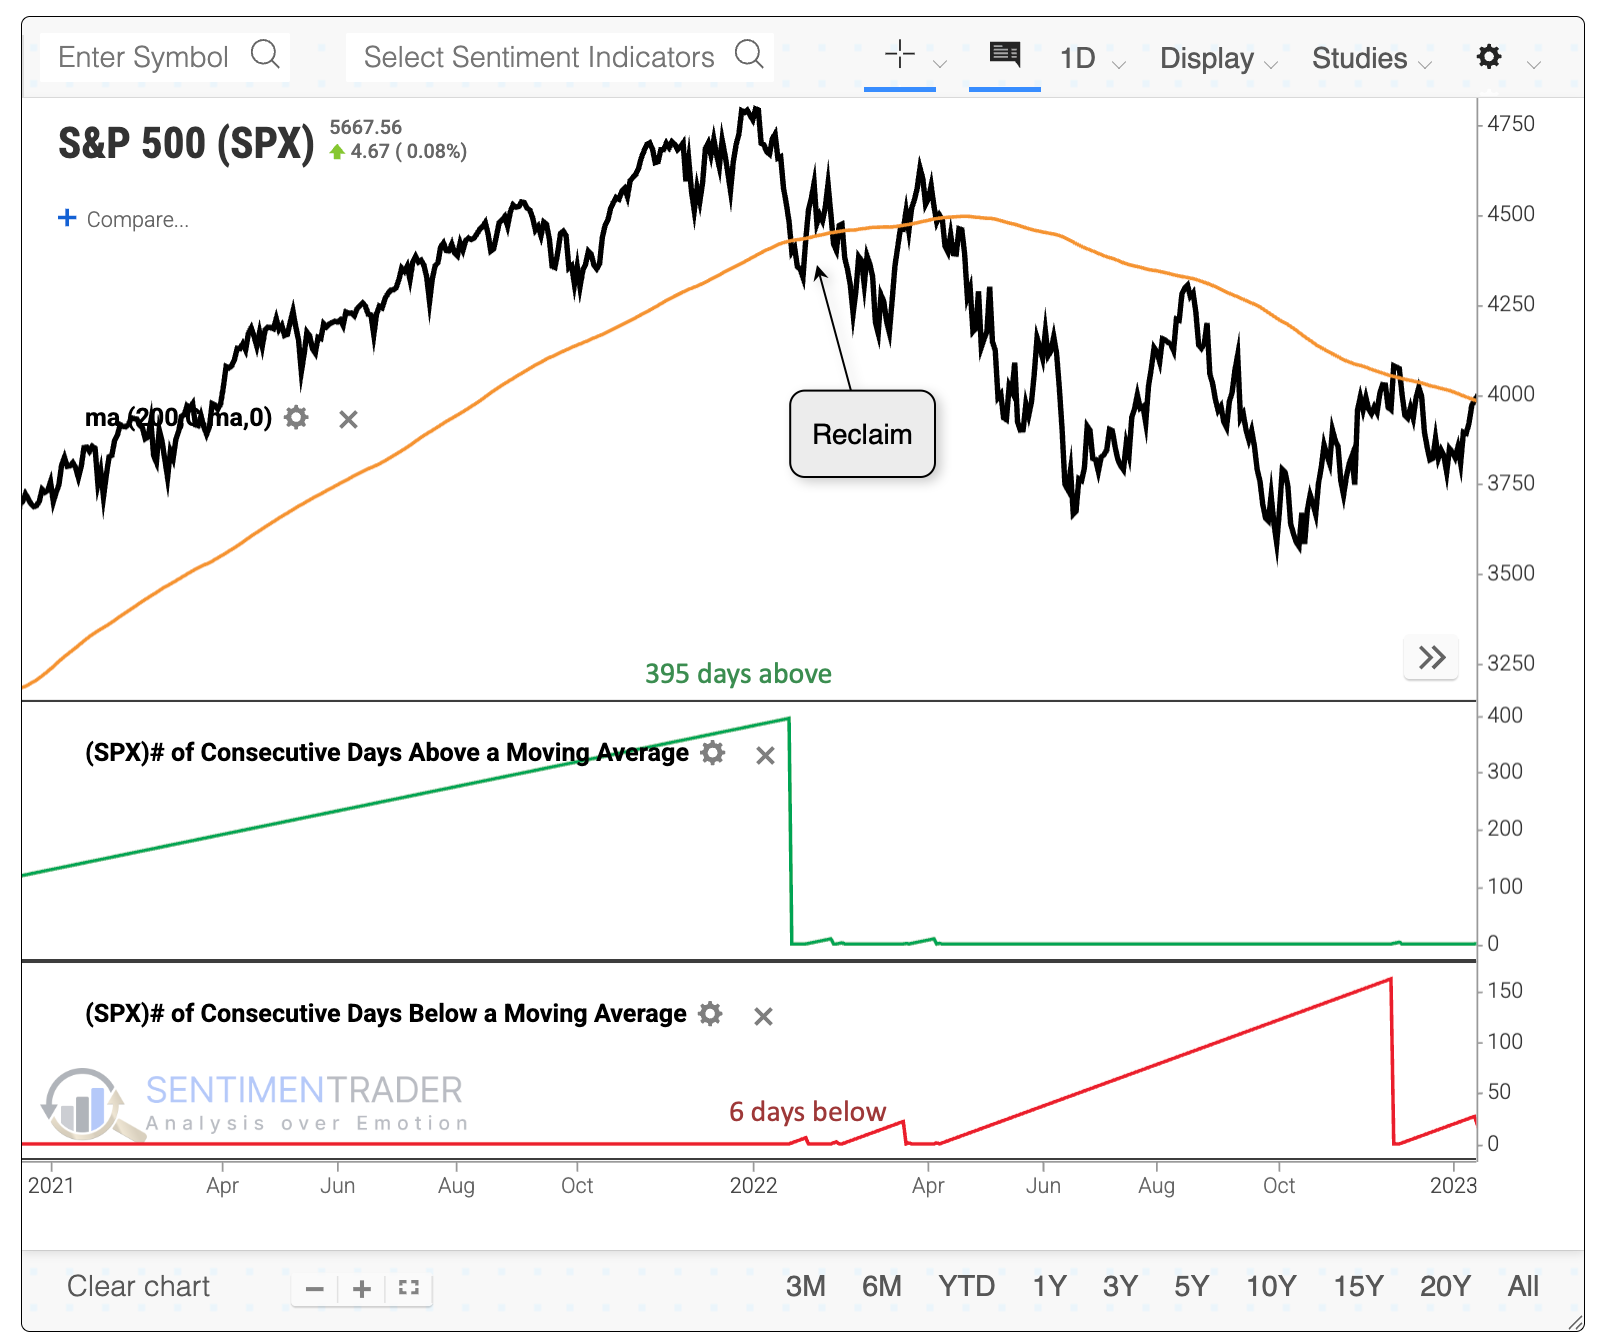
The charts below show each instance, a year before and a year after the S&P reclaimed its 200-day average after a long stretch above and a 5-to-15-day dip below.

The instances that held up the best tended to see follow-through buying in the days ahead, pushing further ahead of its 200-day average. Those that didn't manage much of a bounce and quickly fell back below the 200-day average tended to see more of a struggle in the months ahead.

What the research tells us...

Even if we loosen the parameters in the study above, the S&P's returns in the months ahead tended to be weaker than average. This may be surprising since popping back above the 200-day average is supposed to be a positive development. It is, but we should be on the lookout for a relatively quick failure. If we see that in the days ahead, it will raise questions about the sustainability of some of the prior studies. We'd still give those bullish implications the benefit of the doubt - it's only if the S&P cannot sustain interest above its average that confidence in a bullish outcome will suffer.

PRODUCTS
SentimenTrader
Trading Tools
Indicators & Data API
‍
Strategies & Scanner
‍
Research Reports
FREE
RESOUrCES
Simple Backtest
Calculator
Simple Seasonality
Calculator
The Kelly Criterion
Calculator
Sentiment Geo Map
‍
Public Research Reports
‍
Education
Sentiment Indicators
‍
Technical Indicators
‍
Pricing
Bundle pricing
‍
FAQ
‍
Announcements
‍
COMPANY
‍
About
‍
In the News
‍
Testimonials
‍
Client Success Stories
CONTACT
‍
General Inquiries
‍
Media Inquiries
‍
Financial Professionals Inquiries
‍
© 2026 Sundial Capital Research Inc. All rights reserved.
Setsail Marketing
TermsPrivacyAffiliate Program
Risk Disclosure: The information and tools provided are for research and analytical purposes only and are not intended as investment advice. Market analysis involves uncertainty, and outcomes may differ from expectations. Users should conduct their own due diligence and consider their individual circumstances before making any financial decisions. Past performance is not necessarily indicative of future results.

Hypothetical Performance Disclosure: Hypothetical performance results have many inherent limitations, some of which are described below. No representation is being made that any account will or is likely to achieve profits or losses similar to those shown; in fact, there are frequently sharp differences between hypothetical performance results and the actual results subsequently achieved by any particular trading program. One of the limitations of hypothetical performance results is that they are generally prepared with the benefit of hindsight. In addition, hypothetical trading does not involve financial risk, and no hypothetical trading record can completely account for the impact of financial risk of actual trading. for example, the ability to withstand losses or to adhere to a particular trading program in spite of trading losses are material points which can also adversely affect actual trading results. There are numerous other factors related to the markets in general or to the implementation of any specific trading program which cannot be fully accounted for in the preparation of hypothetical performance results and all which can adversely affect trading results.

Testimonial Disclosure: Testimonials appearing on this website may not be representative of other clients or customers and is not a guarantee of future performance or success.