
The S&P 500 liquidity premium indicator triggered a risk-on signal

Key points
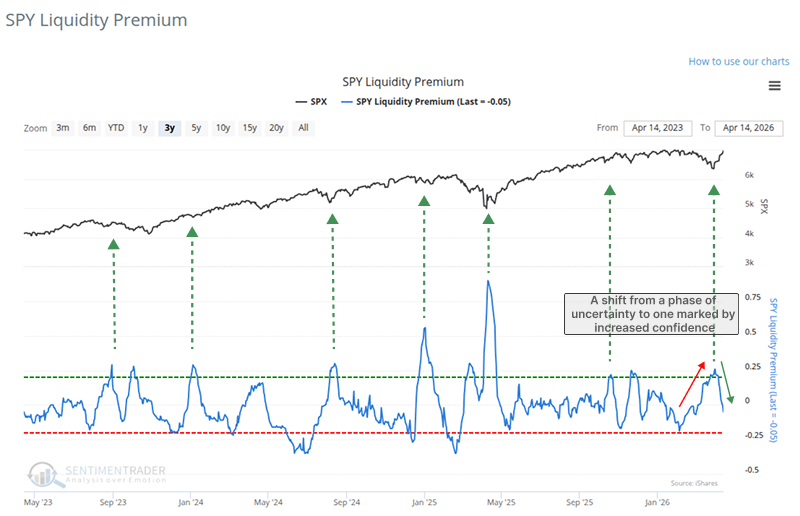
- The S&P 500 Liquidity Premium indicator has officially triggered a risk-on alert, indicating a shift from market uncertainty back to confident participation.
- Historically, when the indicator's 84-day range rank cycles from above 99% down to less than 42%, the SPY ETF displays excellent forward returns and consistency.
- The inverse of this indicator can serve as a tactical risk-off signal, historically preceding near-term S&P 500 declines 81% of the time over a two-week period.
A sentiment gauge based on trading volume triggered a risk-on alert
The S&P 500 Liquidity Premium indicator compares the volume of the S&P 500 ETF (SPY) to the volume of the underlying stocks comprising the S&P 500. When volume in the ETF increases relative to stocks, the indicator rises, indicating that investors are uncertain about the outlook for the market, a scenario typically associated with corrective phases. Eventually, confidence returns and volume increases in individual stocks compared to the ETF, causing the indicator to shift lower.
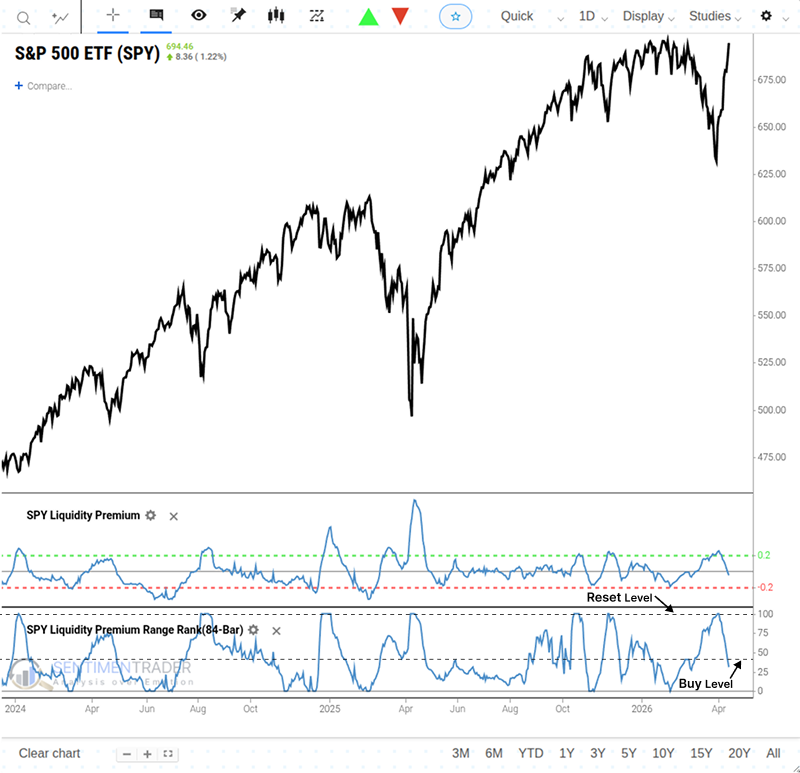
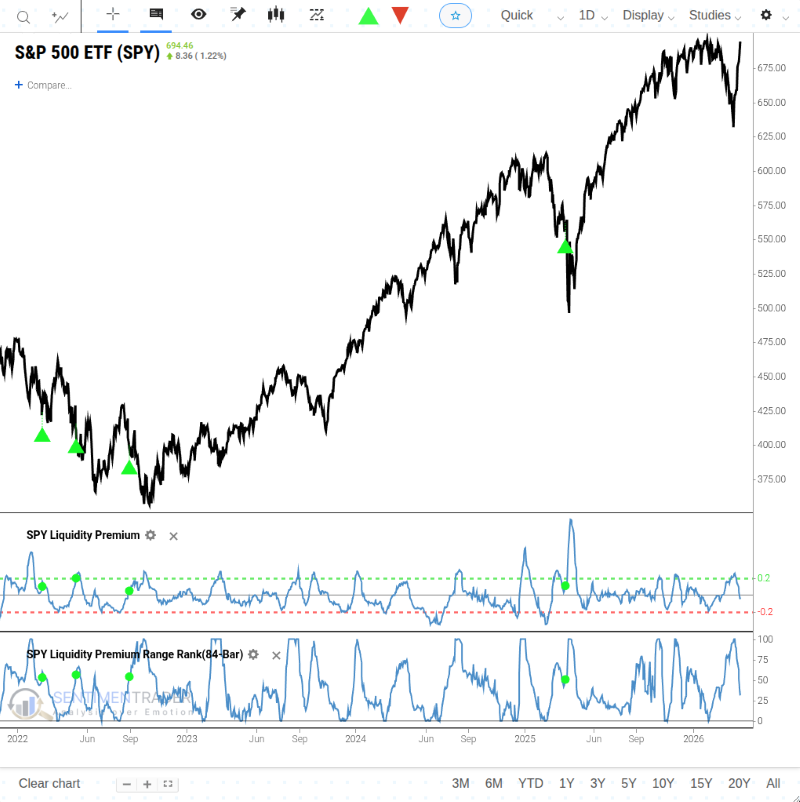
The model we use for the SPY liquidity premium indicator is similar to several other systems we've shared. We apply a range rank to the liquidity premium indicator. In this case, the optimal lookback period for the range is four months. The buy signal occurs when the range rank cycles from above 99% to less than 42%.
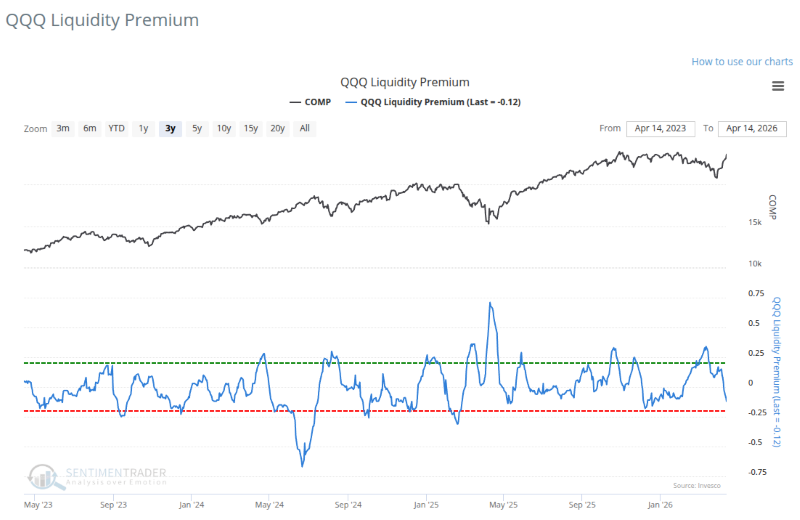
If you were curious, the QQQ Liquidity Premium indicator is also trending toward a risk-on signal.
By applying a range rank to the liquidity premium indicator and optimizing the most effective lookback period and threshold levels, the model can identify when sentiment amongst traders has eased from a period of uncertainty.
Similar volume-based sentiment shifts preceded a bullish outlook
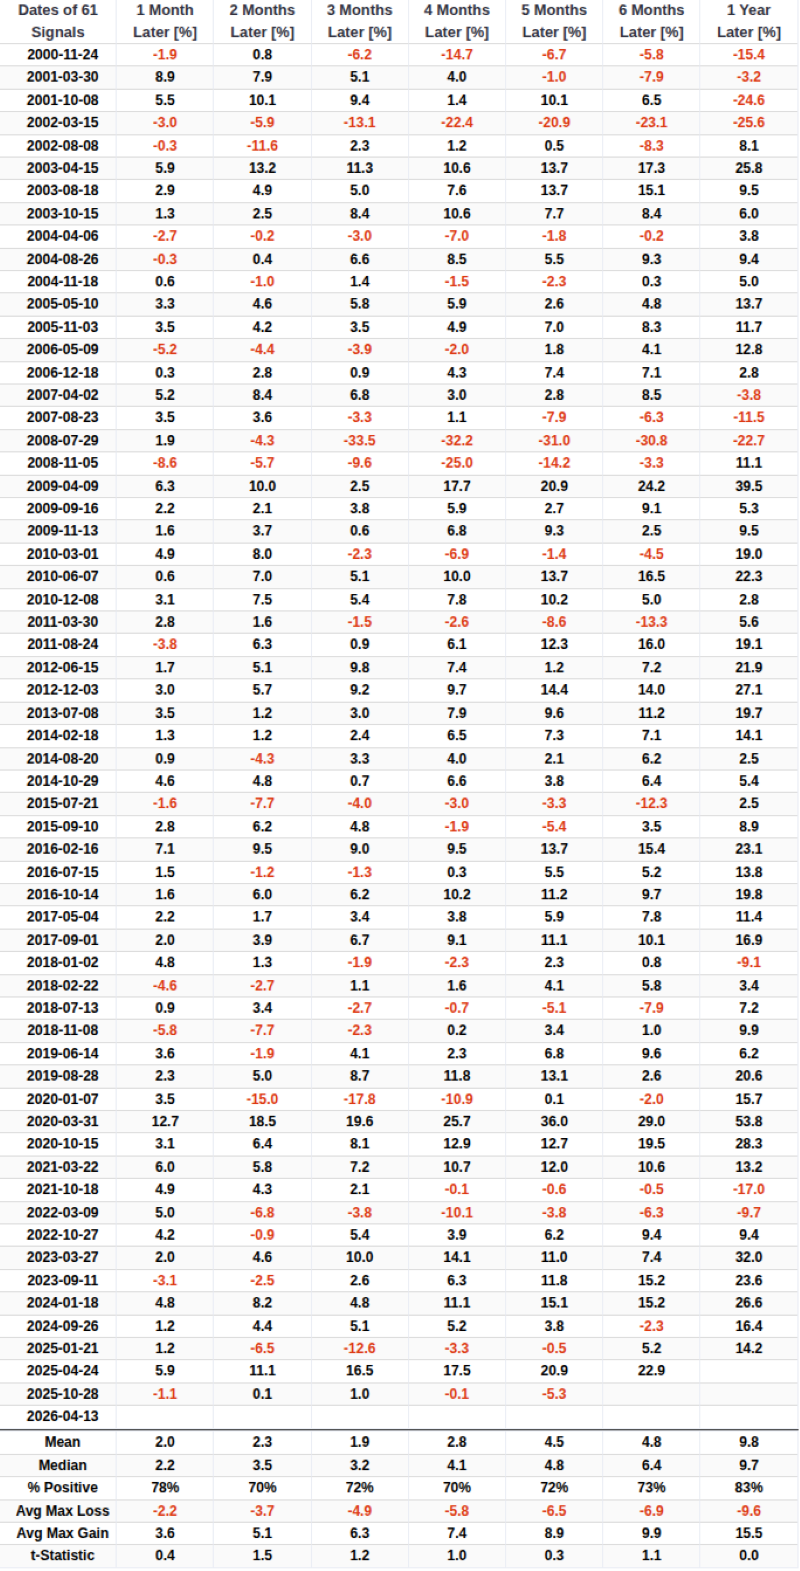
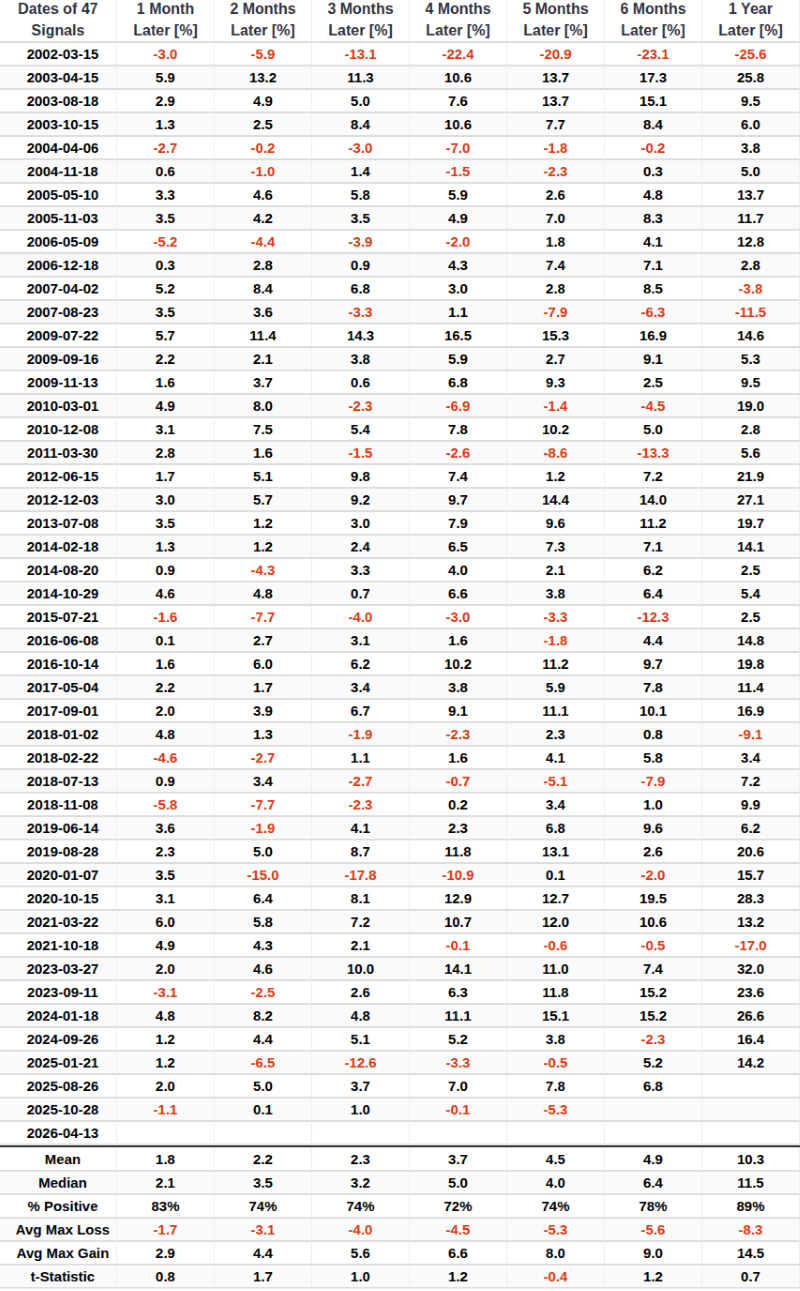
Whenever the SPY Liquidity Premium's 84-day range rank cycled from above 99% to less than 42%, the S&P 500 ETF (SPY) displayed excellent returns and consistency across all time frames.
Signals that occurred in an uptrend for context similar to now
Suppose we include a condition that requires the SPY ETF to trade above its 200-day average when a reversal signal triggers. In that case, uptrend precedents show slightly better win rates with returns about the same as signals in any environment.
Can we use the Liquidity Premium indicator to signal risk-off?
We analyzed the liquidity premium indicator to determine its effectiveness as a risk-off signal. Our findings revealed that it can serve as an early warning for a potential market correction.
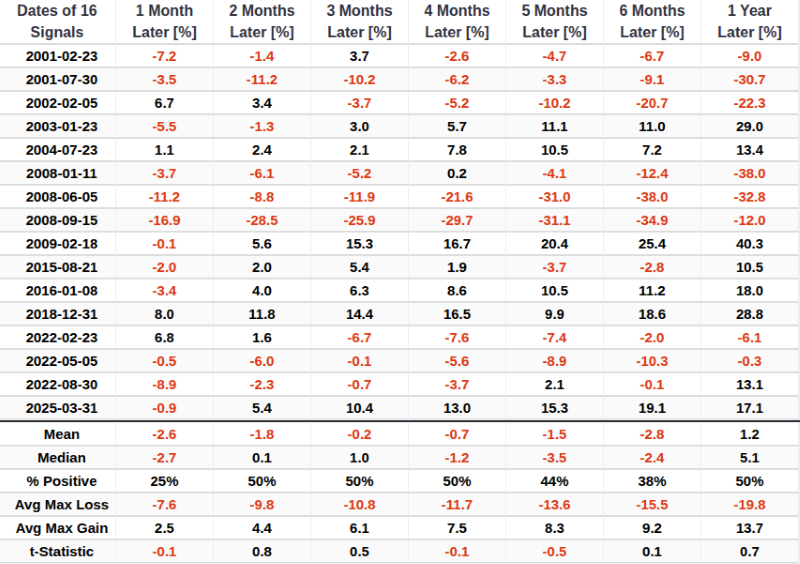
The methodology mirrors the risk-on signal but with reversed parameters. A risk-off signal is triggered when the Liquidity Premium indicator's 84-day range rank transitions from below 1% to above 50%, with the index below its 200-day average.
In the next month, the world's most benchmarked index displayed a loss in 14 out of 16 cases.
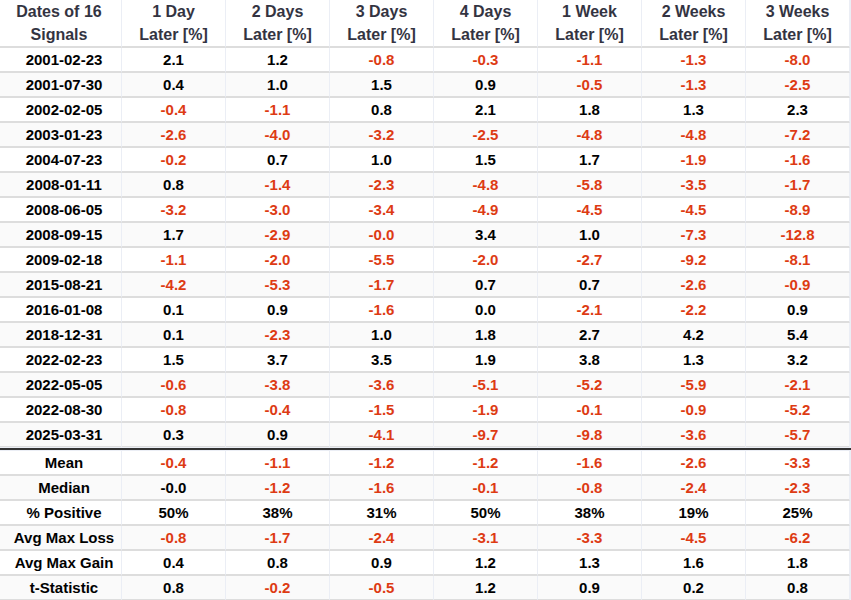
We tend to view this as a short-term warning sign; let's take a look at how it performs in the short term. Following liquidity premium risk-off signals, the S&P 500 showed a fairly strong tendency to decline in the near term, falling 81% of the time over two weeks.
What the research tells us...
The S&P 500's Liquidity Premium indicator increased to an elevated level, indicating uncertainty or fear among investors. Subsequently, it reversed lower, triggering a risk on signal for stocks. Similar shifts in this volume-derived sentiment indicator produced outstanding returns and consistency for the S&P 500, especially when the index was in a long-term uptrend like now. The system for the liquidity premium indicator can be reversed to identify risk-off warnings. Investors should view this setup as a constructive signal for maintaining equity exposure, while keeping the inverse risk-off parameters in the playbook for future tactical hedging.