
The S&P 500 in August of Midterm Election Years

Key points
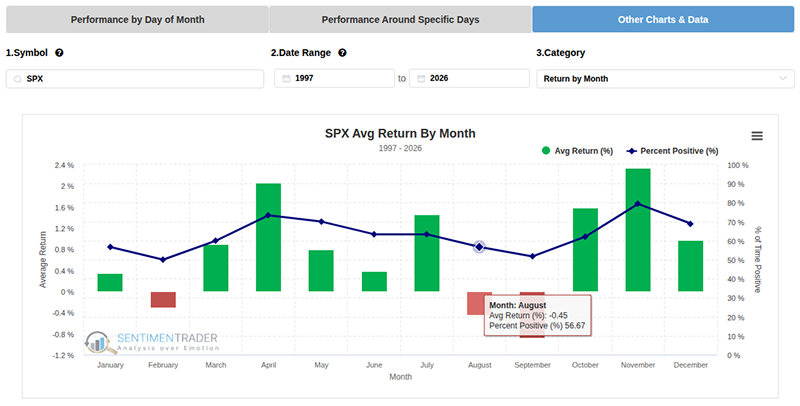
- Over the past 30 years, the S&P 500 has consistently underperformed during late summer, averaging a -0.45% decline in August and a -0.88% decline in September.
- Midterm election years introduce significant volatility, with average drawdowns reaching -17.8% (compared to -13.2% in non-midterm years), and these deep pullbacks typically bottom out in October or Q3.
- The past performance is no guarantee of future results , but we should be prepared for a downturn.
Seasonal Headwinds
U.S. stocks have historically underperformed in August. In fact, over the past three decades, the S&P 500 has consistently struggled during this month. The index has averaged a decline of 0.45% in August, and performance deteriorates further in September with an average drop of 0.88%.
On our Seasonality page, you can freely select the Symbol and choose the years you want to backtest.
Under Performance By Day of Month, you can view the daily returns for the current month. I prefer viewing this by trading day, which you can change under Category.