
The S&P 500 hasn't seen selling pressure like this in more than a decade.

Key points:
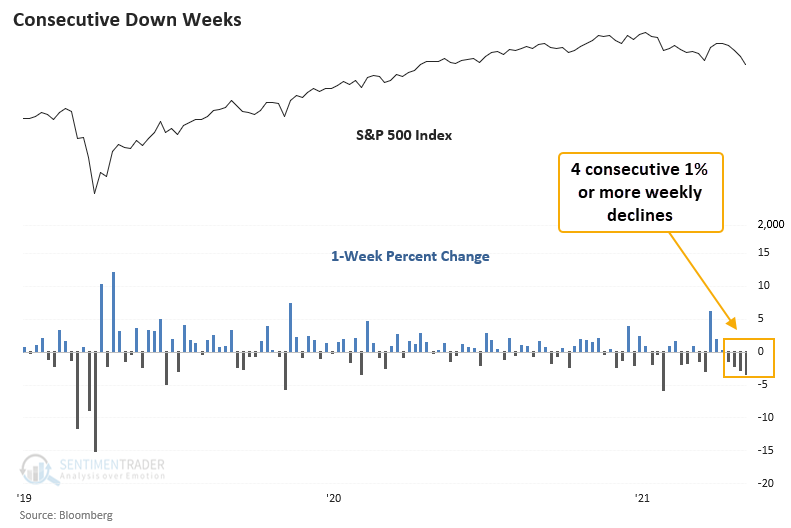
- The S&P 500 has declined 1% or more for 4 consecutive weeks
- After similar signals, the index shows negative returns in the 1 to 8-week time frames
- When the SPX < 15% from a high, returns are still negative in the near term but better on a long-term basis
Negative momentum begets more negative momentum
Let's assess the outlook for stocks after the S&P 500 closes down 1% or more for 4 consecutive weeks. I will include a days-in-trade holding period of 4 weeks to eliminate overlapping signals.
This type of selling pressure is somewhat rare, with the last instance occurring over a decade ago in 2011.
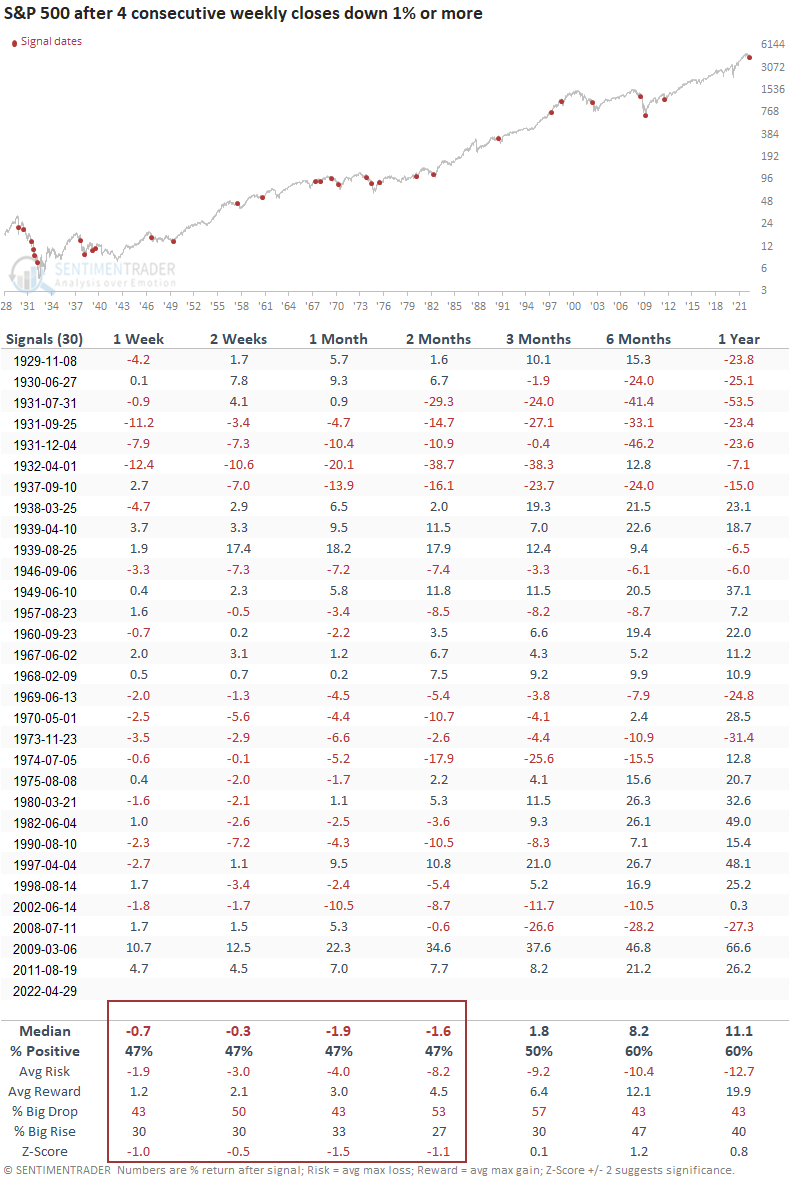
Similar consecutive down weeks preceded negative returns for the S&P 500
This study generated a signal 30 other times over the past 93 years. After the others, S&P 500 future returns, win rates, and risk/reward profiles were uninspiring in the 1-8 week range. The long-term results look better, especially after the 1929-32 bear market.
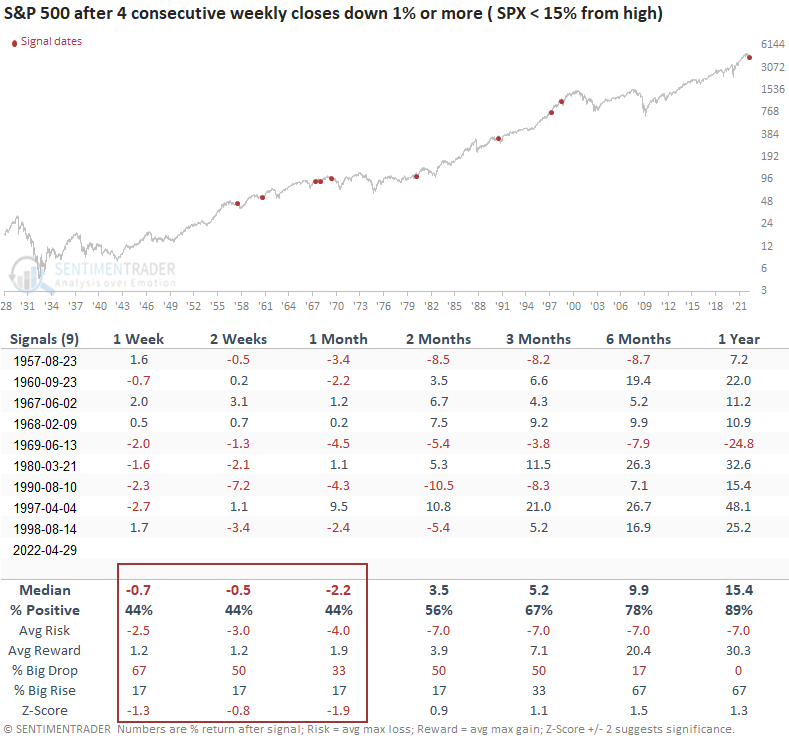
Similar consecutive down weeks near a high preceded negative returns for the S&P 500
Let's add some context to the study. I will keep the original parameters but now require the S&P 500 to be within 15% of a multi-year high. As of Friday's close, the S&P 500 was down 13.86%. I used daily data for the distance from the high parameter.
This study generated a signal 9 other times over the past 65 years. After the others, S&P 500 future returns, win rates, and risk/reward profiles were uninspiring in the 1-4 week time frames. The S&P 500 closed lower at some point in the first month in 7 out of 9 instances. However, the long-term results look much better, especially the 1-year time frame.
If I used 20% or less from the high, the study would have generated two additional signals, which occurred on 9/6/1946 and 11/23/1973. Both showed ugly results.
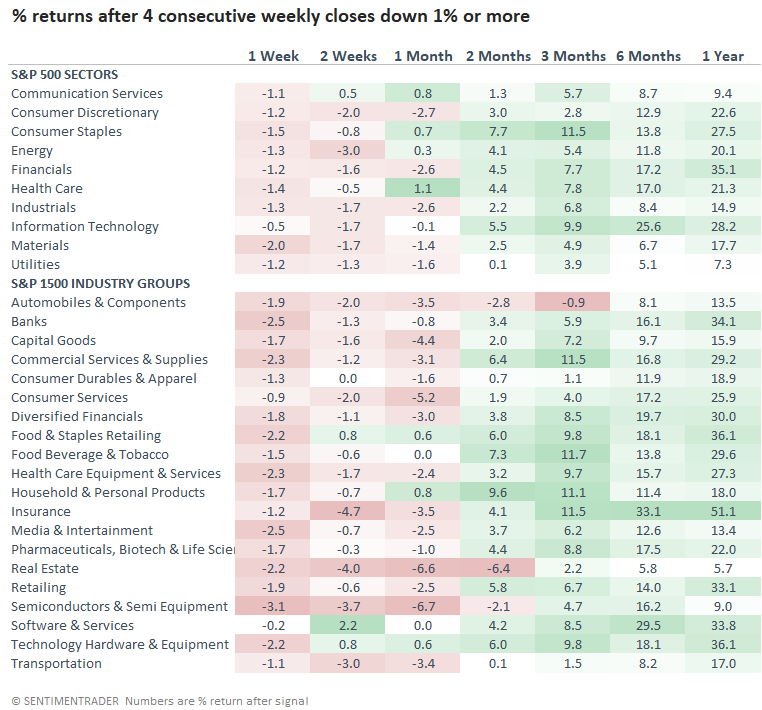
Sectors and industry group performance after signals with the percent from a high condition
The sector and industry group outlook confirms the cautionary stance for the broad market in the 1 to 4-week time frames. Not surprisingly, defensive groups like staples and health care performed the best in the near term.
Due to data limitations, the sector and industry table does not include the 1957 signal.
What the research tells us...
When the S&P 500 declines by 1% or more for 4 consecutive weeks, the selling pressure continues in the near term. Similar setups to what we're seeing now have preceded negative returns in the 1-8-week time frames. If I isolated instances when the index was down 15% or less from a multi-year high as today, the study shows weak results in the near term. However, the long-term outlook is constructive, with an 89% win rate 1 year later. The sector and industry outlook table confirms what we have highlighted in other research notes of late; stay with a defensive sector allocation for now.