Products
SentimenTrader Trading Tools
‍
Backtest Engine
My Trading Toolkit
Correlation Analysis
Seasonality
Market Prediction
Indicators & Data API
‍
Proprietary Indicators & Charts
Market Data API
Strategies & Scanner
‍
50+ Trading Strategies
Smart Stock Scanner
Smart Option Scanner
Research Reports
‍
Research Solutions
Reports Library
Free Resources
Simple Backtest Calculator
Simple Seasonality Calculator
The Kelly Criterion Calculator
Sentiment Geo Map
Public Research Reports
Education
Sentiment Indicators
Technical Indicators
Pricing
Company
About
In the News
Testimonials
Client Success Stories
Contact
Log inLoginSign up
< BACK TO ALL REPORTS

The S&P 500 has crashed when priced in gold

Jason Goepfert
2025-04-21
Over the past 3 months, stocks have dumped while gold has pumped. The ratio between the S&P 500 and gold dropped more than 25% to a multi-year low. Over the past 50 years, similar behavior preceded volatile conditions, but the S&P showed double-digit gains a year later, except for the financial crisis. Gold showed gains 6 months later all but once.

Key points:

  • The S&P 500 priced in gold has plunged to a multi-year low, falling more than 25% in only 3 months
  • After similar behavior, stocks were volatile, but showed excellent gains a year later (with one big exception)
  • Even though these signals occurred after gold had already risen, it showed gains 6 months later all but one time

Stocks tank, gold soars

Stocks have taken something of a beating this year.

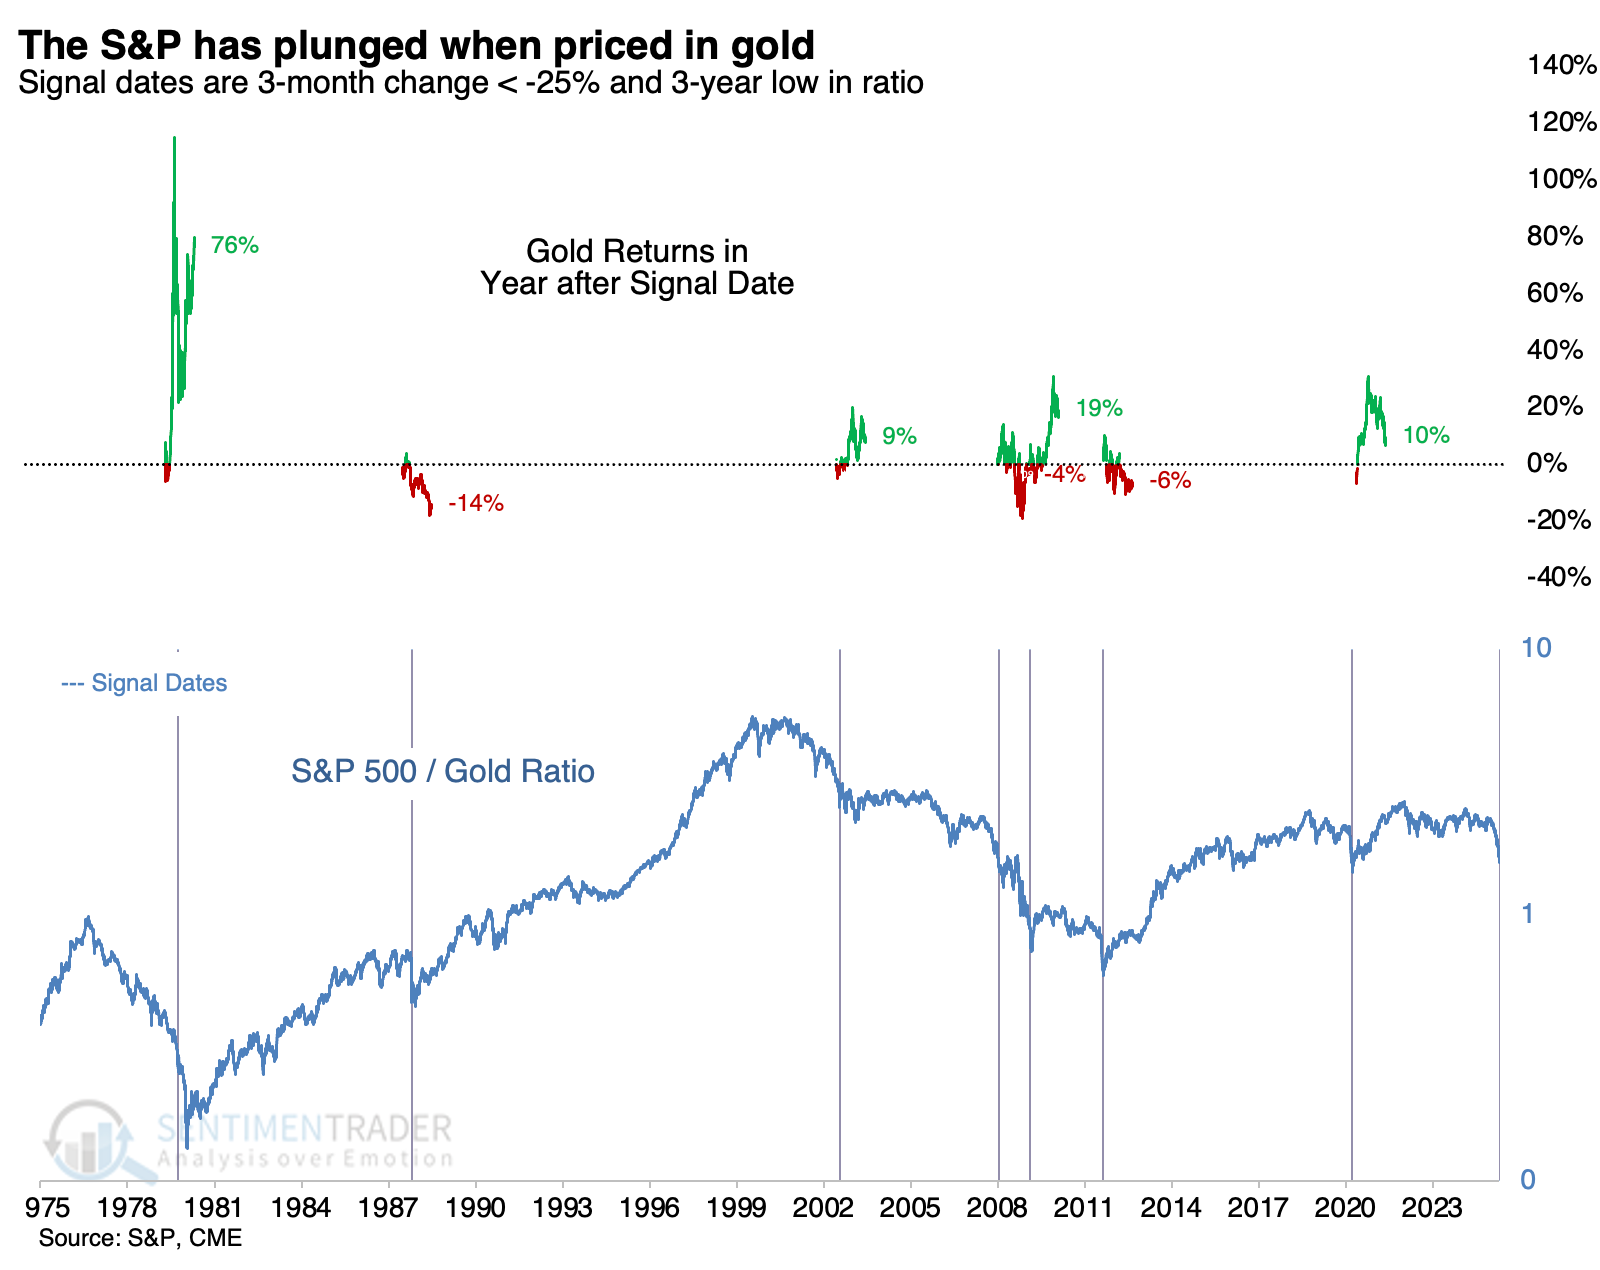
The S&P 500 has been vulnerable due to its top-heavy nature, and it got penalized as a result. And when we price the S&P in "hard money," meaning gold, the decline looks downright atrocious.

For one of the few times in the fifty years since gold has traded freely, the ratio between the S&P and the metal lost a quarter of its value in only three months.

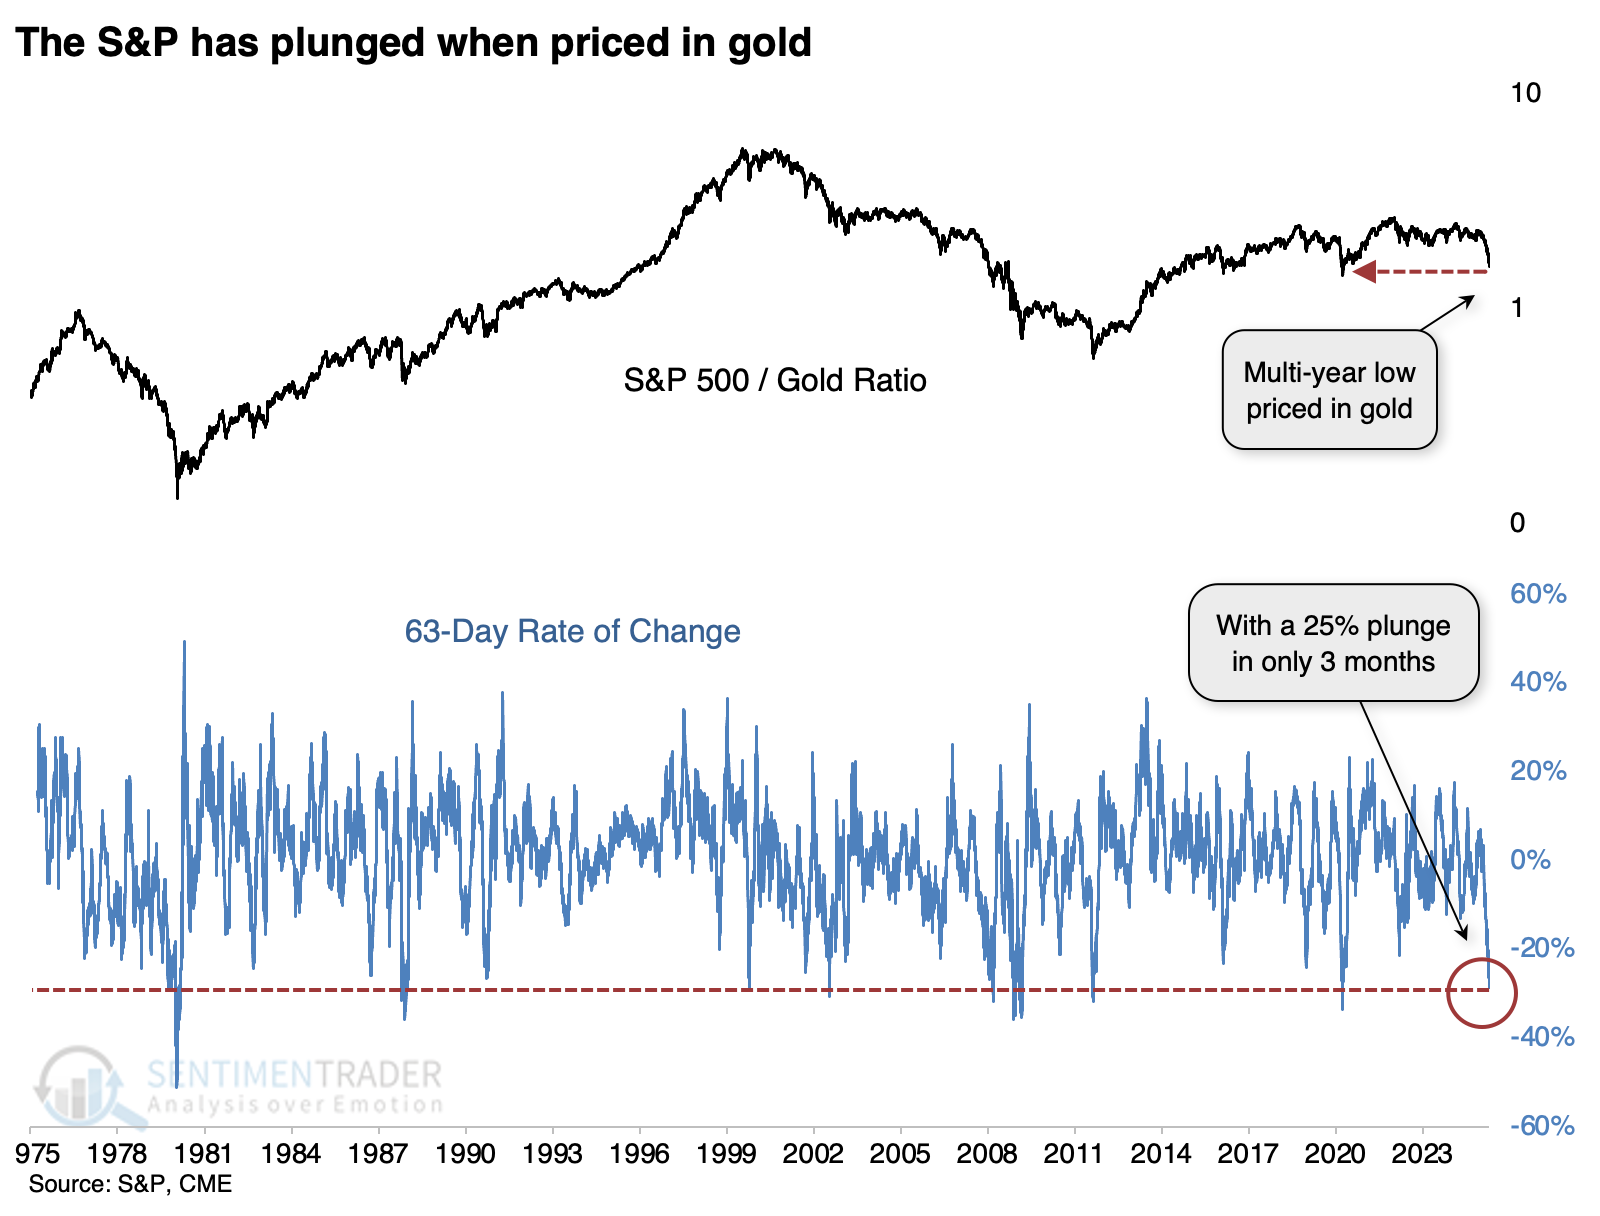
These extremes tended to occur due to a combination of stocks dropping and gold rising, instead of only one side of the equation making a parabolic move.

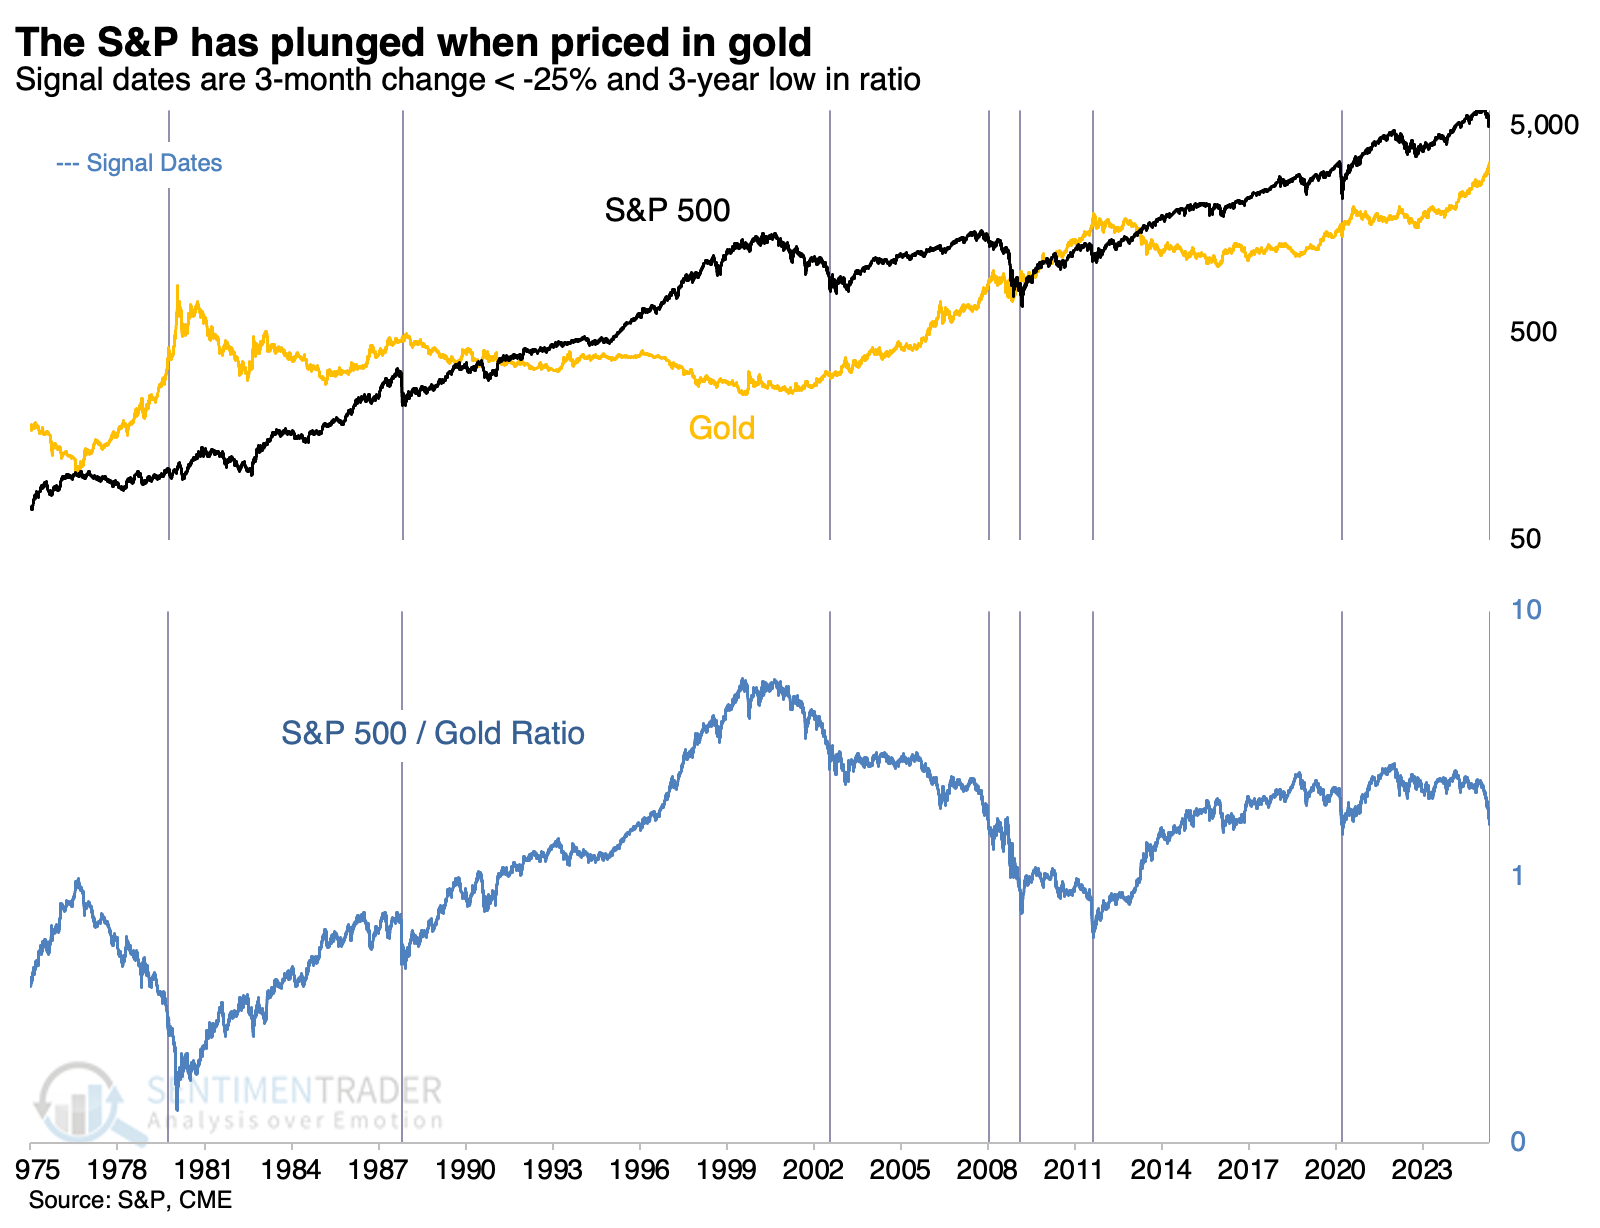
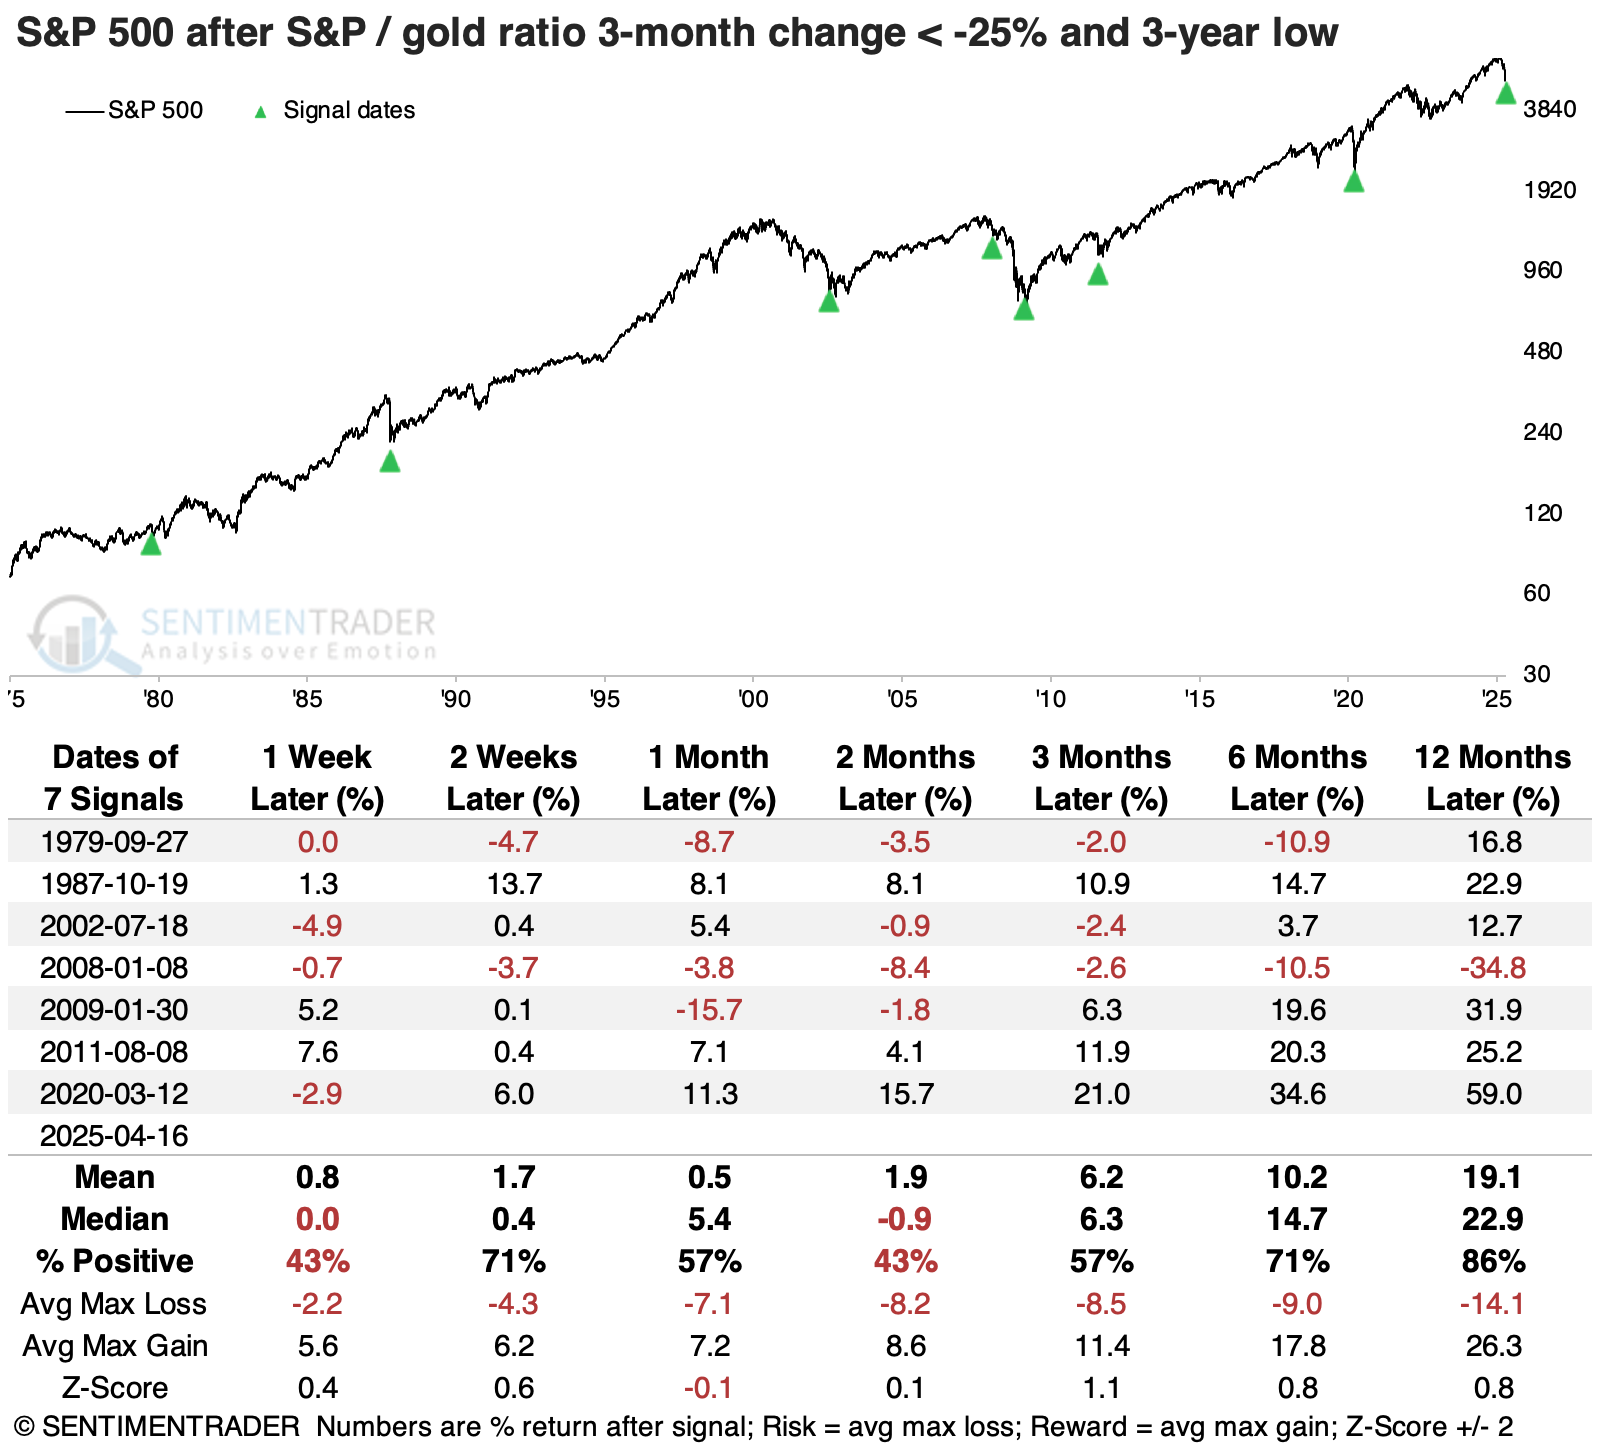
The chart below shows the signal dates, when the S&P 500 / gold ratio dropped at least 25% in three months to at least a 3-year low, with the S&P 500's return over the following year from each signal. It was mostly positive, with the notable exception of 2008.

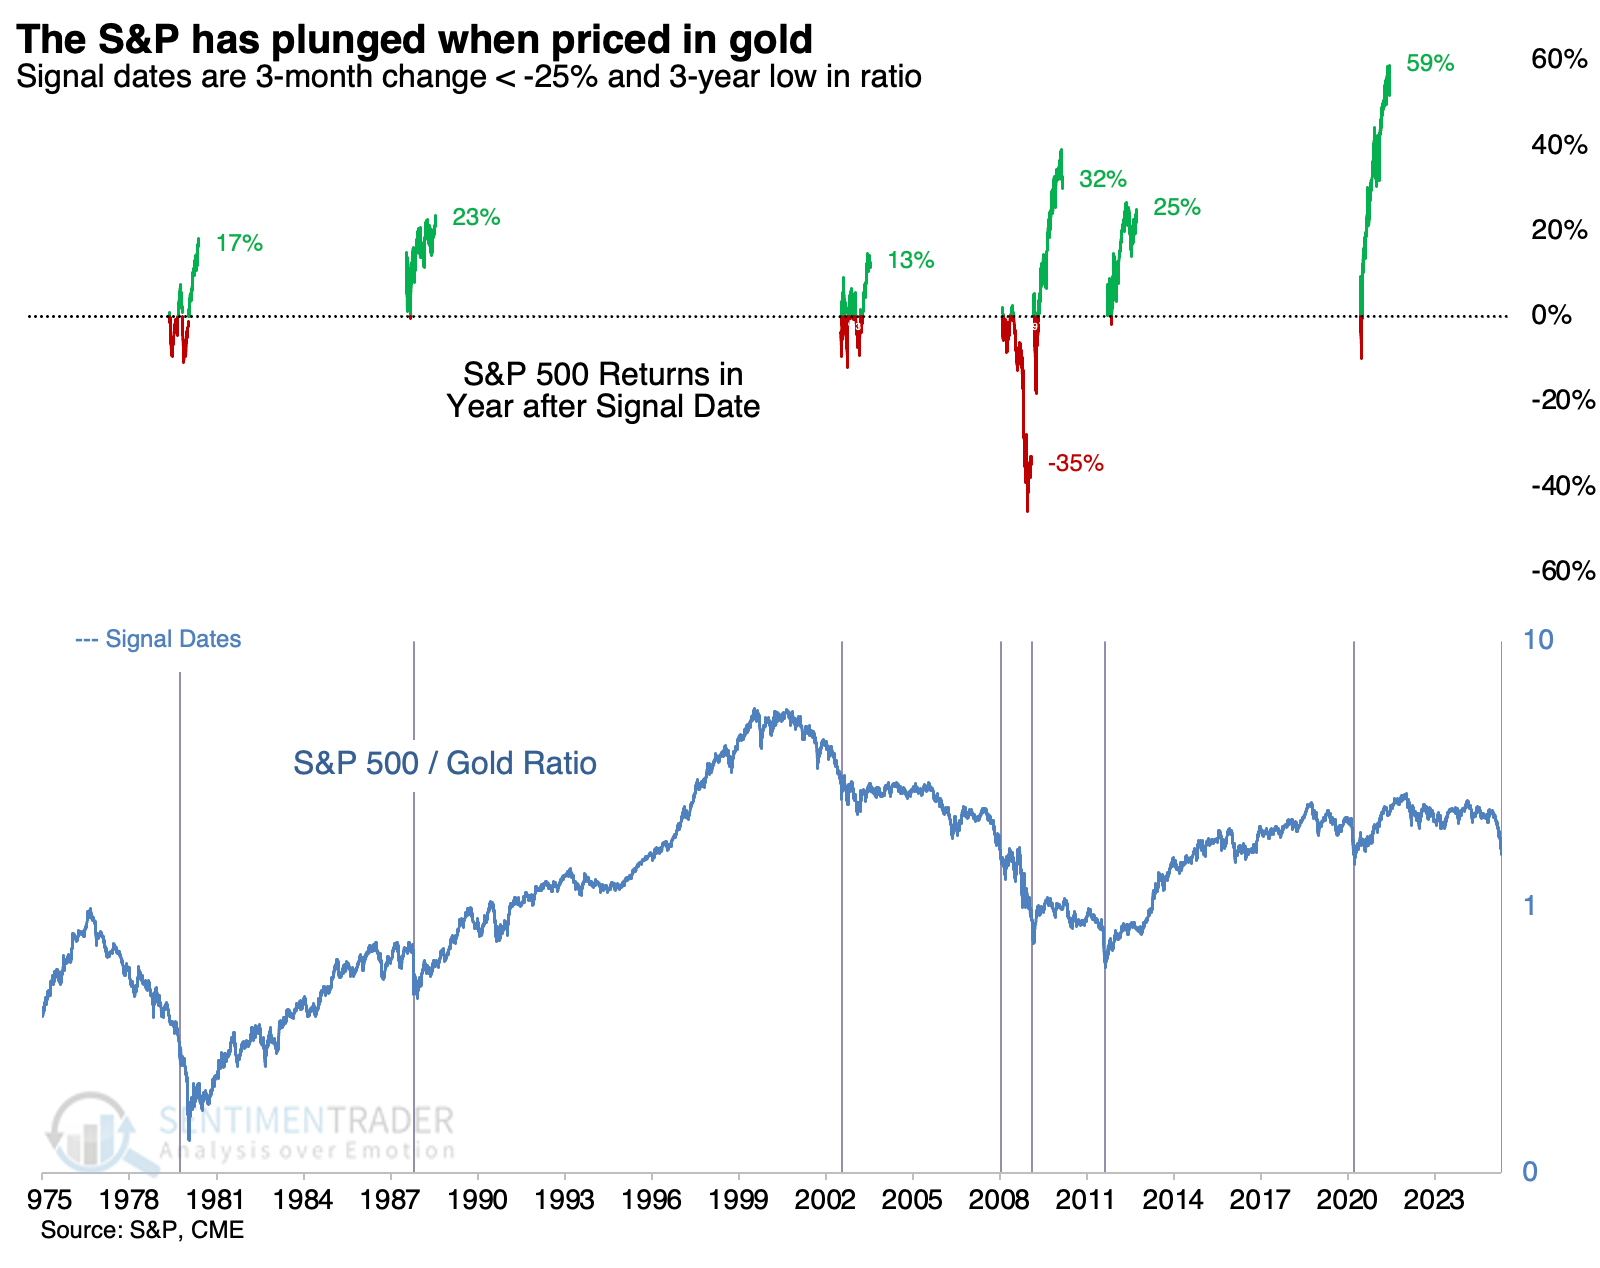
The table below shows the dates and returns for those who prefer numbers. We can see that over the next two months, the S&P's risk/return profile was uninspiring, but over the following year, it showed double-digit gains except for the disastrous signal ahead of the 2008 financial crisis.

Gold's prospects

Gold didn't fare as well, though we can see from the graph of return that it was still mostly positive over longer time frames.

The table of returns shows volatile performance over the following several months, often oscillating between gains and losses. Even so, it was positive after six of the seven signals over the following six months.

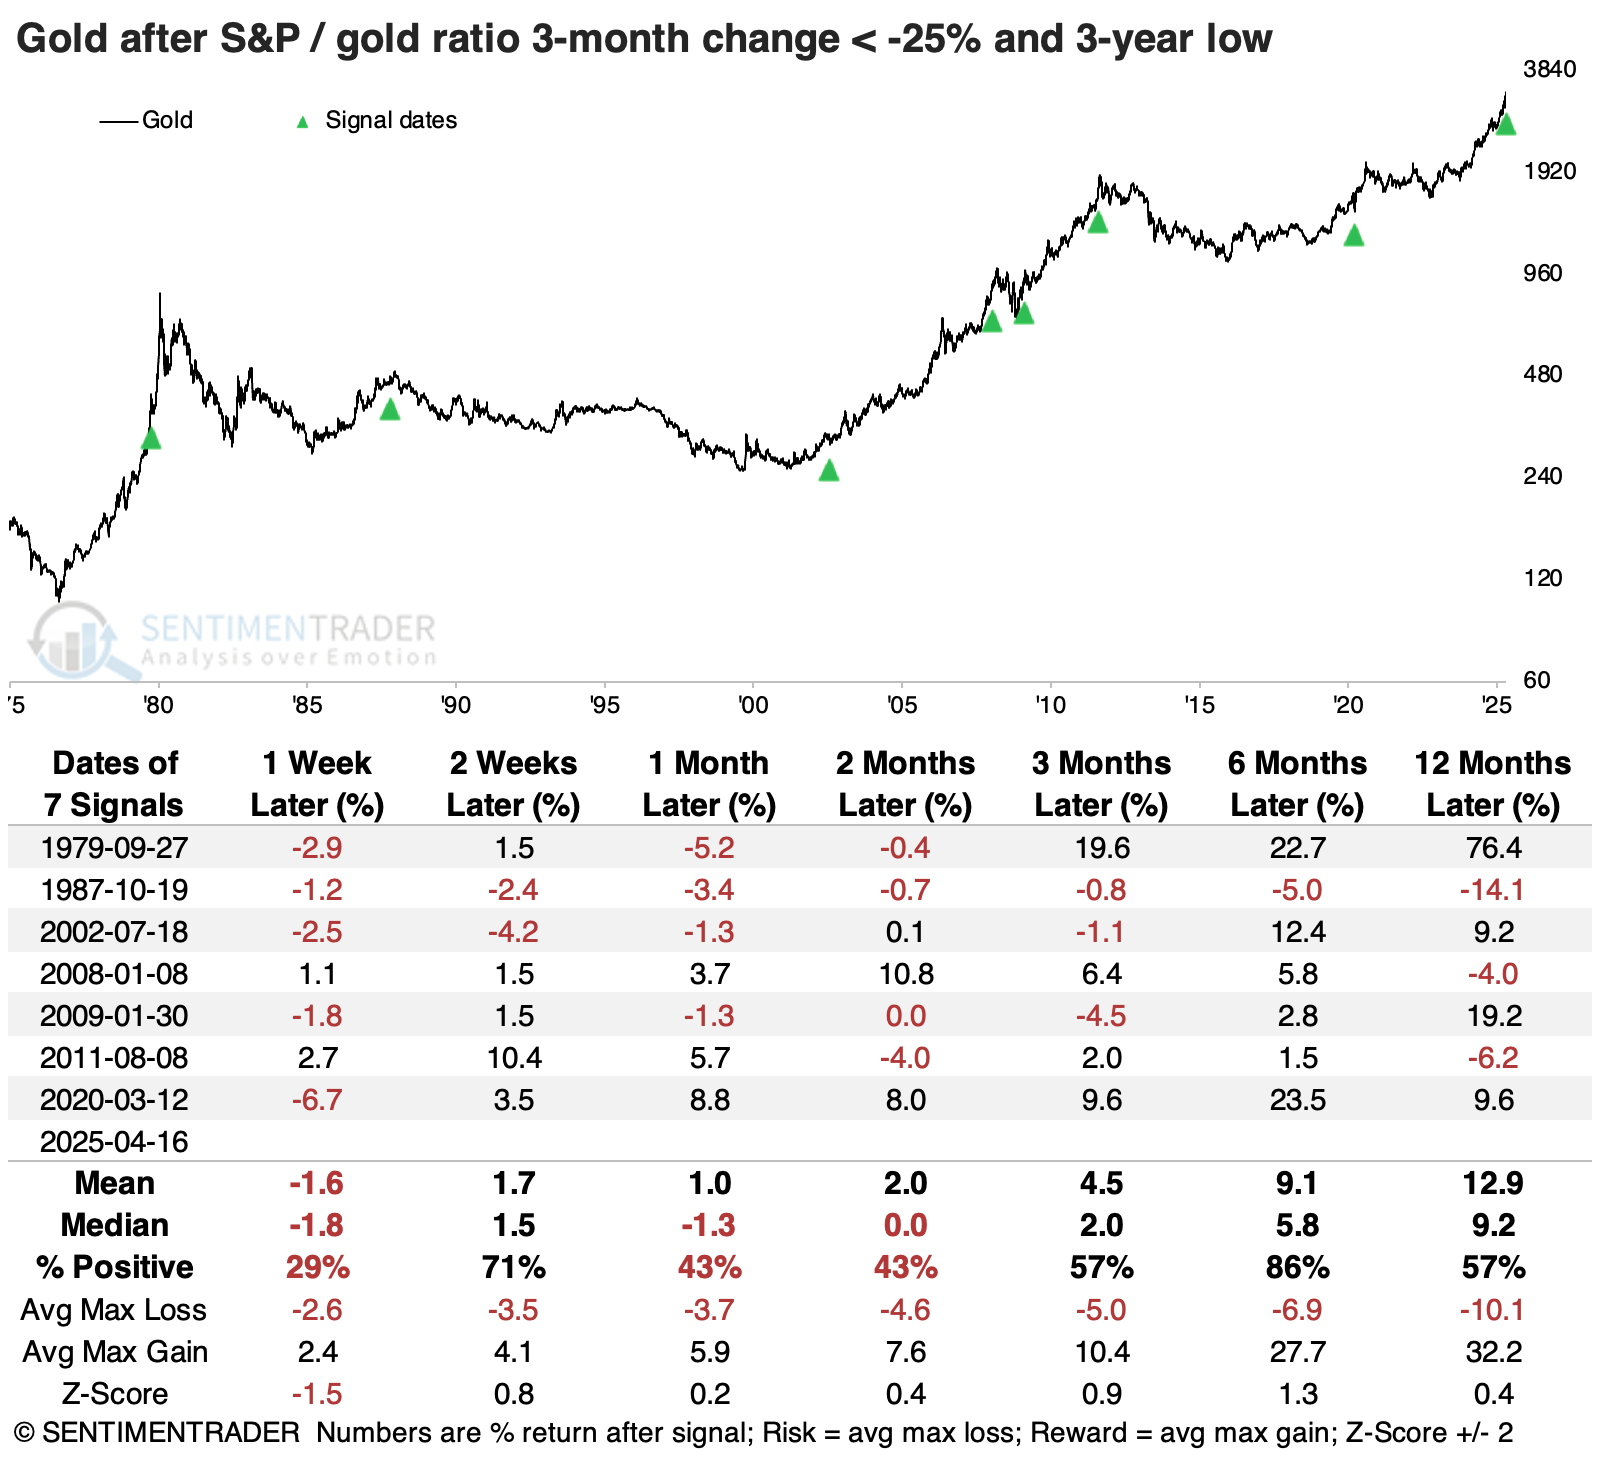
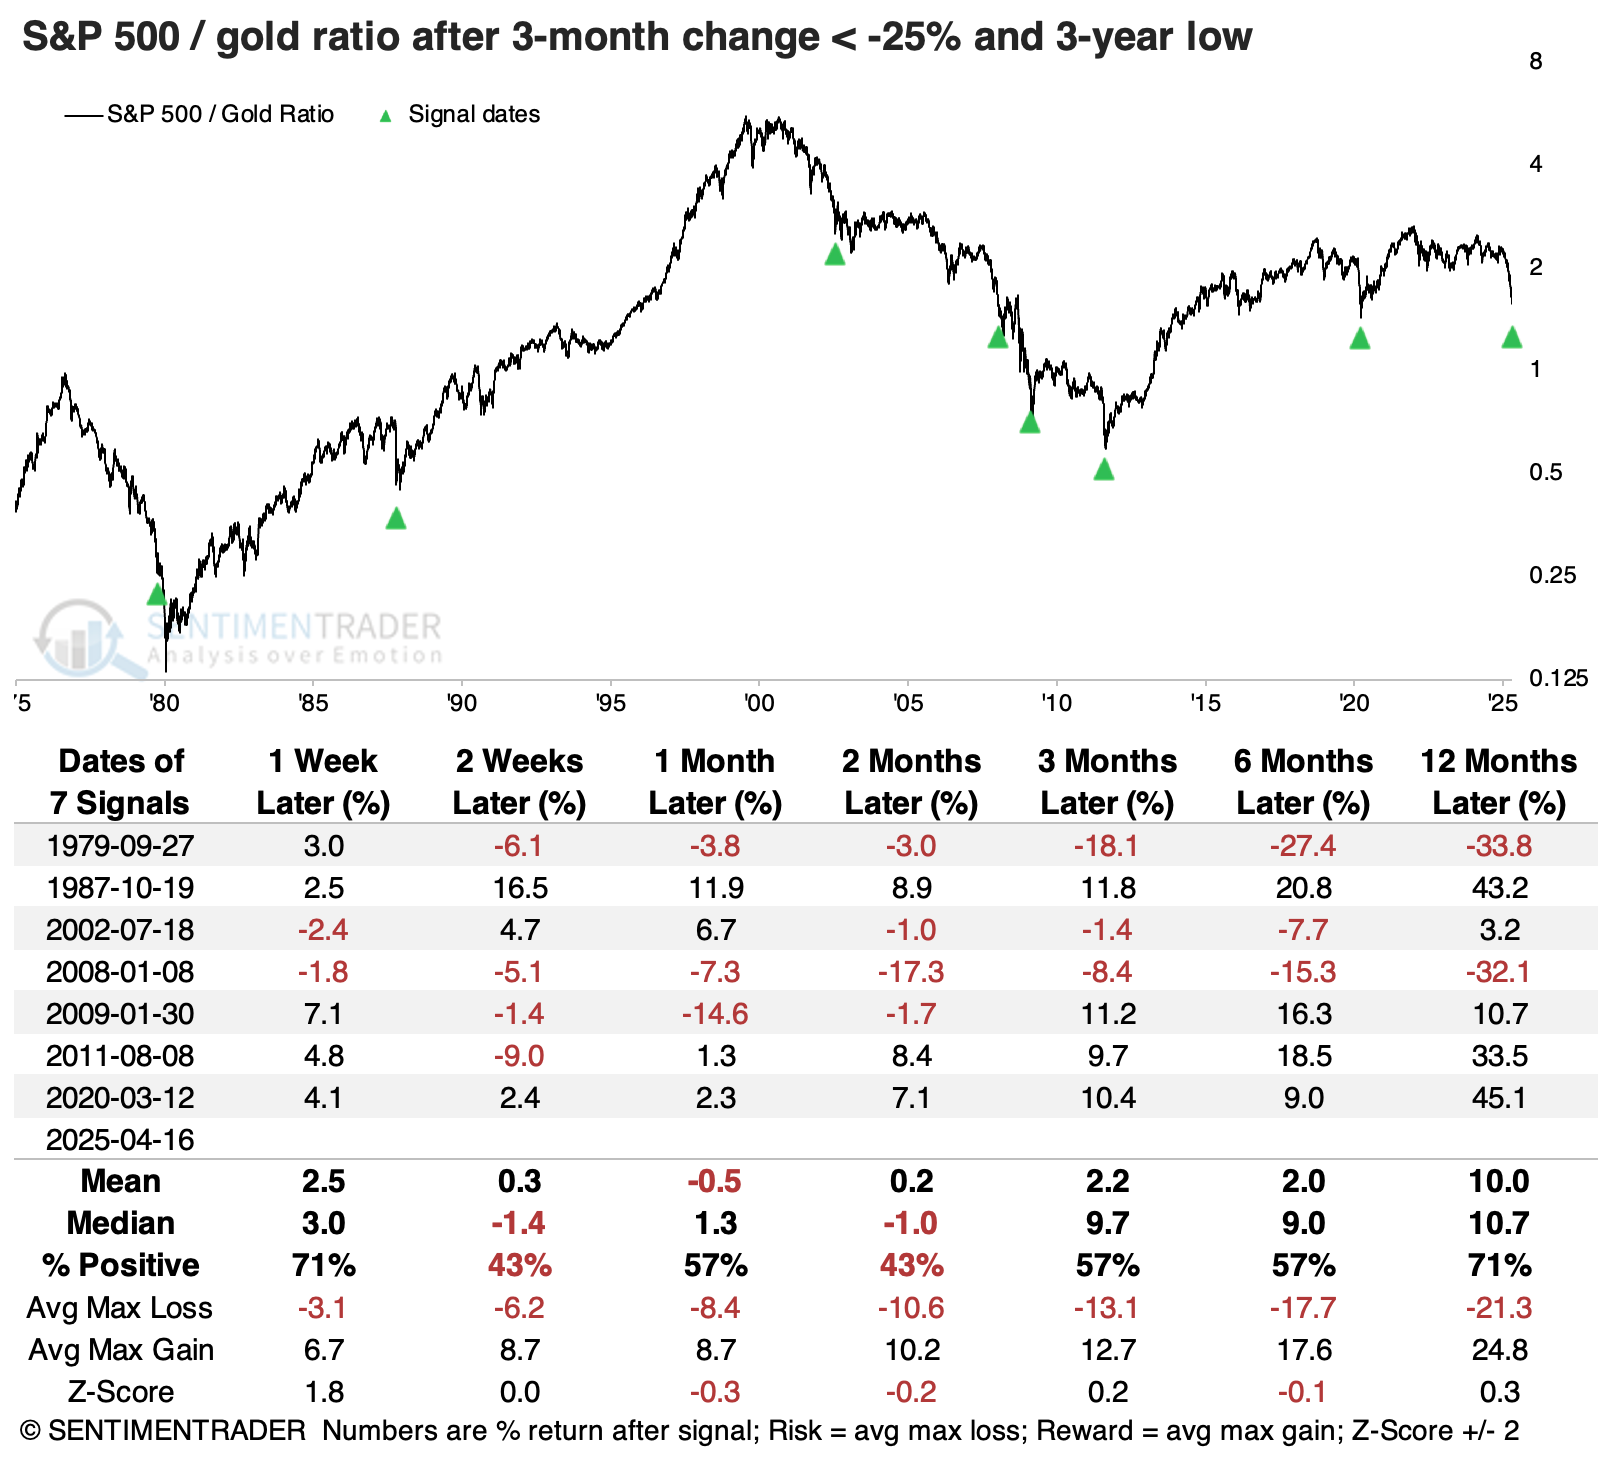
The ratio between the two assets was mixed, gyrating between positive and negative for months. Over the following year, the S&P 500 outperformed gold five of seven times, but the two times it didn't, it really didn't.

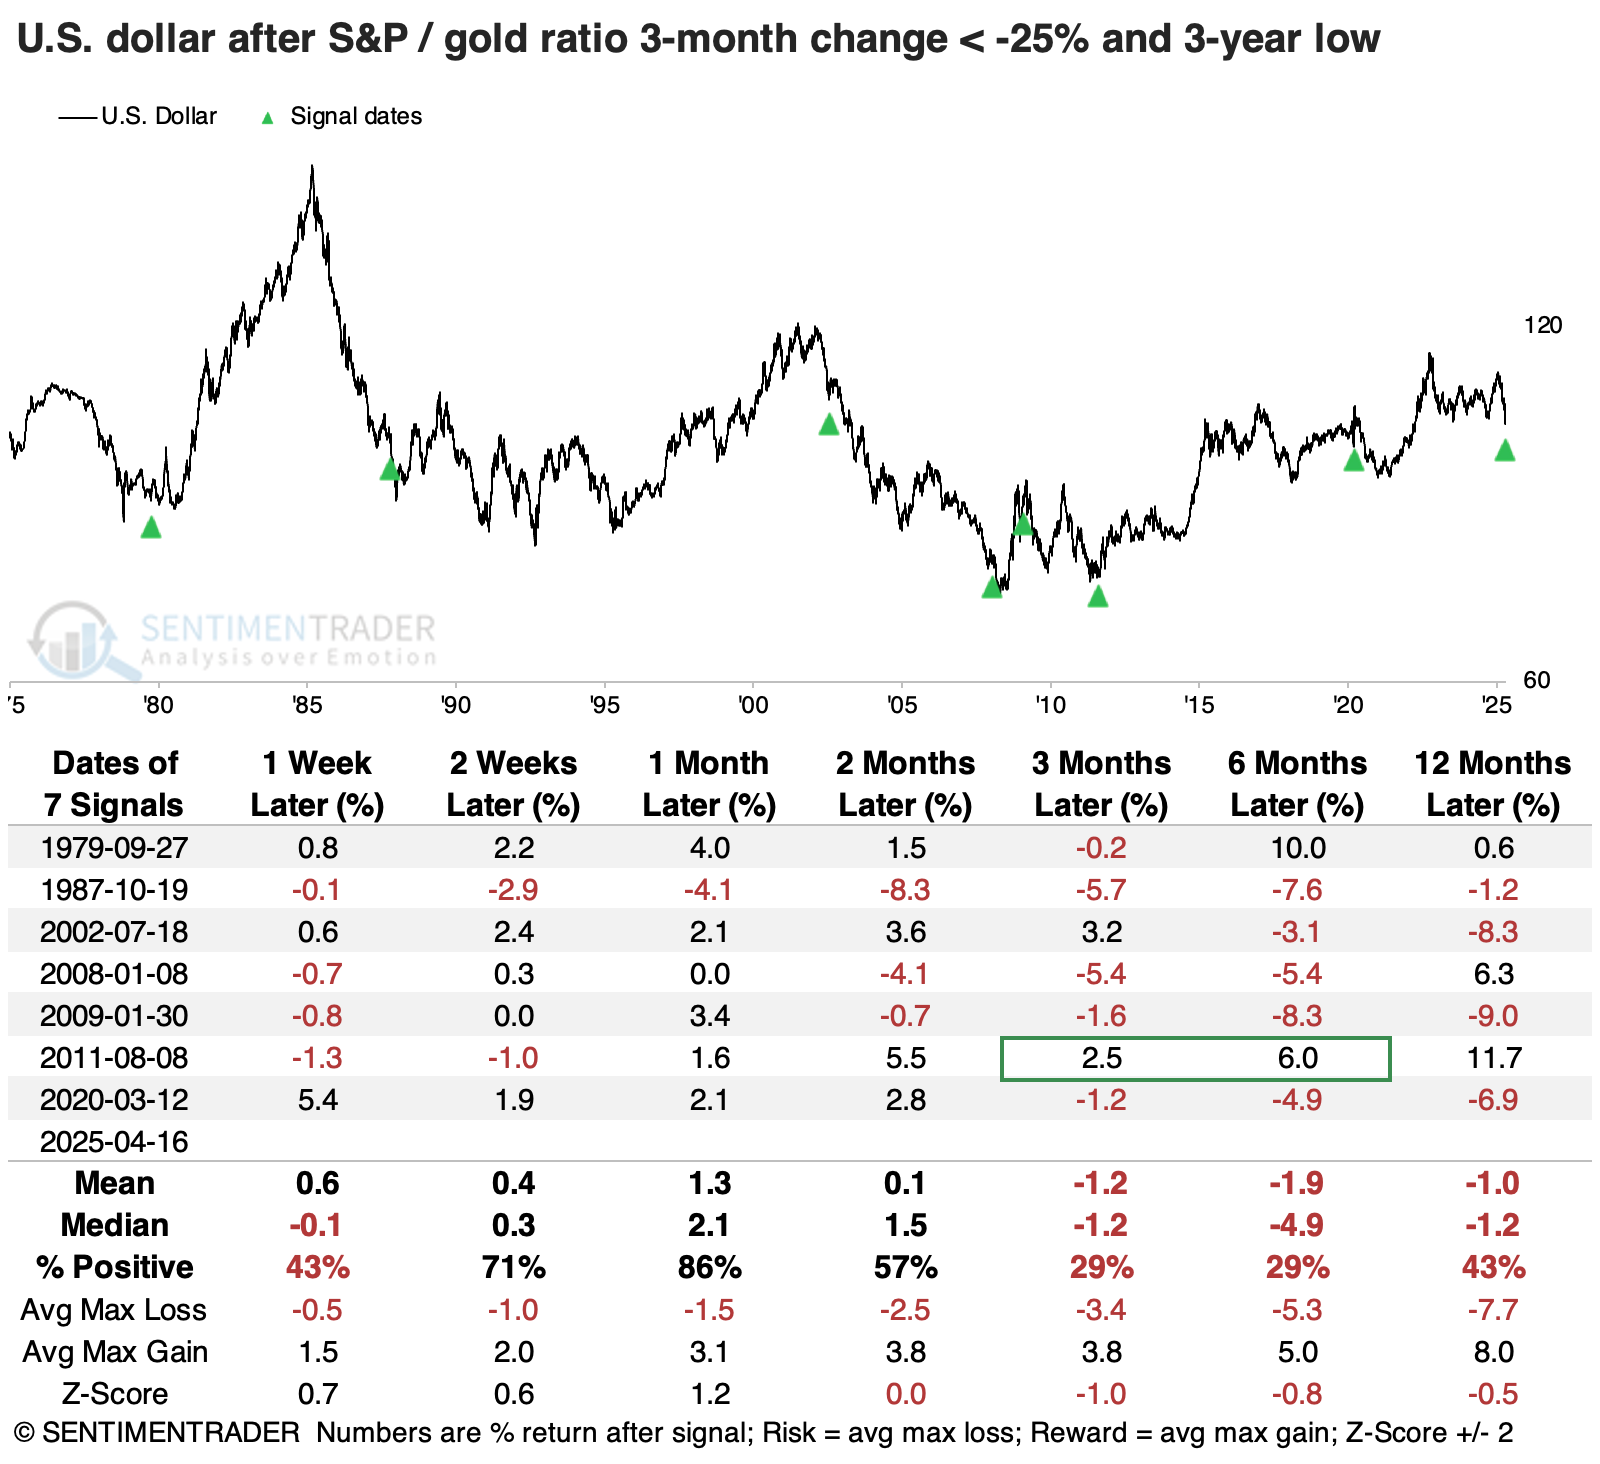
Since gold tended to drop over shorter time frames and rise over longer ones, it makes sense that the U.S. dollar showed the opposite pattern, and it does. A month after these signals, the dollar rose every time but once, but it declined either three or six months later every time but once.

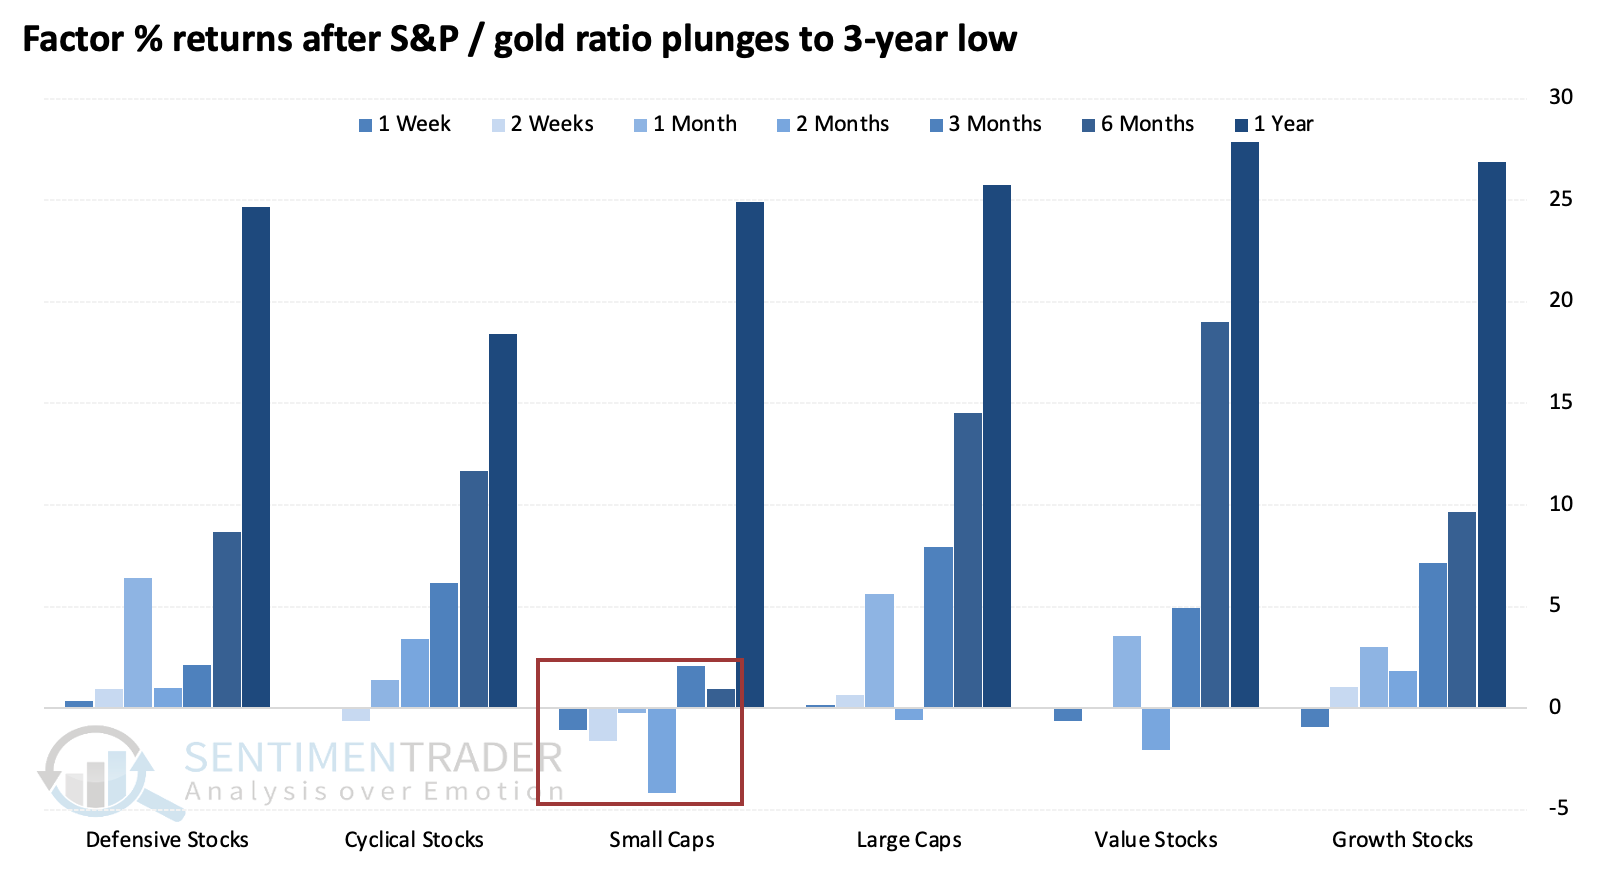
As we've seen repeatedly lately, small caps lagged over several months, but their one-year return neared 25%.

What the research tells us...

Markets far and wide are making extreme moves, and core among them are stocks and gold. The volatility has been great enough to register among the most extreme moves in 50 years, and such uncertainty has typically been a sign that investors extrapolated too much negativity in U.S. stocks.

After similar extremes in the S&P 500 relative to gold, the equity index tended to form long-term bottoms, with the notable exception of the 2008 global financial crisis. Gold's performance after these extremes was mostly weak short-term, but without much long-term damage over the next six months, as the dollar tended to decline over that time frame.

PRODUCTS
SentimenTrader
Trading Tools
Indicators & Data API
‍
Strategies & Scanner
‍
Research Reports
FREE
RESOUrCES
Simple Backtest
Calculator
Simple Seasonality
Calculator
The Kelly Criterion
Calculator
Sentiment Geo Map
‍
Public Research Reports
‍
Education
Sentiment Indicators
‍
Technical Indicators
‍
Pricing
Bundle pricing
‍
FAQ
‍
Announcements
‍
COMPANY
‍
About
‍
In the News
‍
Testimonials
‍
Client Success Stories
CONTACT
‍
General Inquiries
‍
Media Inquiries
‍
Financial Professionals Inquiries
‍
© 2026 Sundial Capital Research Inc. All rights reserved.
Setsail Marketing
TermsPrivacyAffiliate Program
Risk Disclosure: The information and tools provided are for research and analytical purposes only and are not intended as investment advice. Market analysis involves uncertainty, and outcomes may differ from expectations. Users should conduct their own due diligence and consider their individual circumstances before making any financial decisions. Past performance is not necessarily indicative of future results.

Hypothetical Performance Disclosure: Hypothetical performance results have many inherent limitations, some of which are described below. No representation is being made that any account will or is likely to achieve profits or losses similar to those shown; in fact, there are frequently sharp differences between hypothetical performance results and the actual results subsequently achieved by any particular trading program. One of the limitations of hypothetical performance results is that they are generally prepared with the benefit of hindsight. In addition, hypothetical trading does not involve financial risk, and no hypothetical trading record can completely account for the impact of financial risk of actual trading. for example, the ability to withstand losses or to adhere to a particular trading program in spite of trading losses are material points which can also adversely affect actual trading results. There are numerous other factors related to the markets in general or to the implementation of any specific trading program which cannot be fully accounted for in the preparation of hypothetical performance results and all which can adversely affect trading results.

Testimonial Disclosure: Testimonials appearing on this website may not be representative of other clients or customers and is not a guarantee of future performance or success.