Products
SentimenTrader Trading Tools
‍
Backtest Engine
My Trading Toolkit
Correlation Analysis
Seasonality
Market Prediction
Indicators & Data API
‍
Proprietary Indicators & Charts
Market Data API
Strategies & Scanner
‍
50+ Trading Strategies
Smart Stock Scanner
Smart Option Scanner
Research Reports
‍
Research Solutions
Reports Library
Free Resources
Simple Backtest Calculator
Simple Seasonality Calculator
The Kelly Criterion Calculator
Sentiment Geo Map
Public Research Reports
Education
Sentiment Indicators
Technical Indicators
Pricing
Company
About
In the News
Testimonials
Client Success Stories
Contact
Log inLoginSign up
< BACK TO ALL REPORTS

The S&P 500 formed a two-day bullish reversal pattern

Dean Christians
2025-03-17
The S&P 500 completed a rare reversal pattern last week, lending additional evidence to the idea of a near-term rally toward resistance around 5830.

Key points:

  • The S&P 500 closed at a 5-month low on Thursday before rebounding on Friday, finishing up 2%
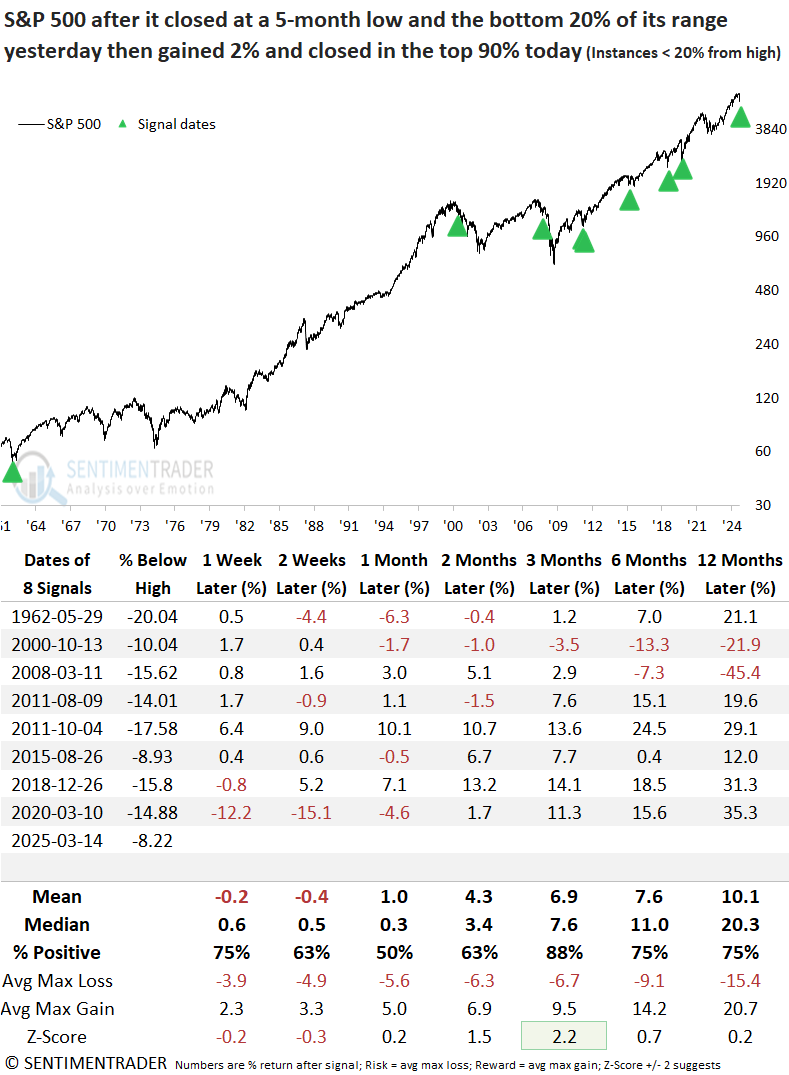
  • Following similar price patterns, the S&P 500 advanced 88% of the time over the next three months

Did Friday's reversal signal that the S&P 500 has found a bottom? 

In my report last Friday, I outlined the typical path for the S&P 500 after a 10% correction, which indicated a relief rally followed by a retest of the lows. In today's report, I'll examine the price action from the last two sessions to determine if it strengthens the case for a bounce.

After closing at a 5-month low and in the bottom 20% of its daily range on Thursday, the S&P 500 staged a strong rebound on Friday, finishing above the 90th percentile of its range with a gain of over 2%. 

Although this appears to be a bullish reversal setup, it's essential to remain objective and let the data guide our outlook rather than relying on the eye test. 

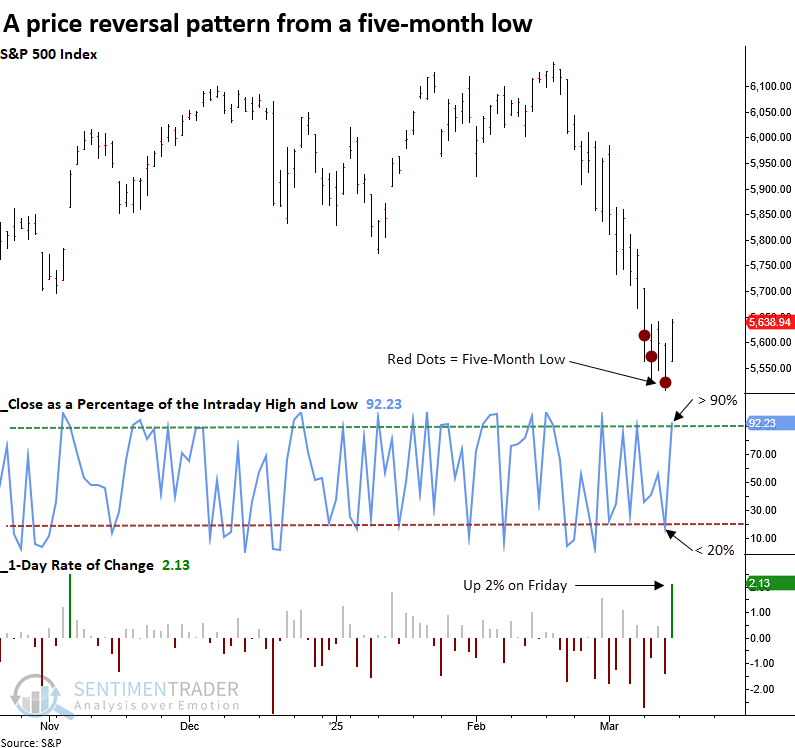
Keep in mind that intraday high and low data for the S&P 500 started being collected in 1957, which limits this price pattern study from the typical starting point of 1928 when daily closing data for the index became available. 

Similar price patterns suggest the S&P 500 could bounce

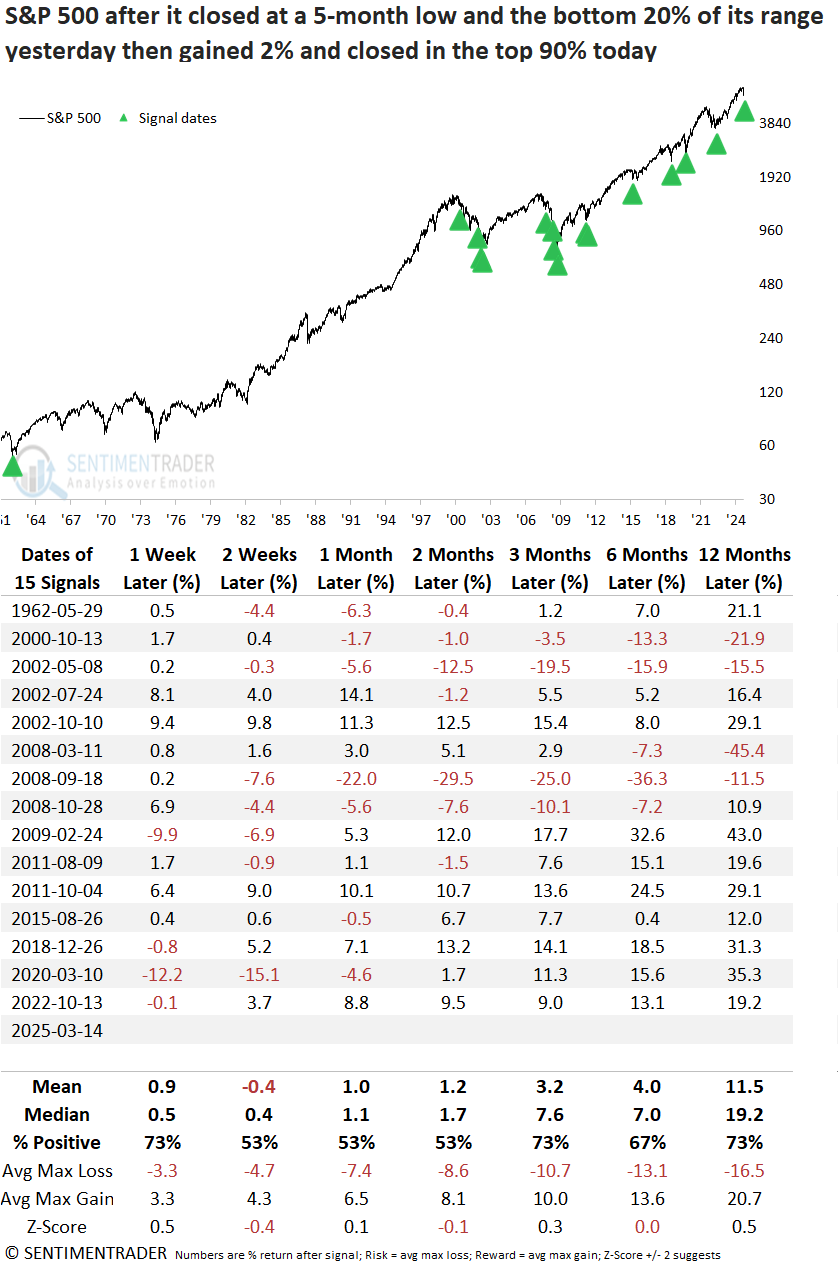
Whenever the S&P 500 experienced a two-day reversal pattern, as outlined above, the world's most benchmarked index tended to increase over the subsequent week, rallying 73% of the time. However, it lost momentum between two and eight weeks later, showing a 53% win rate before resuming its rally, indicating a typical bottoming pattern

Several precedents occurred in 2002 and 2008, the depths of severe bear markets, a scenario vastly different from now.

While the sample size is smaller, when the reversal pattern appears with the S&P 500 less than 20% below a high-correction territory - a similar pattern emerges: an initial bounce, a stall, and another rally. The three-month outlook improved notably, with gains in all but one instance. 

Even in the most challenging scenarios, such as 2000 and 2008, the S&P 500 closed higher at some point during the first three months, allowing traders to adjust their positions. 

A potential path

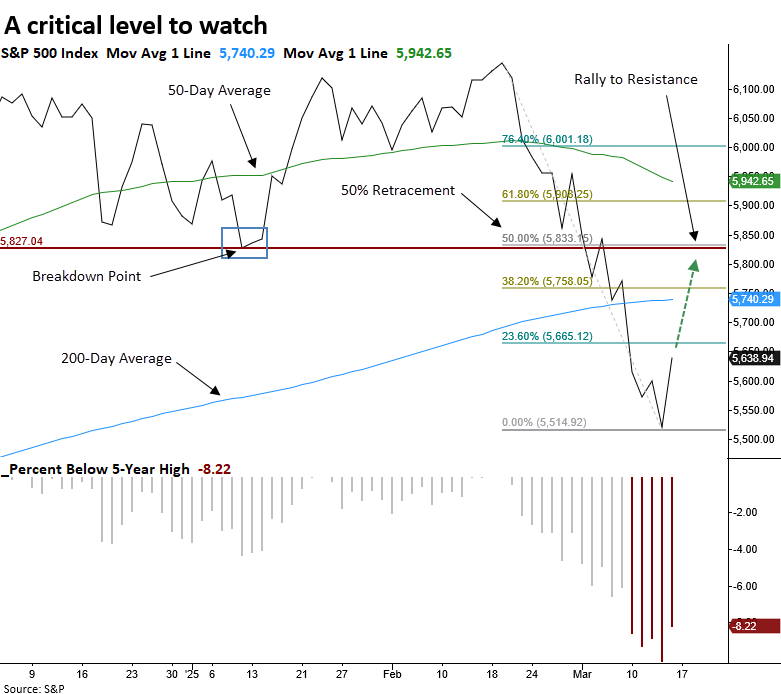
There are several resistance points for the S&P 500, with the 200-day moving average at approximately 5740 as the initial hurdle. Still, I would expect the breakdown level from January 10, 2025, and the 50% retracement of the February-March decline, both around 5830, to serve as the most pivotal area. 

What the research tells us...

The S&P 500 endured a quick correction, falling 10% over 16 sessions. Such rapid sell-offs often lead to a relief rally. The two-day reversal pattern seen in the large-cap index late last week suggests that a bounce is underway, potentially reaching the 5830 breakdown point, which coincides with the 50% retracement of the 10% decline. Nevertheless, traders should prepare for a potential retest of the lows, as V-shaped bottoms are exceedingly rare without a significant catalyst.

PRODUCTS
SentimenTrader
Trading Tools
Indicators & Data API
‍
Strategies & Scanner
‍
Research Reports
FREE
RESOUrCES
Simple Backtest
Calculator
Simple Seasonality
Calculator
The Kelly Criterion
Calculator
Sentiment Geo Map
‍
Public Research Reports
‍
Education
Sentiment Indicators
‍
Technical Indicators
‍
Pricing
Bundle pricing
‍
FAQ
‍
Announcements
‍
COMPANY
‍
About
‍
In the News
‍
Testimonials
‍
Client Success Stories
CONTACT
‍
General Inquiries
‍
Media Inquiries
‍
Financial Professionals Inquiries
‍
© 2026 Sundial Capital Research Inc. All rights reserved.
Setsail Marketing
TermsPrivacyAffiliate Program
Risk Disclosure: The information and tools provided are for research and analytical purposes only and are not intended as investment advice. Market analysis involves uncertainty, and outcomes may differ from expectations. Users should conduct their own due diligence and consider their individual circumstances before making any financial decisions. Past performance is not necessarily indicative of future results.

Hypothetical Performance Disclosure: Hypothetical performance results have many inherent limitations, some of which are described below. No representation is being made that any account will or is likely to achieve profits or losses similar to those shown; in fact, there are frequently sharp differences between hypothetical performance results and the actual results subsequently achieved by any particular trading program. One of the limitations of hypothetical performance results is that they are generally prepared with the benefit of hindsight. In addition, hypothetical trading does not involve financial risk, and no hypothetical trading record can completely account for the impact of financial risk of actual trading. for example, the ability to withstand losses or to adhere to a particular trading program in spite of trading losses are material points which can also adversely affect actual trading results. There are numerous other factors related to the markets in general or to the implementation of any specific trading program which cannot be fully accounted for in the preparation of hypothetical performance results and all which can adversely affect trading results.

Testimonial Disclosure: Testimonials appearing on this website may not be representative of other clients or customers and is not a guarantee of future performance or success.