
The S&P 500 completes a base breakdown pattern

Key points
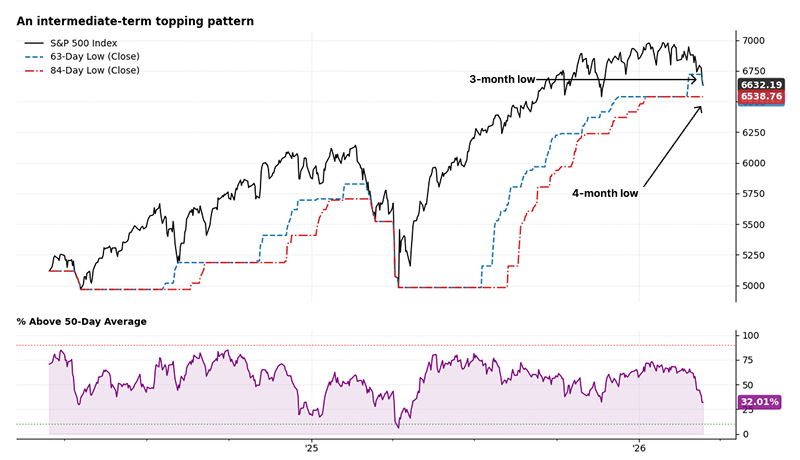
- The S&P 500 hit a 3-month low but averted a 4-month low, effectively completing a topping pattern.
- Historically, when this occurs while the index remains above its 200-day moving average, it signals the end of a pullback rather than the start of a bear market, boasting a 72% win rate over the next month.
- Intermediate-term market breadth has weakened significantly, with the percentage of S&P 500 stocks above their 50-day moving average falling below 40%.
A normal pullback or something more?
Last week, the S&P 500 Index continued its decline, hitting a 3-month low but falling short of a 4-month low, effectively completing a topping pattern. Unsurprisingly, this drop triggered the typical wave of negative reactions across social media.
The question is whether this pattern is a sign of a more profound structural breakdown or just a standard pullback within an ongoing uptrend. As always, we will take an objective, data-driven approach to analyze potential forward returns following the appearance of similar technical patterns.
Similar drops within an uptrend lead to positive returns
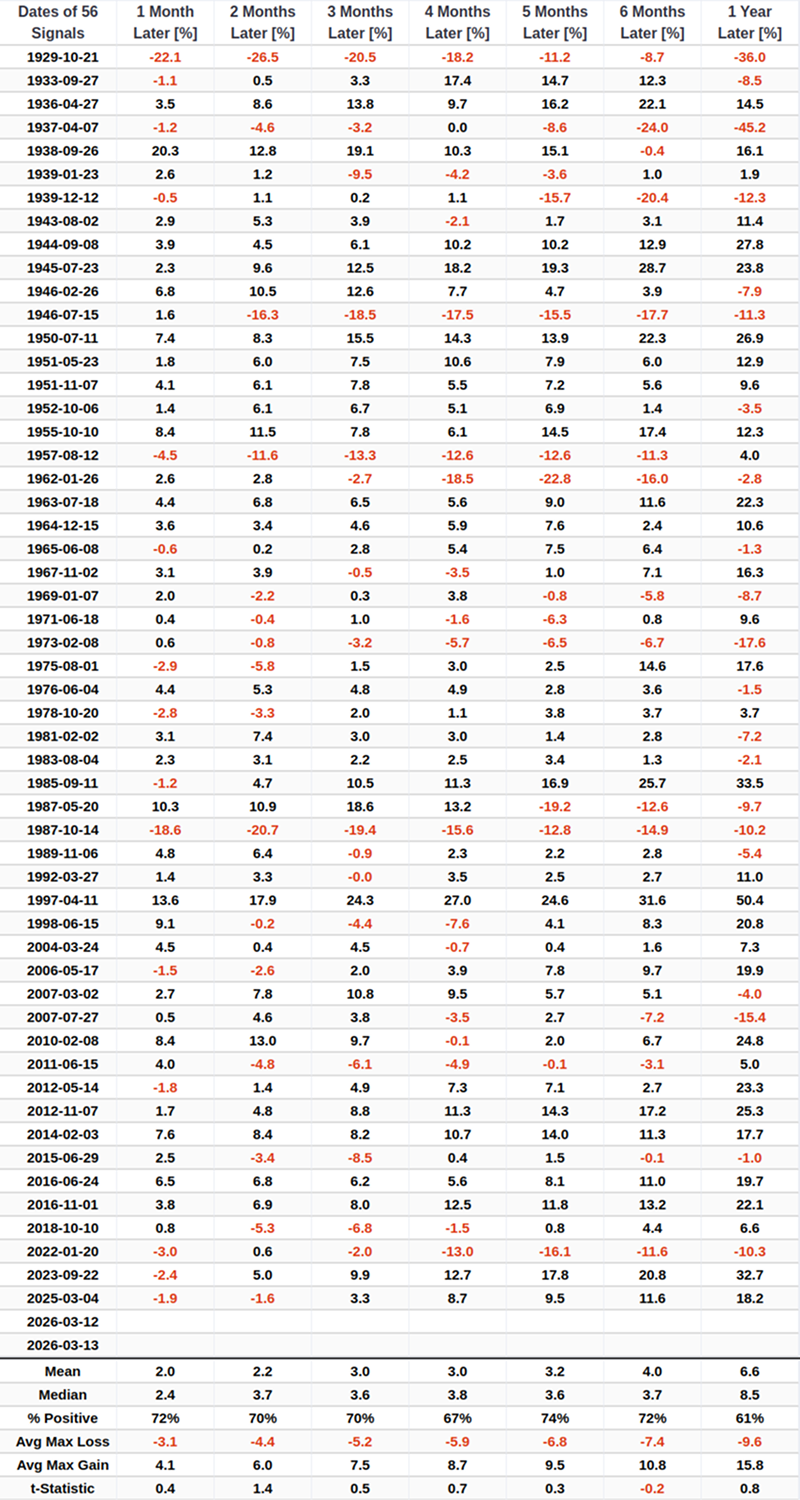
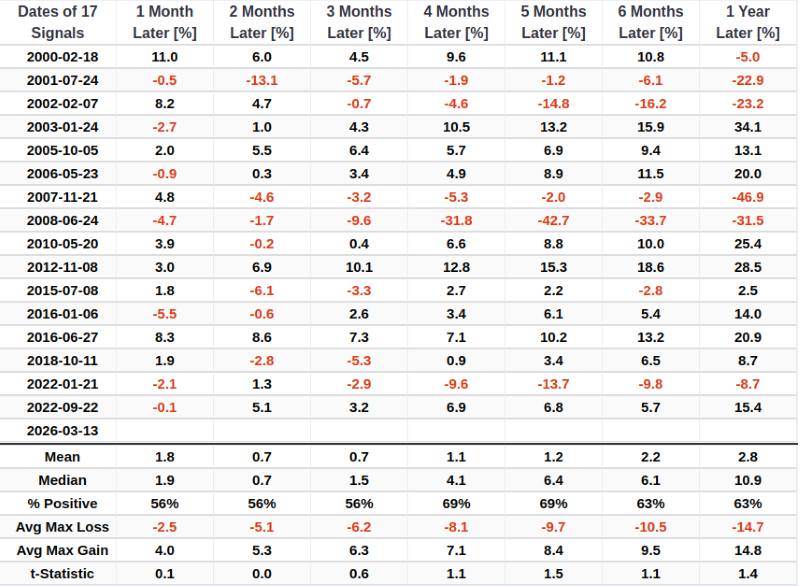
When the S&P 500 closes at a 3-month low (but not a 4-month low) while remaining above its 200-day moving average, this type of decline is often closer to the tail end of a corrective phase rather than the beginning of a new bear market. One month later, the S&P 500 has a 72% probability of rising, with a median gain of 2.4%. For related backtest, click here.
Additional context from market breadth
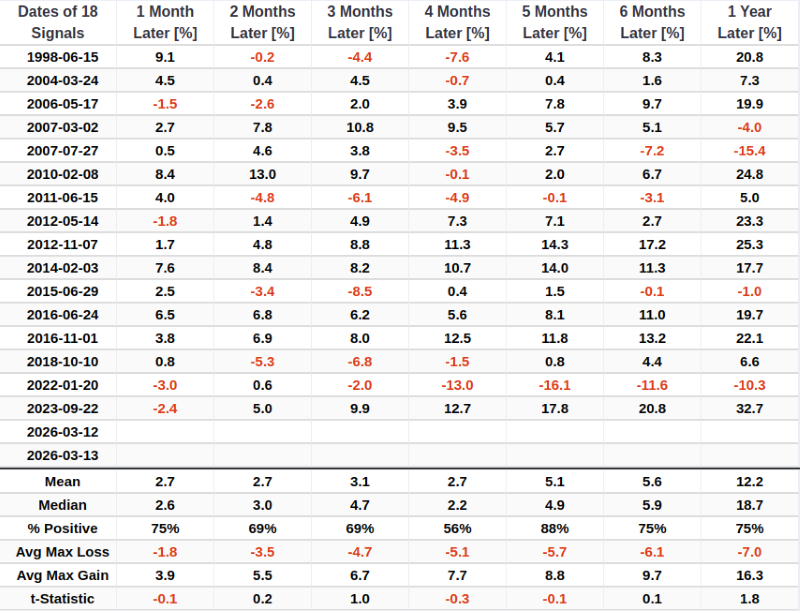
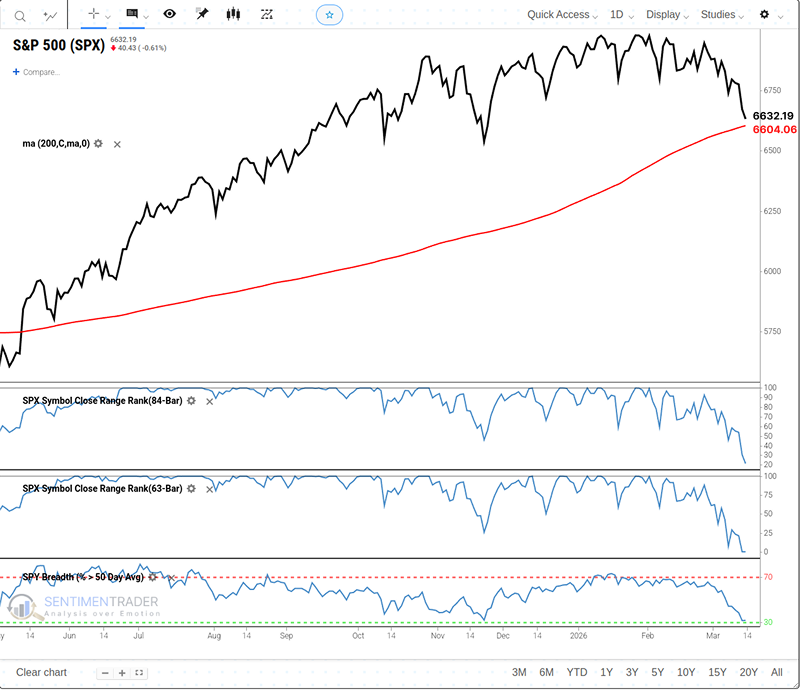
Last Wednesday, an intermediate-term market breadth indicator-the SPY Breadth (% > 50 Day Avg)-dropped below 40%, with its latest reading at 32.01%. When the S&P 500 completes this specific downward breakdown while the percentage of constituent stocks closing above their 50-day moving average is below 40%, the forward returns and win rates for the index generally improve slightly. For related backtest, click here.
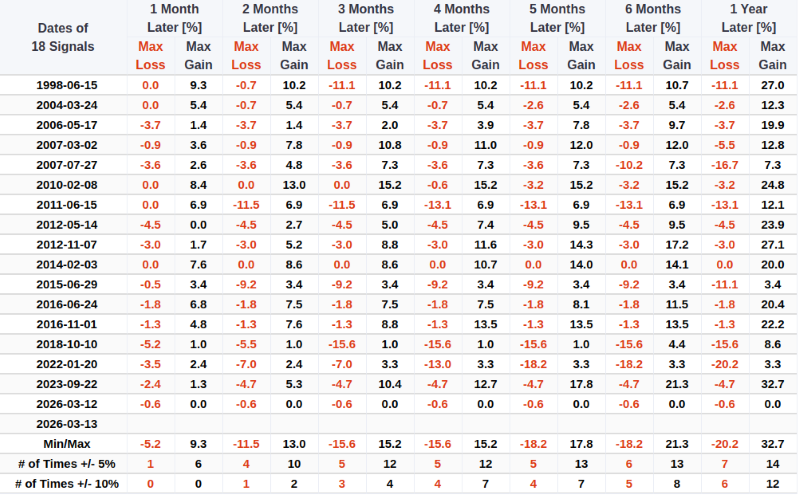
However, the downside risks associated with this signal must still be respected. Drawdowns greater than 10% have occurred across multiple timeframes. To improve our edge, we generally prefer setups where the reward-to-risk ratio (Maximum Gain / Maximum Loss) is greater than 3.
The 200-day moving average is the line in the sand
It is worth noting that the long-term uptrend hangs in the balance, with the S&P 500 now within striking distance of its 200-day moving average (~6,604). A decisive break below this level would invalidate the long-term bullish structure, while a hold could offer a floor for a potential rebound.
If the S&P 500 closes at a 3-month low (but not a 4-month low) and is below its 200-day moving average, the decline tends to persist. Under these conditions, the forward returns and win rates for the S&P 500 are expected to be relatively weak compared to when the index is trading above its 200-day moving average.
Outlook based on intermediate-term breadth
When the proportion of S&P 500 stocks trading above their 50-day moving average drops below 40% but remains above 30%, the annualized return for the S&P 500 struggles to reach 14%, as this ideal scenario does not occur frequently
However, if an increasing number of stocks break below their intermediate-term trendlines and this indicator drops below 20%, it often precedes a bullish reversal (an extreme oversold bounce). Furthermore, forward returns become highly attractive as more stocks recover from these oversold conditions and resume their uptrends.
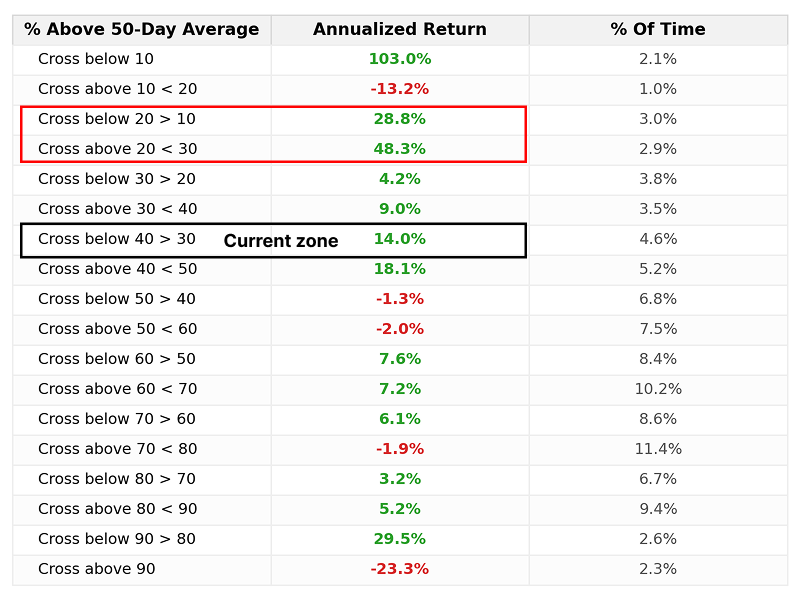
Note: Annualized returns are calculated using the arithmetic mean of SPX next-day performance after the indicator crosses into each directional decile. (Data since 1998).
What the research tells us...
The S&P 500 has completed a topping pattern by breaking support and closing at a 3-month low (but averting a 4-month low). Historically, when this type of breakdown occurs within the context of a long-term uptrend (price > 200-day MA), it usually acts as a flush-out, leading to solid returns and high win rates over the subsequent months. With fewer than 40% of S&P 500 constituents currently trading above their 50-day moving averages, the index's forward returns and win probabilities are slightly enhanced. If this intermediate breadth metric continues to wash out to extreme oversold levels or begins to reverse higher, annualized returns improve significantly.
However, it remains crucial to emphasize that this signal performs best when the long-term trend is intact. The index is testing its 200-day moving average; a failure here dramatically shifts the risk profile to the downside. As always, historical backtests do not guarantee future results, and no single indicator is infallible.