Products
SentimenTrader Trading Tools
‍
Backtest Engine
My Trading Toolkit
Correlation Analysis
Seasonality
Market Prediction
Indicators & Data API
‍
Proprietary Indicators & Charts
Market Data API
Strategies & Scanner
‍
50+ Trading Strategies
Smart Stock Scanner
Smart Option Scanner
Research Reports
‍
Research Solutions
Reports Library
Free Resources
Simple Backtest Calculator
Simple Seasonality Calculator
The Kelly Criterion Calculator
Sentiment Geo Map
Public Research Reports
Education
Sentiment Indicators
Technical Indicators
Pricing
Company
About
In the News
Testimonials
Client Success Stories
Contact
Log inLoginSign up
< BACK TO ALL REPORTS

The S&P 500 completes a base breakdown pattern

Dean Christians
2023-09-25
The S&P 500 completed a topping pattern when the index undercut support and closed at a 3-month low but not a 4-month. In an uptrend like now, similar base breakdowns often occur closer to the conclusion of a corrective phase rather than its outset.

Key points:

  • The S&P 500 closed at a 3-month low but not a 4-month low, completing a base breakdown
  • Similar topping patterns in an uptrend led to bullish results for the S&P 500 over the subsequent month
  • Signals that coincided with an oversold condition demonstrated marginally more favorable outcomes

A base breakdown with the S&P 500 in an uptrend

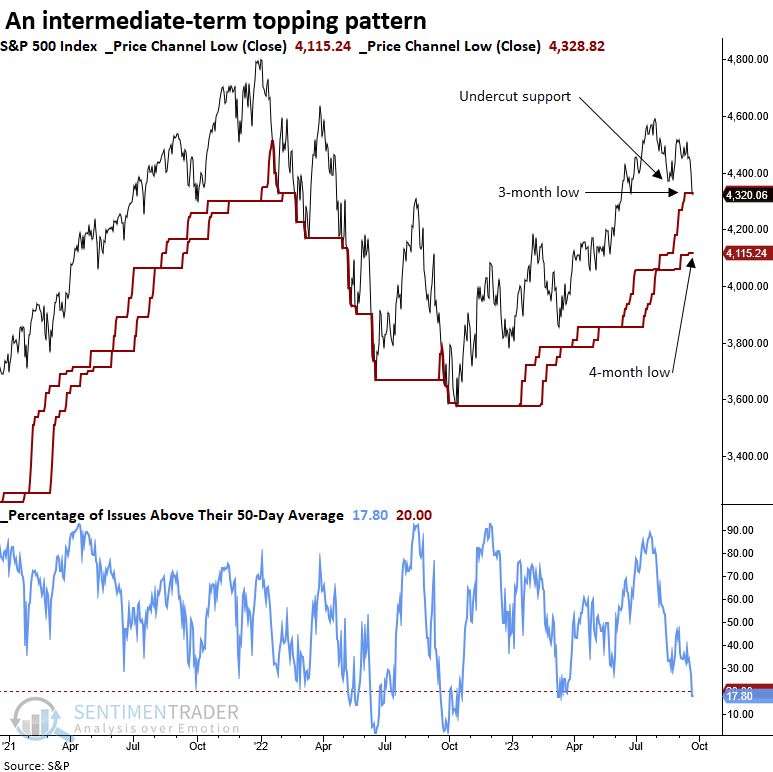
Last week, the S&P 500 undercut support below the August low and registered a new 3-month low but not a 4-month low, completing a topping pattern. Of course, the breakdown elicited the typical negative response from the social media crowd.  

Whether the pattern turns out to be something more significant or a garden variety correction in an uptrend remains to be seen. As always, we will use an objective and unbiased approach to analyzing the potential outlook after similar patterns.

Similar breakdown patterns preceded positive returns for the S&P 500

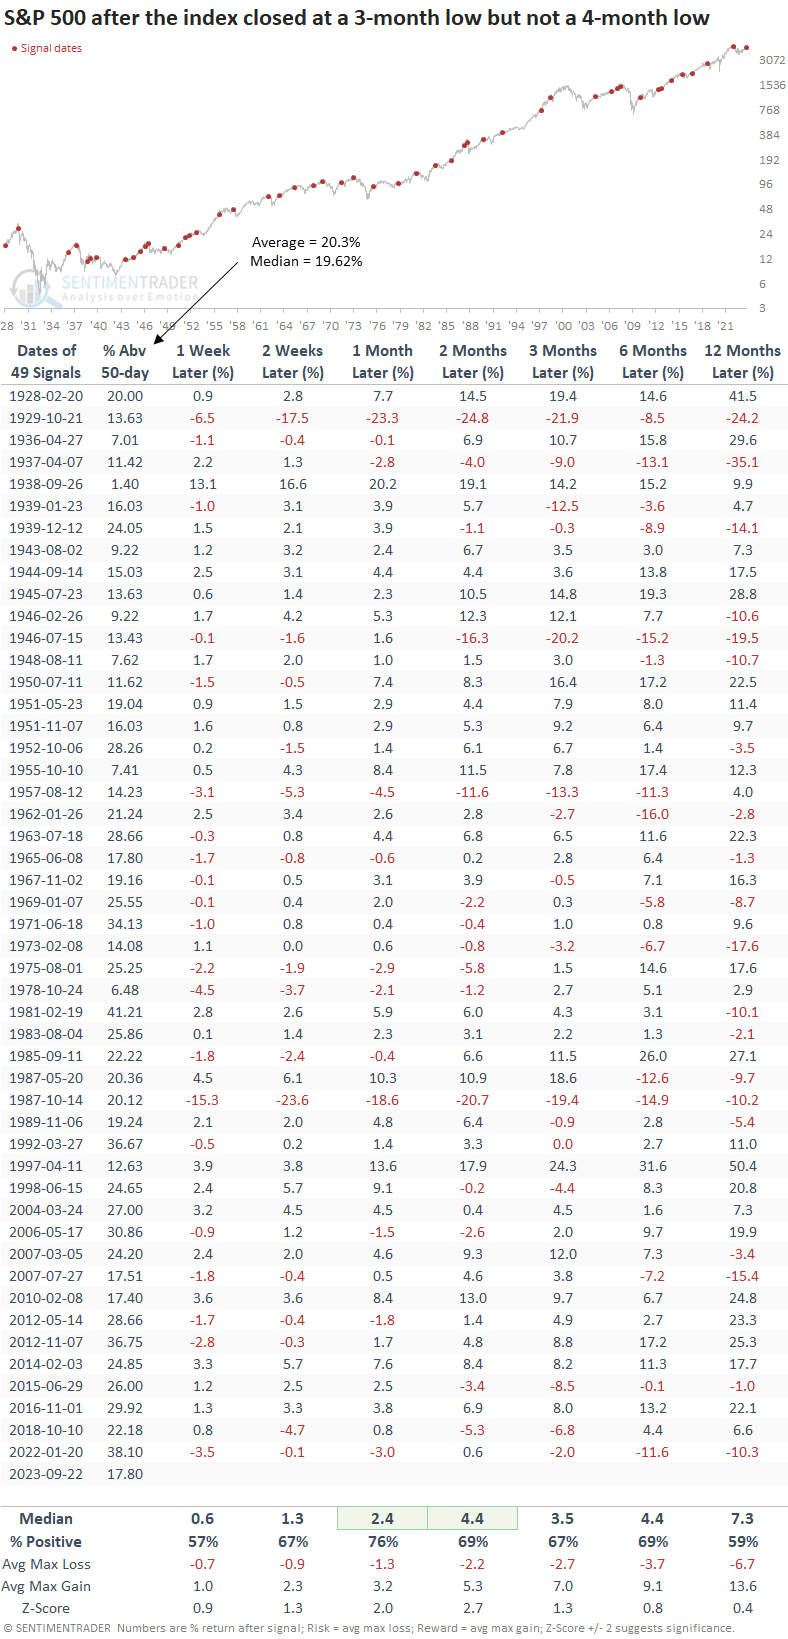
When the S&P 500 closed at a 3-month low but not a 4-month low, with the index above its 200-day average, the breakdown tends to be closer to the end of a corrective phase rather than the beginning. A month later, the S&P 500 was higher 76% of the time, with a median gain of 2.4%. Additionally, the one and two-month horizons show gains that are significant relative to the median gain over the study period.

Additional context

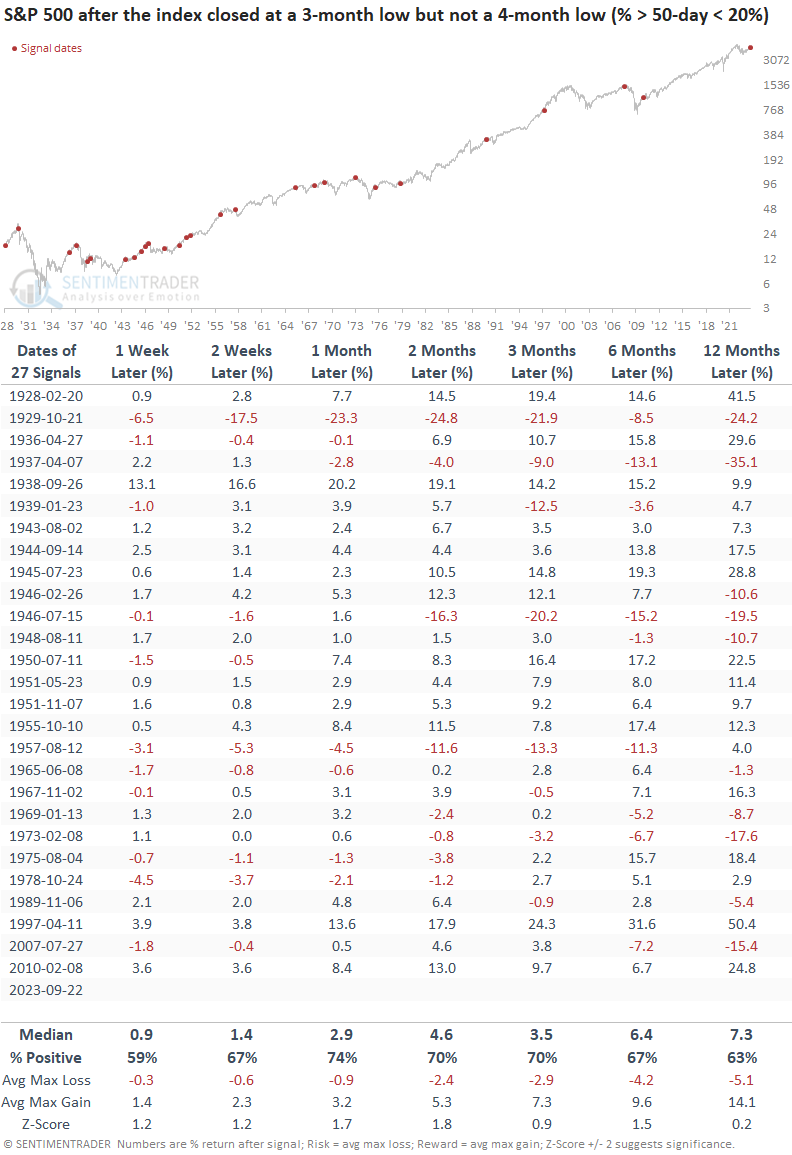
On Friday, an intermediate-term breadth indicator, the percentage of S&P 500 issues trading above their respective 50-day average, crossed below 20%, indicating an oversold condition. When the base breakdown pattern occurs, and fewer than 20% of issues close above their 50-day average, the S&P 500 displays slightly more favorable returns and win rates. So, the oversold condition generates some buying interest from traders.

The outlook for the S&P 500 based on an intermediate-term market breadth indicator

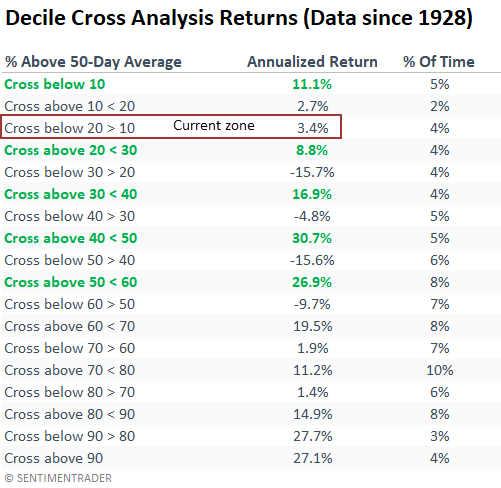
When the percentage of S&P 500 issues above their 50-day average crosses below 20% but remains above 10%, the S&P 500 tends to struggle with an annualized gain of 3.4%, significantly underperforming annual returns since 1928.

However, should more and more stocks fall below their medium-term trend, good things tend to happen when the reading dips below 10%. Additionally, returns are outstanding when more stocks recapture their uptrend from an oversold condition.

What the research tells us...

The S&P 500 completed a topping pattern when the index undercut support and closed at a 3-month low but not a 4-month. Similar base breakdowns in an uptrend led to solid returns, win rates, and z-scores over the next few months. When the pattern occurs with fewer than 20% of S&P 500 issues above their 50-day average, the world's most benchmarked index exhibits slightly more favorable returns and win rates. Should medium-term uptrends fall or rise from the current level, annualized returns will improve significantly.

PRODUCTS
SentimenTrader
Trading Tools
Indicators & Data API
‍
Strategies & Scanner
‍
Research Reports
FREE
RESOUrCES
Simple Backtest
Calculator
Simple Seasonality
Calculator
The Kelly Criterion
Calculator
Sentiment Geo Map
‍
Public Research Reports
‍
Education
Sentiment Indicators
‍
Technical Indicators
‍
Pricing
Bundle pricing
‍
FAQ
‍
Announcements
‍
COMPANY
‍
About
‍
In the News
‍
Testimonials
‍
Client Success Stories
CONTACT
‍
General Inquiries
‍
Media Inquiries
‍
Financial Professionals Inquiries
‍
© 2026 Sundial Capital Research Inc. All rights reserved.
Setsail Marketing
TermsPrivacyAffiliate Program
Risk Disclosure: The information and tools provided are for research and analytical purposes only and are not intended as investment advice. Market analysis involves uncertainty, and outcomes may differ from expectations. Users should conduct their own due diligence and consider their individual circumstances before making any financial decisions. Past performance is not necessarily indicative of future results.

Hypothetical Performance Disclosure: Hypothetical performance results have many inherent limitations, some of which are described below. No representation is being made that any account will or is likely to achieve profits or losses similar to those shown; in fact, there are frequently sharp differences between hypothetical performance results and the actual results subsequently achieved by any particular trading program. One of the limitations of hypothetical performance results is that they are generally prepared with the benefit of hindsight. In addition, hypothetical trading does not involve financial risk, and no hypothetical trading record can completely account for the impact of financial risk of actual trading. for example, the ability to withstand losses or to adhere to a particular trading program in spite of trading losses are material points which can also adversely affect actual trading results. There are numerous other factors related to the markets in general or to the implementation of any specific trading program which cannot be fully accounted for in the preparation of hypothetical performance results and all which can adversely affect trading results.

Testimonial Disclosure: Testimonials appearing on this website may not be representative of other clients or customers and is not a guarantee of future performance or success.