
The smell of fear starting to creep into several sectors

Key points
- Signs of overdone fear in the market continue to pile up
- In this piece, we look at recent Component Correlation and Panic Breadth Composite examples in Materials, Energy, and Technology
- While indicator signals continue to pile, investors should still be prepared for extreme volatility as tariff-related uncertainty remains
Materials
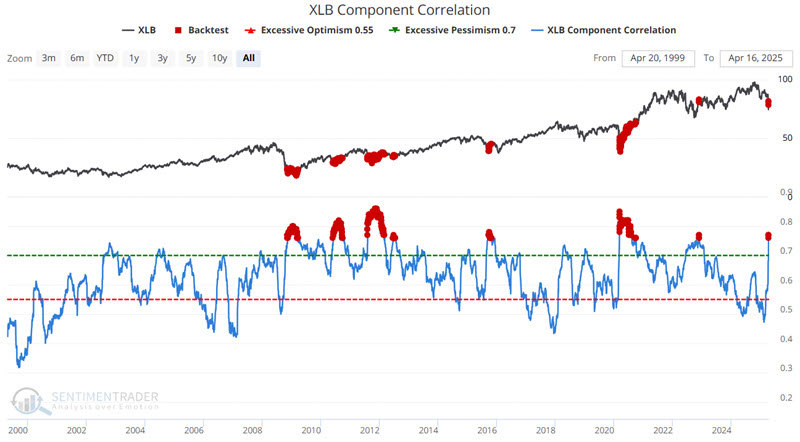
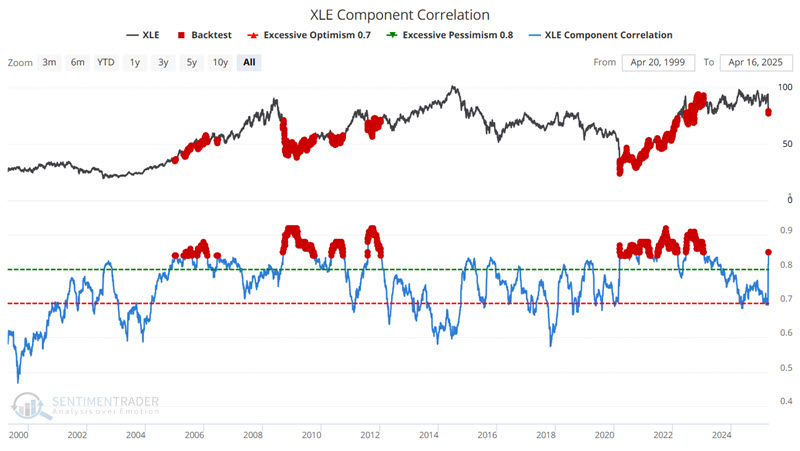
Our Component Correlation indicator shows the correlation among members of the Sector. During times of panic, investors tend to buy or sell "everything" together, no matter their merits, so correlation rises. The higher it goes, the more we see groupthink, which tends to happen at times of extreme pessimism, and is thus usually a positive for stocks in the future. When conditions are calm and investors become complacent, they trade stocks on their own merits, and correlation drops. That tends to lead to below-average returns for the Sector in the future.
The Materials Select Sector SPDR Fund (XLB) tracks the S&P Materials Select Sector Index. The chart below highlights all dates when the XLB Component Correlation indicator was at 0.76 or higher. The most recent signal occurred on 2025-04-15.
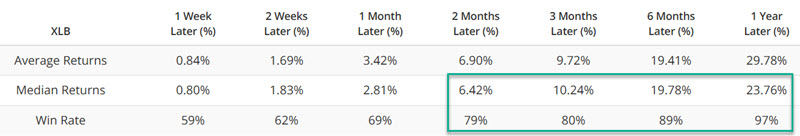
The table below summarizes subsequent XLB performance.
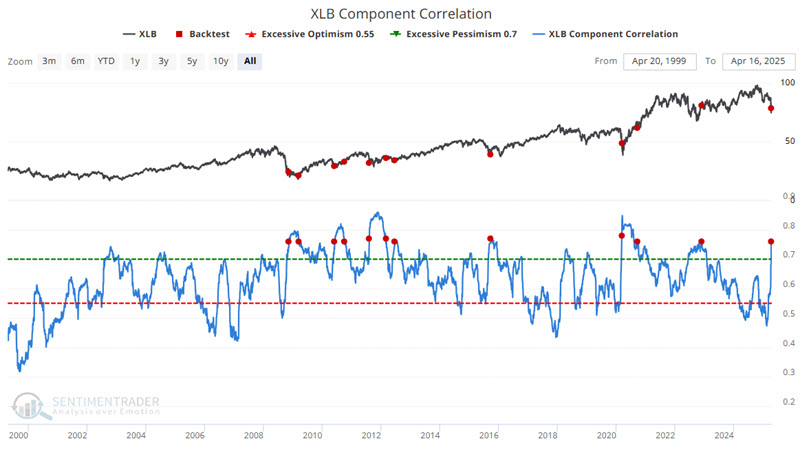
The chart below highlights only those times when the indicator crossed above 0.76 for the first time in at least three months.
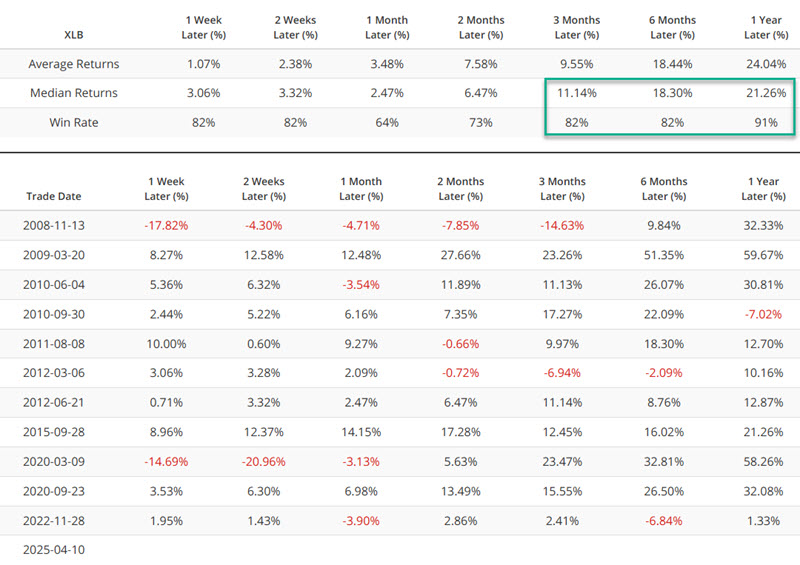
The table below summarizes performance and displays one-year results on a signal-by-signal basis.
The Panic Breadth Composite offers a unique perspective on market sentiment and breadth analysis, providing traders and investors with valuable insights into overall market health. It leverages a straightforward yet insightful formula, aggregating various market metrics to gauge market participation breadth. The Panic Breadth Composite provides a comprehensive snapshot of market sentiment and potential panic-driven behaviors by amalgamating these metrics and normalizing them into a composite score. This composite index, divided by 8 for normalization purposes, offers a nuanced perspective on market dynamics, serving as a valuable tool for assessing market breadth and identifying potential inflection points.
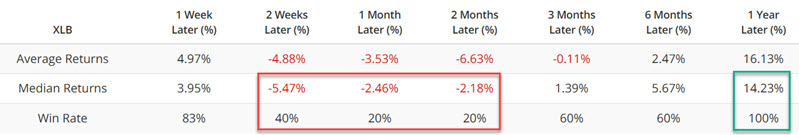
The chart below highlights all dates when the XLB Panic Breath Composite crossed above 80 for the first time in three months.
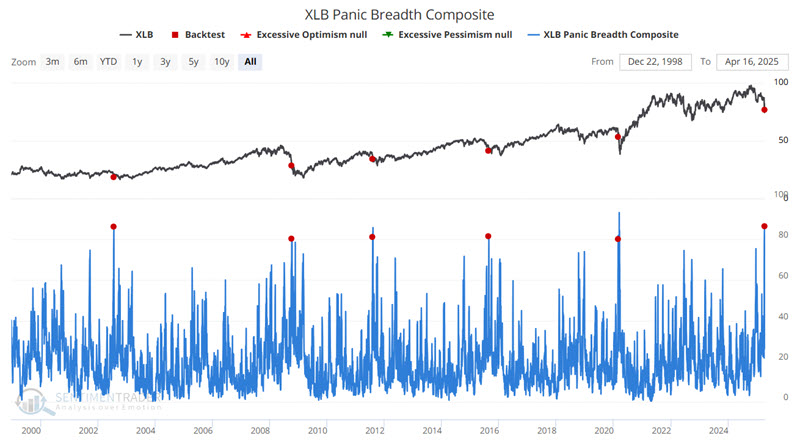
The table below summarizes performance and displays one-year results on a signal-by-signal basis.
Energy
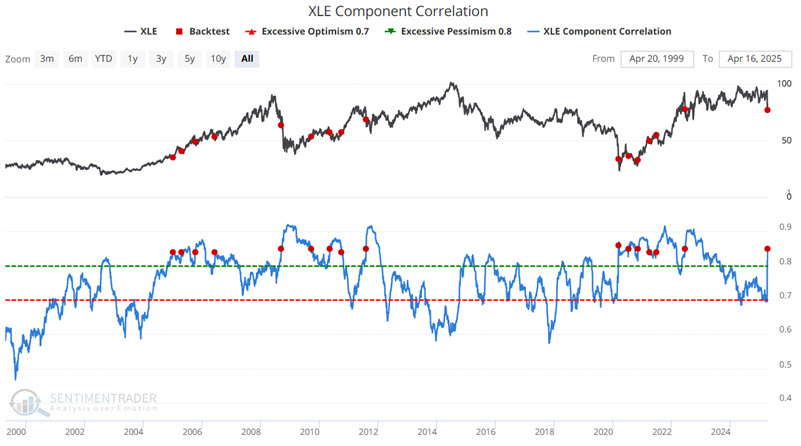
The Energy Select Sector SPDR Fund (XLE) tracks the S&P Energy Select Sector Index. The chart below highlights all dates when the XLE Component Correlation indicator was at 0.84 or higher. The most recent signal occurred on 2025-04-15.
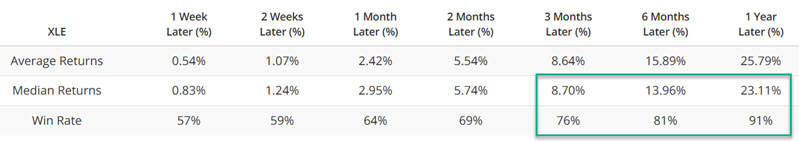
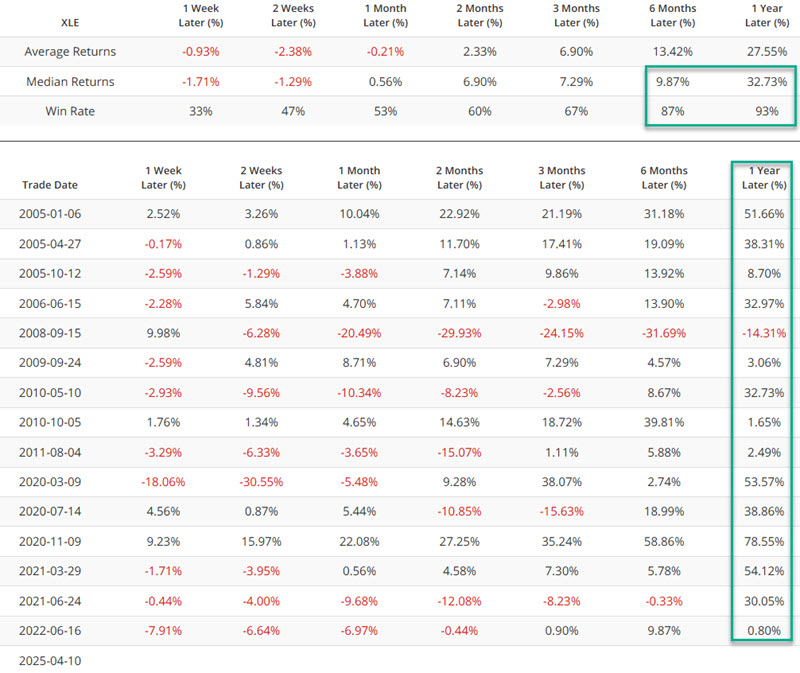
The table below summarizes subsequent XLE performance.
The chart below highlights only those times when the indicator crossed above 0.84 for the first time in at least three months.
The table below summarizes performance and displays one-year results on a signal-by-signal basis.
Technology
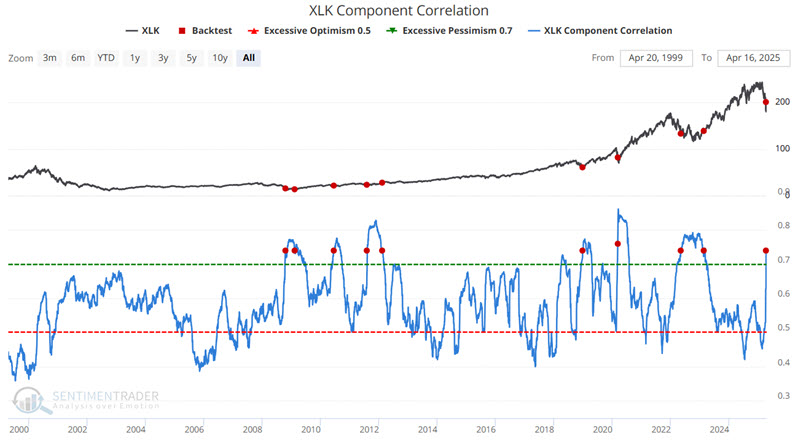
The Technology Select Sector SPDR Fund (XLK) tracks the S&P Technology Select Sector Index. The chart below highlights all dates when the XLK Component Correlation indicator was at 0.735 or higher. The most recent signal occurred on 2025-04-15.
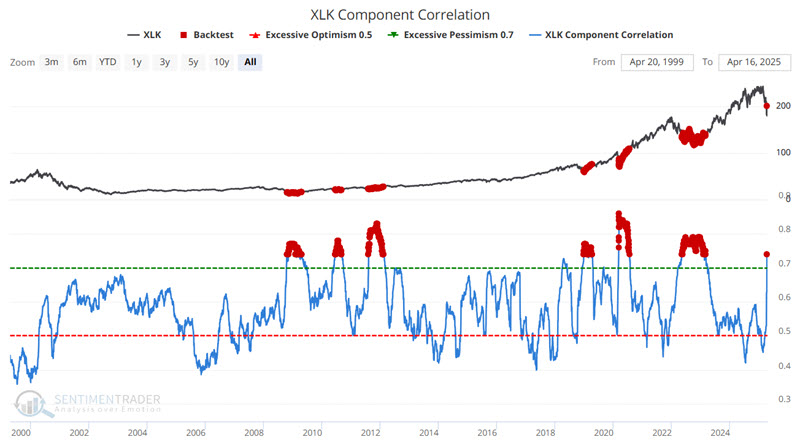
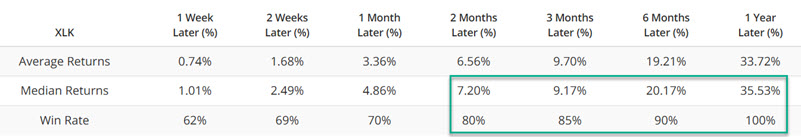
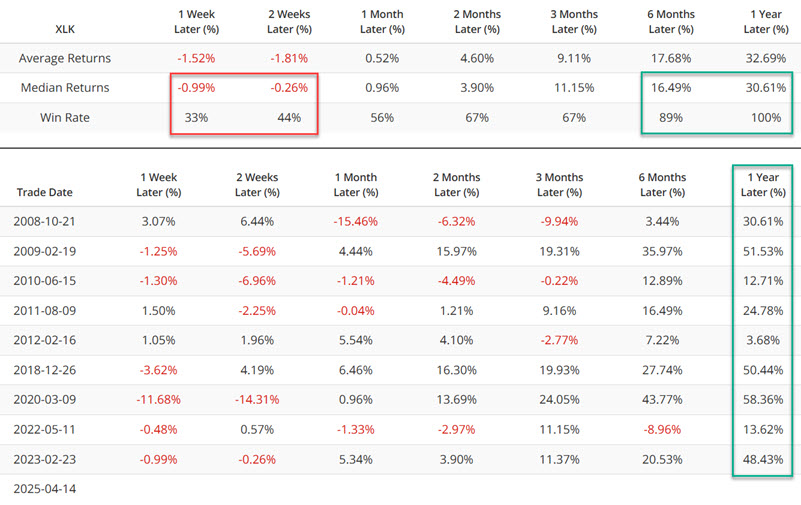
The table below summarizes subsequent XLK performance.
The chart below highlights only those times when the indicator crossed above 0.735 for the first time in at least three months.
The table below summarizes performance and displays one-year results on a signal-by-signal basis.
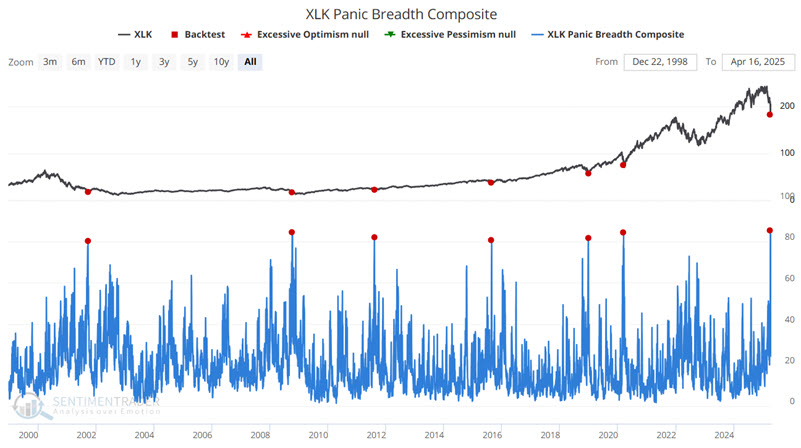
The chart below highlights all dates when the XLK Panic Breath Composite crossed above 80 for the first time in three months.
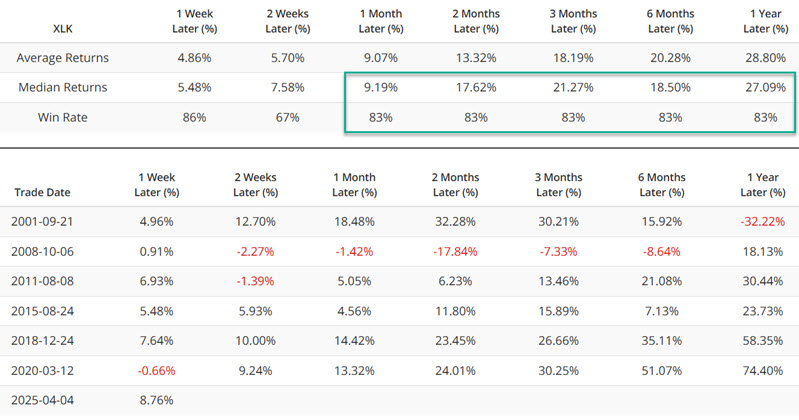
The table below summarizes performance and displays one-year results on a signal-by-signal basis.
What the research tells us…
Fear in the market often reveals itself via herd mentality, action, and straight-up panic. The signals highlighted above are all indications of growing fear. Historical results generally suggest above-average prospects for the next six to twelve months. However, none of the above should be viewed as an outright "Buy" signal, as several negatives continue to overhang. There remains vast uncertainty regarding tariff-related concerns. Likewise, each of the sectors highlighted remains in technical price downtrends (i.e., below a declining 200-day moving average). The signals above should be considered not as "Buy" signals but as "Prepare yourself to be willing to buy" signals.