
The smart money continues to buy, or at least not sell

Key points:
- Commercial hedgers in equity index futures keep buying the dip
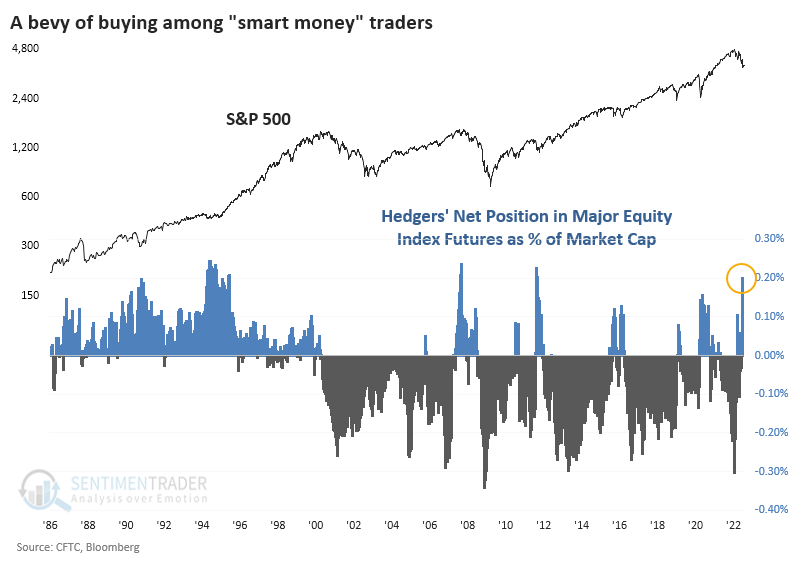
- They are now holding a net long position worth about 0.2% of the market value of all U.S. stocks
- Another "smart money" group, corporate insiders, continue to hold off on selling
While Wall Street sells, smart money buys
Wall Street is selling (or rather, telling others to sell), but one group bucking their recommendations is commercial hedgers in major equity index futures. Last week, they added more to their net long position in S&P 500, Dow Industrials, Nasdaq 100, and Russell 2000 futures contracts.
For the week ended last Tuesday, they were holding more than $82 billion worth of contracts net long, a record high.
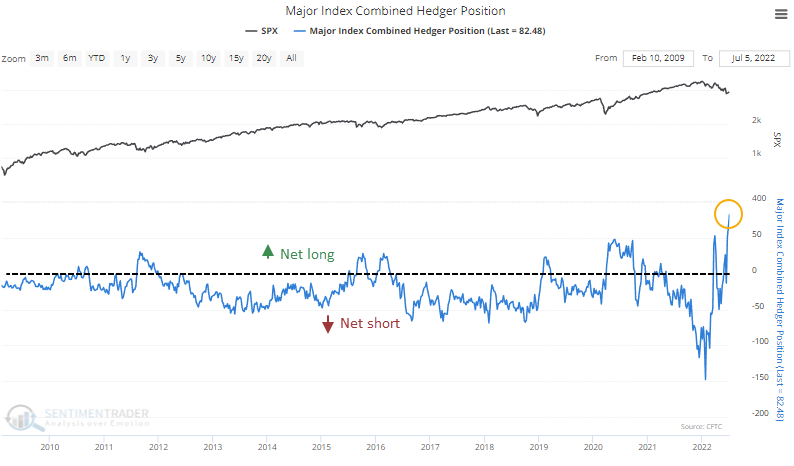
We've discussed this data many times over the decades. It's not perfect by any stretch of the imagination and can go through periods of acting kind of screwy. The financial crisis was one of those, and I've noted numerous times over the past year or so that some of the weekly changes are a bit odd. It's compelling data; it shouldn't be considered gospel.
The chart above estimates the total amount of contracts held long or short by hedgers (not hedge funds), who are supposed to only be using the futures market to hedge their day-to-day business risks. They are specifically not to use futures contracts to speculate on rising or falling prices. That's why it's unusual to see hedgers go net long a market...any market. When they do, it sends a strong signal about their outlook for their business.
The chart does not account for the growing size of the equity market over the years. The chart below does just that, adjusting hedgers' net position in equity futures by the market capitalization of the U.S. equity market. It just exceeded 0.2%, which is minuscule in absolute terms but is among the largest exposures they've carried in nearly 40 years.
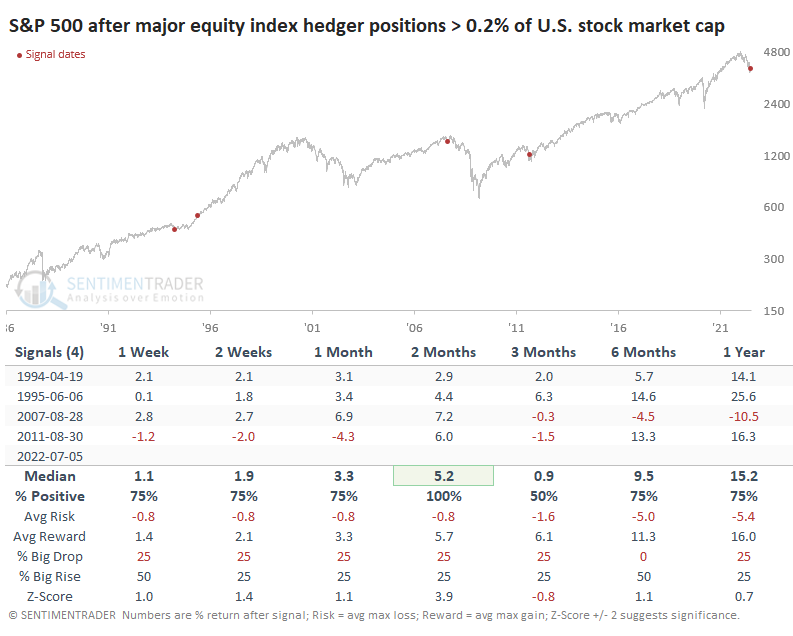
Below, we can see forward returns in the S&P 500 after the other times hedgers' positions exceeded 0.2% of market capitalization. The tiny sample size argues against having much confidence in the results, but the consistency of the signals is compelling. Over the next couple of months, the S&P rallied each time, with an impressive risk/reward ratio. Granted, one of them failed miserably over the long-term.
Insiders continue to buy their own shares
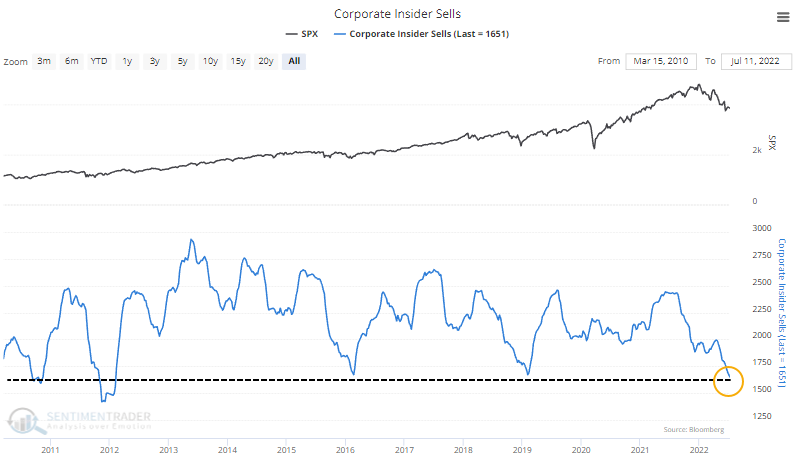
Another population of "smart money" participants, corporate insiders, may not be buying as aggressively as futures traders, but they're certainly not selling.
We've seen multiple times in recent weeks that corporate insiders also don't seem to be eager to sell shares in their own firms. That trend has continued, and a rolling 6-month sum of open market insider selling transactions among firms in the S&P 500 just hit its lowest level in a decade.
The trend of declining selling pressure and steady or rising buying interest among insiders has pushed the Buy/Sell Ratio to an extreme level. History is limited and the market was dominated by bullish trends, but the S&P 500 rallied strongly in the months following equivalent extremes in the ratio.
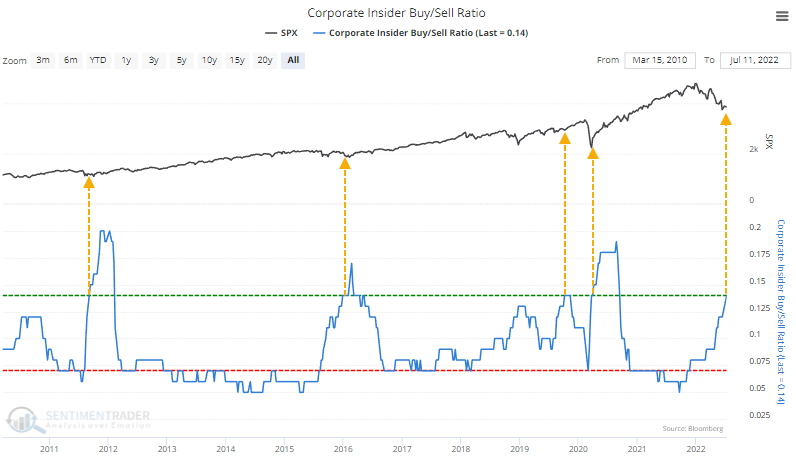
Insiders in Technology and Discretionary companies have been especially loathe to sell. The Buy/Sell Ratios for stocks in the Consumer Discretionary and Nasdaq 100 firms are climbing quickly and are at/near the highest levels since 2010.
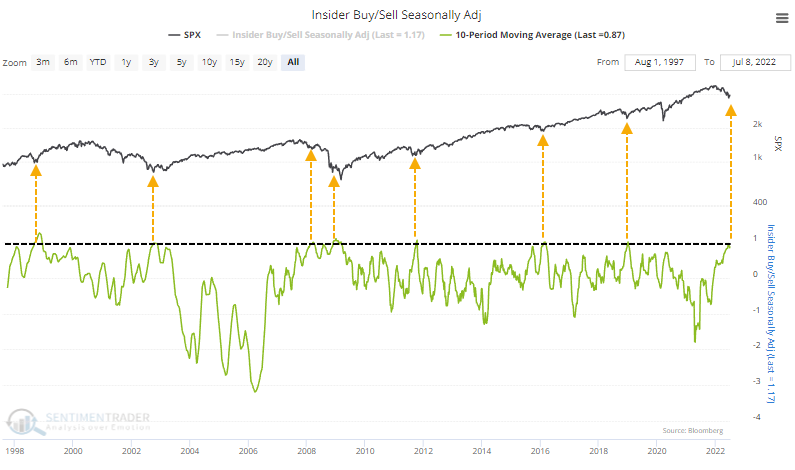
It would be nice to see this during 2007-08 but that data is not available in the same format. An alternative source, for which we seasonally adjust the transactions, shows that the 10-week average recently climbed to one of the highest levels in 25 years.
Stocks rebounded after similar extremes, though it occurred relatively early in the 2008 debacle and the rebound rally petered out after two months. It triggered again at the end of that year ahead of another leg down, so it was painful in different ways during that bear market.
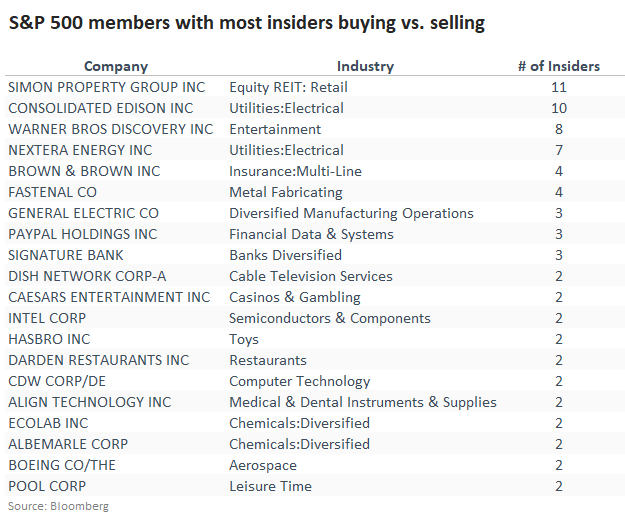
Among individual companies, the following table shows which firms within the S&P 500 have seen the largest number of insiders buying minus those selling over the past six months.
What the research tells us...
The idea of "smart money" in markets is dangerous. Individually, those who haunt Wall Street are among the brightest in the world. Collectively, they tend to herd, and that bias often shows up in the data we study.
During a crisis like 2008, institutional investors find other ways to bet for or against stocks that aren't necessarily reflected in data like they are in calmer times. We can see that in counter-intuitive moves in the futures and options markets in 2008. Maybe we're seeing the same now. It doesn't seem like we have the same urgency now as we did then, but some of that is only obvious in hindsight. From what we can see, traders that are typically well-positioned for multi-week or multi-month moves have established heavy long positions, and they tend to be rewarded for it.