Products
SentimenTrader Trading Tools
‍
Backtest Engine
My Trading Toolkit
Correlation Analysis
Seasonality
Market Prediction
Indicators & Data API
‍
Proprietary Indicators & Charts
Market Data API
Strategies & Scanner
‍
50+ Trading Strategies
Smart Stock Scanner
Smart Option Scanner
Research Reports
‍
Research Solutions
Reports Library
Free Resources
Simple Backtest Calculator
Simple Seasonality Calculator
The Kelly Criterion Calculator
Sentiment Geo Map
Public Research Reports
Education
Sentiment Indicators
Technical Indicators
Pricing
Company
About
In the News
Testimonials
Client Success Stories
Contact
Log inLoginSign up
< BACK TO ALL REPORTS

The September Strategy (such as it is)

Jay Kaeppel
2024-08-23
While year-to-year results vary widely, September has been unfavorable overall for stocks. However, one brief period offers a little more hope. We combine these two pieces to create a long-term investment "strategy" (if you can call it that).

Key Points

  • September is the only month that has shown a loss on average for stocks
  • Trading days around a market holiday tend to be better than average for stocks
  • The "September Strategy" (such as it is) can be summed up pretty simply as follows: Enjoy the holiday. Then take the rest of the month off

The September Strategy Rules

Here are the "trading rules" (such as they are):

  • Hold the S&P 500 Index from January through August and October through December
  • Also hold the SPX for the first three trading days during September.  During all other trading days in September, hold cash

To put it another way:

  • Sell the S&P 500 Index at the close of the 3rd trading day of September (in 2024, this date is 2024-09-05)
  • Buy back the S&P 500 Index at the close of the last trading day of September (2024-09-30)

OK, so as far as "strategies" go, there isn't much to it granted.  Still, before dismissing it as overly simplistic, let's take a closer look.

 A closer look at September S&P 500 results

The chart below displays:

  • The growth of $1,000 invested in the S&P 500 index ONLY during the 1st 3 trading days of September starting 1919-12-31
  • The growth of $1,000 invested in the S&P 500 index ONLY during ALL OTHER trading days of September during the same time
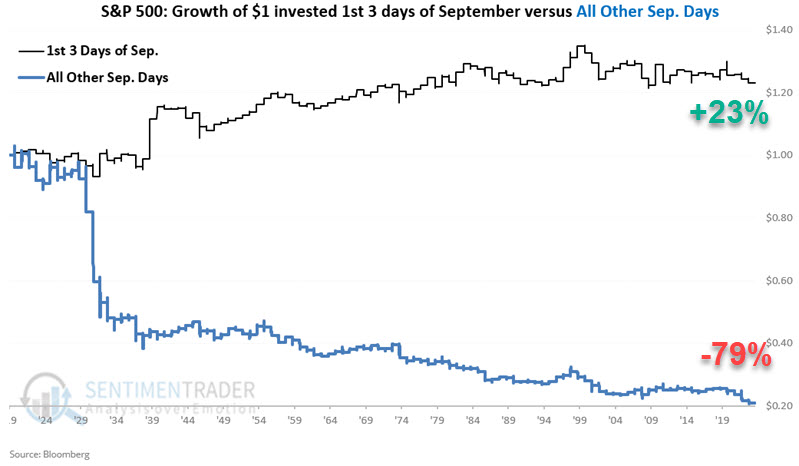
The bottom line:

  • 1st 3 trading days of September: Sort of OK sometimes (cumulative +23%)
  • All other September trading days: Not so good (cumulative -79%)

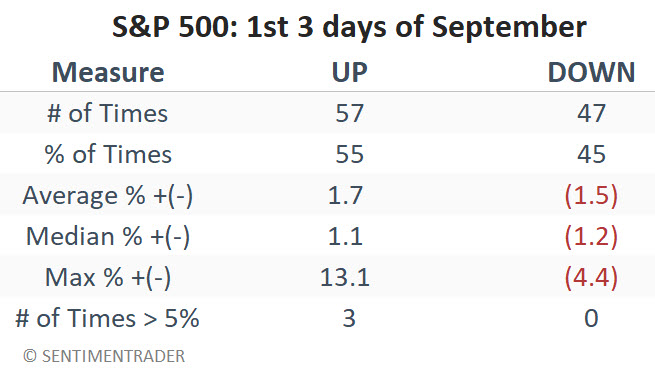
The table below summarizes S&P 500 performance only during the first three trading days of September.

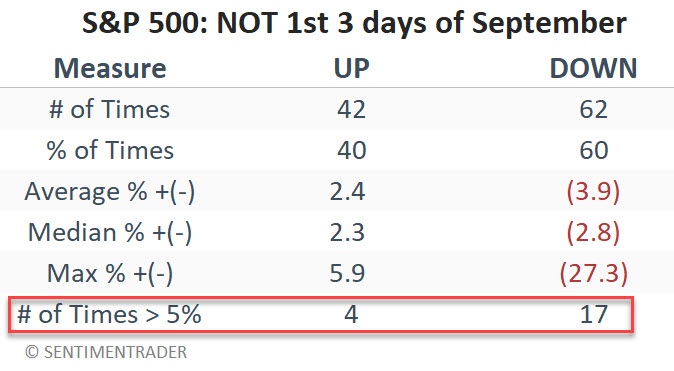
The table below summarizes S&P 500 performance only during all the other trading days of September.

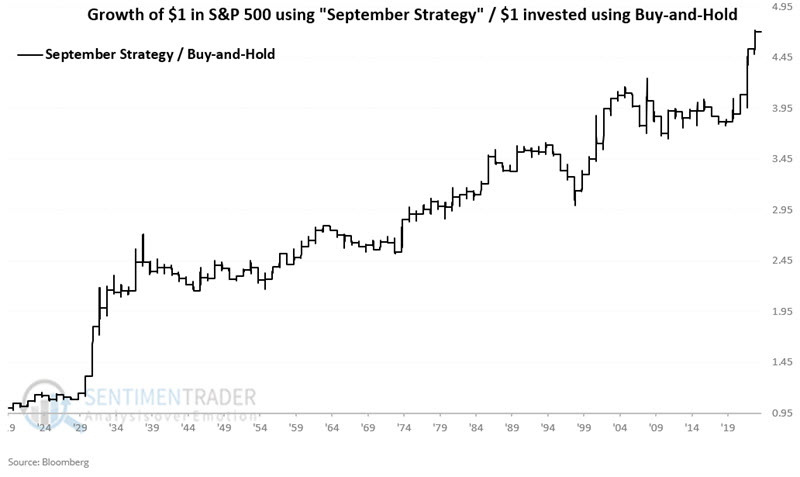
The September Strategy versus Buy-and-Hold

The chart displays the cumulative growth of $1 invested using the "System" rules spelled out above versus the cumulative growth of $1 using buy-and-hold since 1919-12-31.
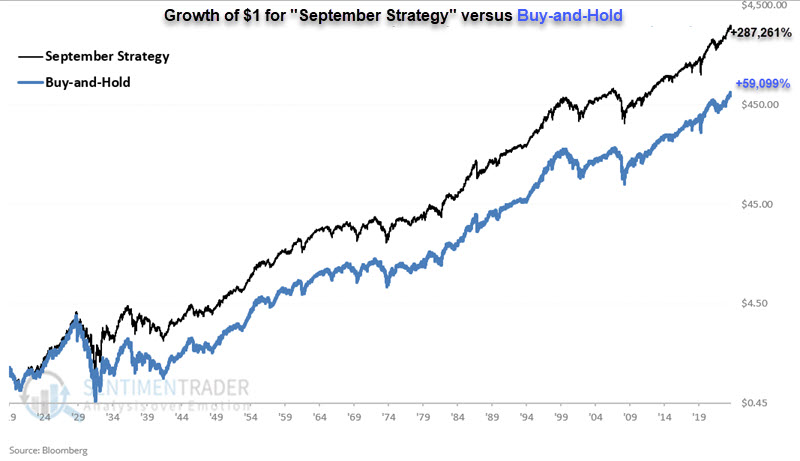
For the record:

  • $1 invested using the "System" grew +278,621%
  • $1 invested using buy-and-hold grew +59,099%

The chart displays the cumulative growth of $1 invested using the "System" rules spelled out above divided by the cumulative growth of $1 using buy-and-hold since 1919-12-31. Over 104 years, the "System" has outperformed buy-and-hold by 4.7-to-1, as shown below.

What the research tells us...

It is a mistake to assume that the stock market is automatically going to run into trouble during the month of September. At the same time, that has historically been a pretty good bet. What will happen in September 2024 is unknowable. But the fact remains that sitting out most of the month of September would have boosted an investor's returns dramatically over the last 104 years. Make of it what you will.

PRODUCTS
SentimenTrader
Trading Tools
Indicators & Data API
‍
Strategies & Scanner
‍
Research Reports
FREE
RESOUrCES
Simple Backtest
Calculator
Simple Seasonality
Calculator
The Kelly Criterion
Calculator
Sentiment Geo Map
‍
Public Research Reports
‍
Education
Sentiment Indicators
‍
Technical Indicators
‍
Pricing
Bundle pricing
‍
FAQ
‍
Announcements
‍
COMPANY
‍
About
‍
In the News
‍
Testimonials
‍
Client Success Stories
CONTACT
‍
General Inquiries
‍
Media Inquiries
‍
Financial Professionals Inquiries
‍
© 2026 Sundial Capital Research Inc. All rights reserved.
Setsail Marketing
TermsPrivacyAffiliate Program
Risk Disclosure: The information and tools provided are for research and analytical purposes only and are not intended as investment advice. Market analysis involves uncertainty, and outcomes may differ from expectations. Users should conduct their own due diligence and consider their individual circumstances before making any financial decisions. Past performance is not necessarily indicative of future results.

Hypothetical Performance Disclosure: Hypothetical performance results have many inherent limitations, some of which are described below. No representation is being made that any account will or is likely to achieve profits or losses similar to those shown; in fact, there are frequently sharp differences between hypothetical performance results and the actual results subsequently achieved by any particular trading program. One of the limitations of hypothetical performance results is that they are generally prepared with the benefit of hindsight. In addition, hypothetical trading does not involve financial risk, and no hypothetical trading record can completely account for the impact of financial risk of actual trading. for example, the ability to withstand losses or to adhere to a particular trading program in spite of trading losses are material points which can also adversely affect actual trading results. There are numerous other factors related to the markets in general or to the implementation of any specific trading program which cannot be fully accounted for in the preparation of hypothetical performance results and all which can adversely affect trading results.

Testimonial Disclosure: Testimonials appearing on this website may not be representative of other clients or customers and is not a guarantee of future performance or success.