
The S-TCTM Risk Warning Model Triggers a Risk-Off Signal

Key points
- The S-TCTM Risk-Warning Model, a composite of 10 breadth and sentiment indicators, has officially triggered a risk-off signal (March 3, 2026).
- Historical performance following this signal is notably poor, with the S&P 500 experiencing weak win rates and skewed risk/reward (maximum drawdowns significantly outweighing maximum gains) across most timeframes.
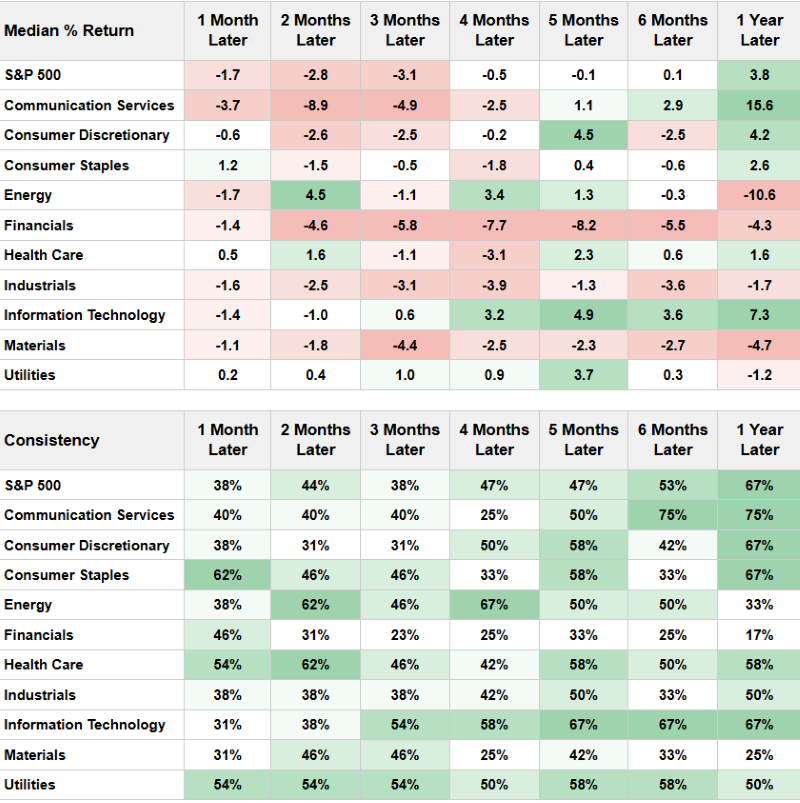
- Given this macro-level warning, defensive positioning is warranted, as cyclical sectors historically underperform defensives in the aftermath of this signal.
S-TCTM Risk Warning Model sounds the alarm
Identifying major market trends is one of the most critical tasks for any trader or investor. The Tactical Composite Trend Model (TCTM) is the culmination of decades of professional trading and financial market research, designed to assist in this process. The S-TCTM utilizes a weight-of-the-evidence approach, combining several time-tested key elements to identify significant market turning points.
It is common knowledge that markets trend upward over the long term. Therefore, if one is to reduce market exposure, it is imperative to ensure the odds are heavily stacked in our favor. The Risk-Warning Model is specifically designed for this purpose.
For live updates on the S-TCTM website, please click here.
Component Descriptions
The Risk-Warning Model contains ten algorithms designed to identify historical instances of deteriorating market participation coupled with excessive optimism. Historically, weak internal trends combined with overly optimistic sentiment serve as early warning signs of a potential trend change. In this new S-TCTM Risk Warning Model, we have refined and optimized these component algorithms. For related articles, please click here and here.
- New 52-Week High-Low Ratio
- 52-Week Lows with Percent above 200-Day
- High-Low Logic NYSE with Spike
- Advance-Decline Line Divergence
- New Low Spike S&P 500
- High-Low Logic S&P 500 with Spike
- Financials Relative Strength
- Financials Absolute Lows
- Cyclical Sector Spreads
- Sentiment Composite
Risk-Warning Model Signal Criteria
- Condition 1 = Composite Signal Count >= 30%.
- Condition 2 = If Condition 1 is met, begin counting days from the true count.
- Condition 3 = If Days Since True Count <= 20, AND the 5-day Rate of Change for the S&P 500 is -1% or higher, a risk-off signal is issued.
- Condition 4 = The composite count resets below 20%. This reset filters out repetitive signals.
Notes:
- The composite model utilizes a 42-day lookback period for the signal count.
- We stress the importance of utilizing a momentum condition in trading signals. We never want to catch a falling knife on down moves or prematurely reduce exposure in a market that is ripping to the upside. This is why we include the 5-day rate of change condition.
Current Day Chart
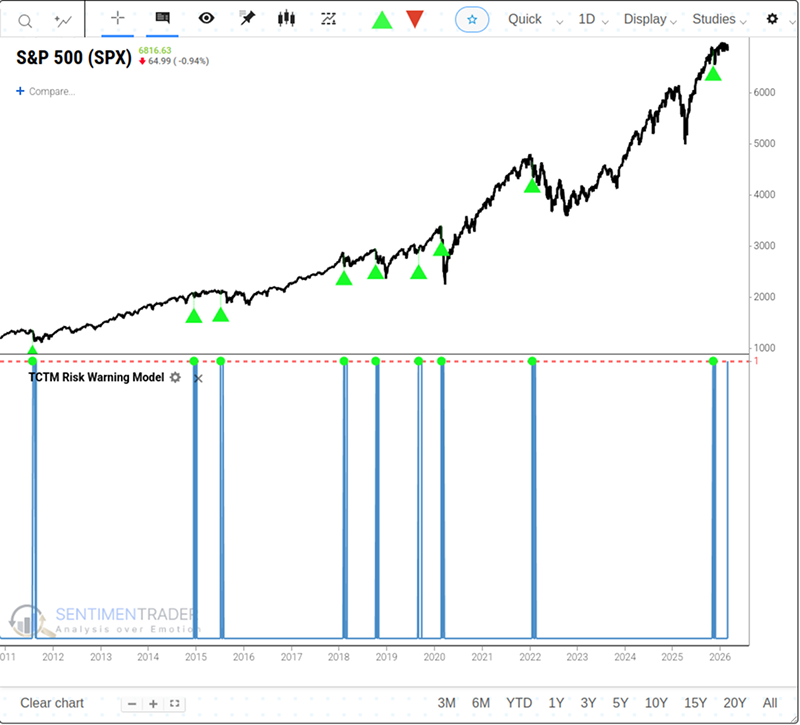
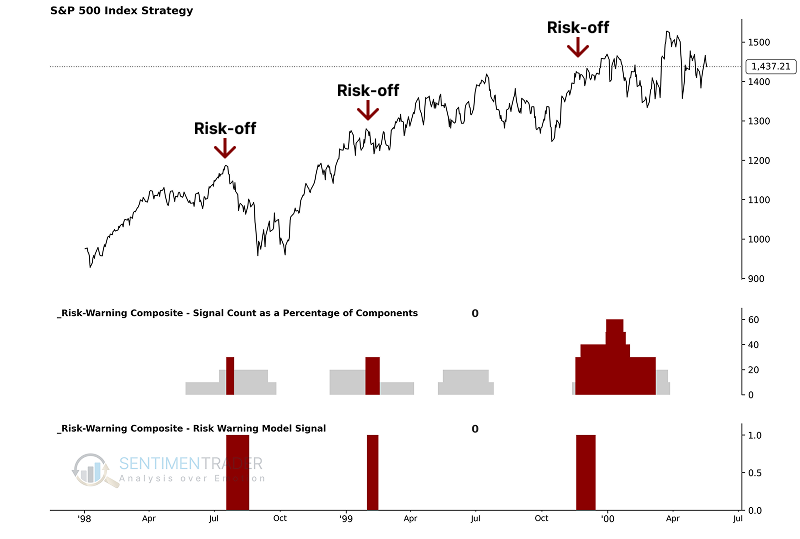
As the chart below illustrates, these individual components are combined into a single composite indicator-the Risk-Warning Model-which uses a 0 or 1 value to issue alerts. The most recent signal was issued on March 3, 2026. Currently, the model shows a reading of 1, indicating the warning signal is active.
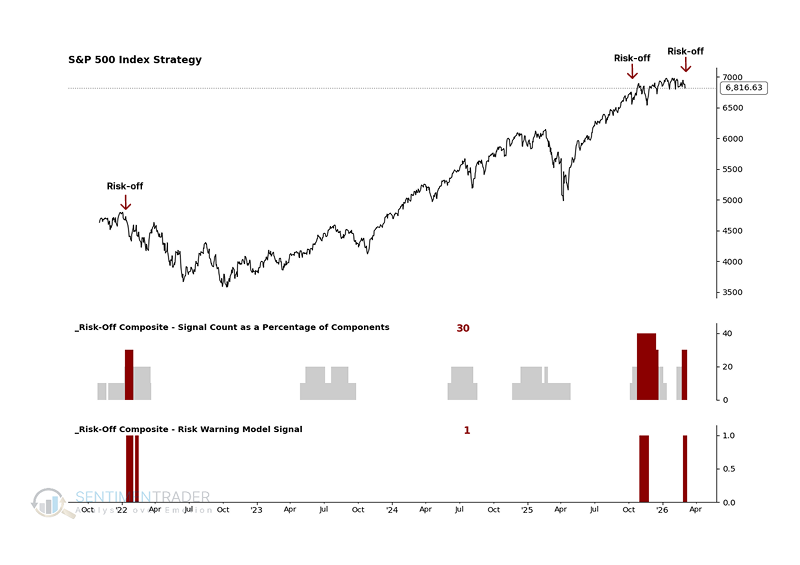
Let's take a look at some charts and the historical signal performance.
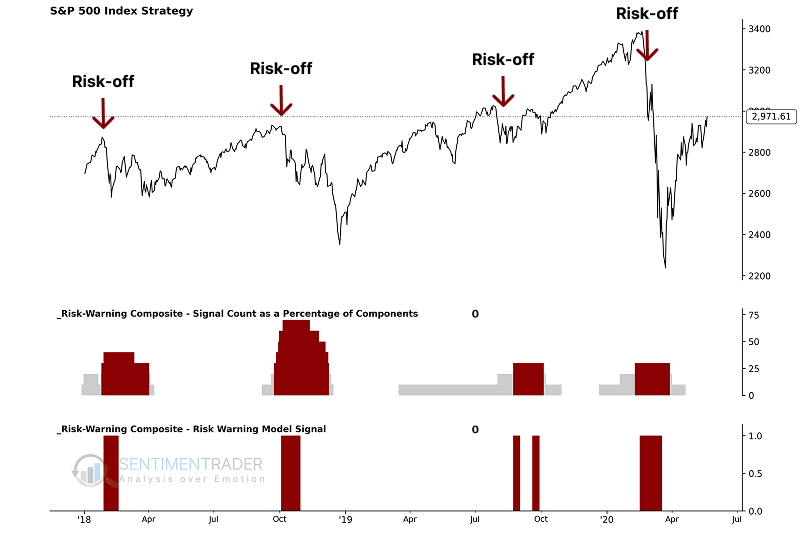
2018-2020 Market
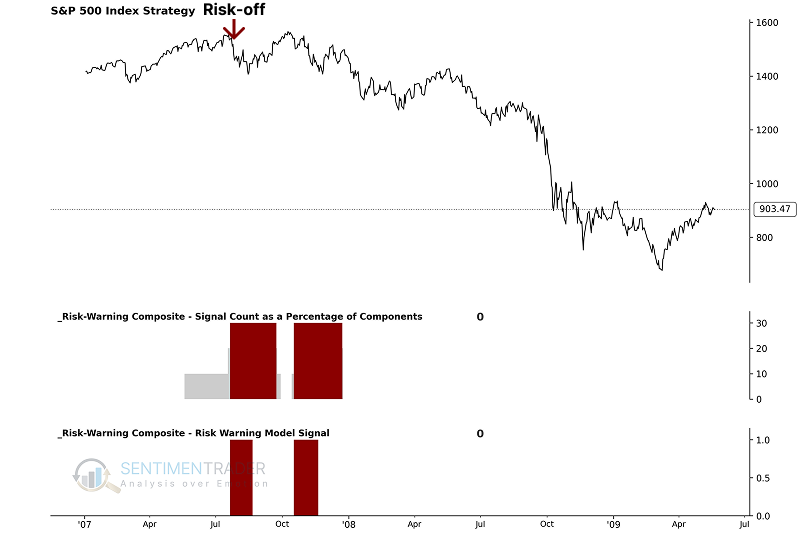
2007-2008 Market
1998-2000 Market
1990 Market
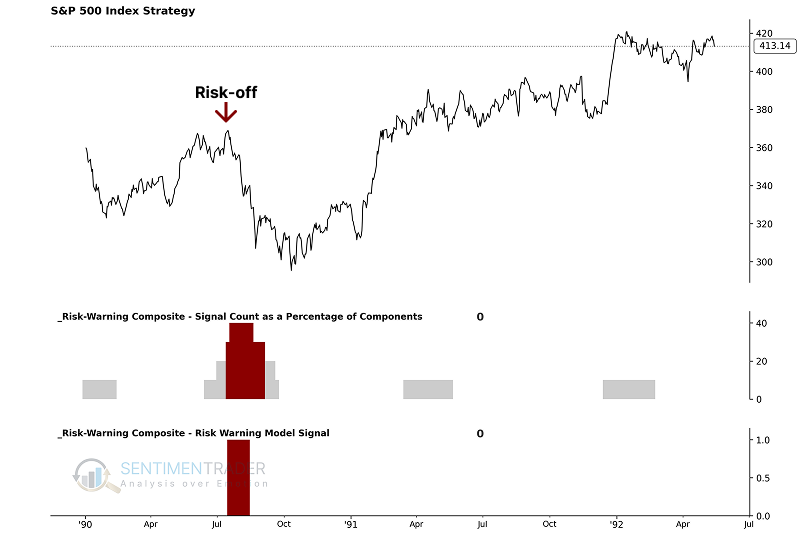
Similar signals precede market weakness
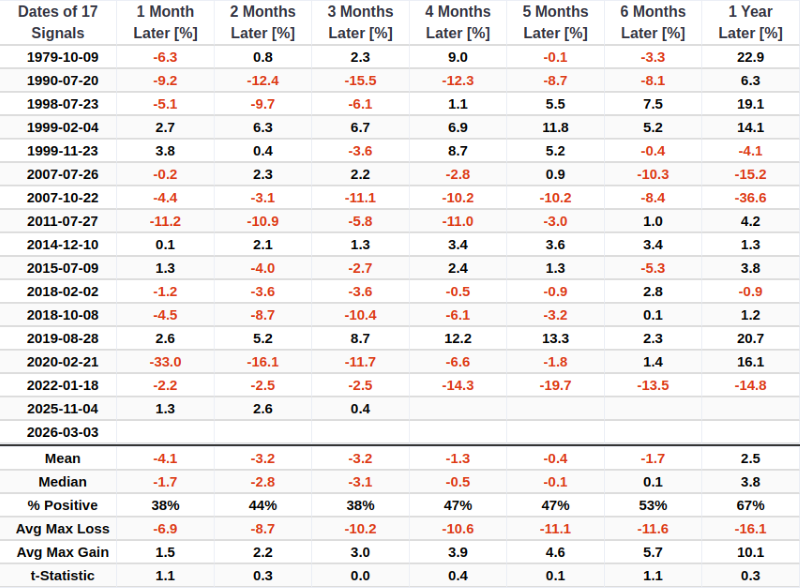
As you can see, the model has only issued 17 warnings since 1979. The Risk-Warning Model incorporates macro-level elements designed to identify historically significant turning points. It is highly unlikely to trigger a false alarm when market breadth remains genuinely strong. For related backtest, click here.
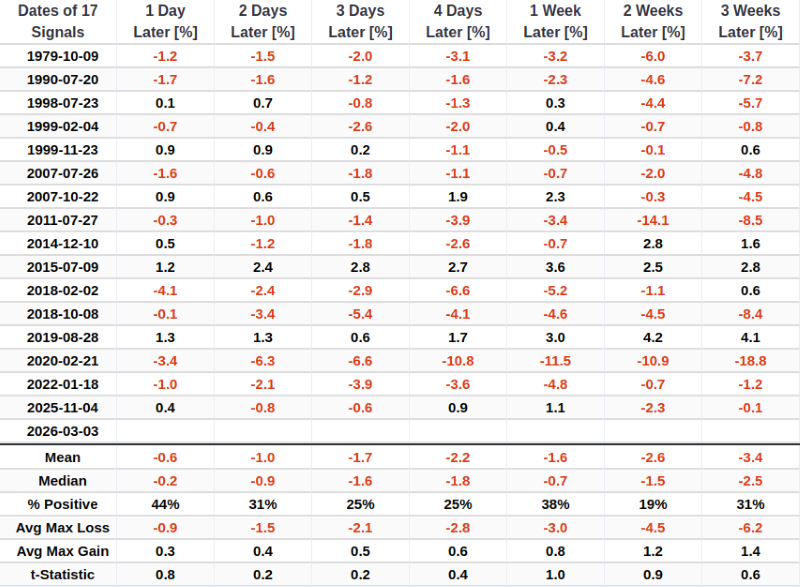
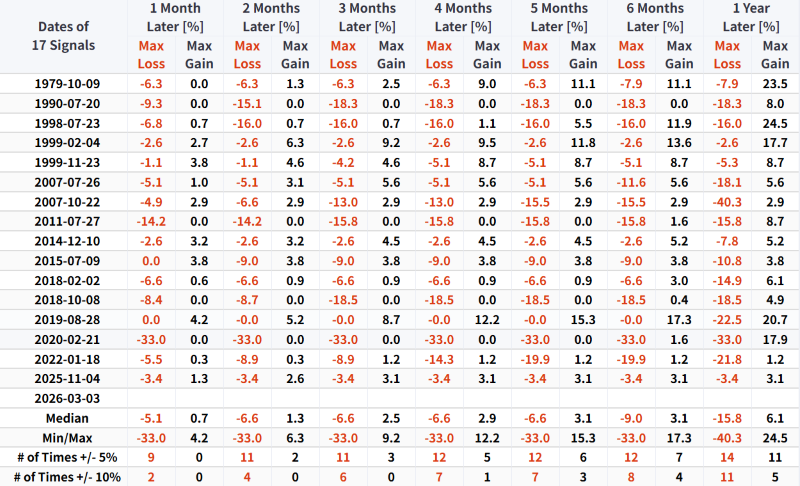
In the short term, the signal displays remarkably weak win rates and returns over a two-week timeframe. Following the previous signal in November 2025, the S&P 500 declined by 2.3% over the subsequent two weeks.
Following this signal, the maximum drawdowns across all timeframes are significantly larger than the maximum gains. For instance, over a four-month period, there has only been one instance where the maximum gain exceeded 10%, while downside risk was much more prevalent.
Given the dark outlook for the broader market following this alert, it is not surprising that cyclical sectors tend to decline and underperform defensive sectors.
What the research tells us...
The S-TCTM Risk-Warning Model triggering (March 3, 2026) is a major systemic event. With only 17 prior signals since 1979-many aligning with significant cyclical or secular peaks-the historical precedent demands a defensive posture. Investors should anticipate elevated volatility, skewed downside risk, and a challenging environment for the S&P 500 in the weeks and months ahead. The risk warning model overrides the long-term trend condition for a window period. Capital preservation and rotating toward defensive sectors should be prioritized over aggressive risk-taking. As always, one should view the S-TCTM as a complementary component to your research process.