
The Russell is roaring

Key points:
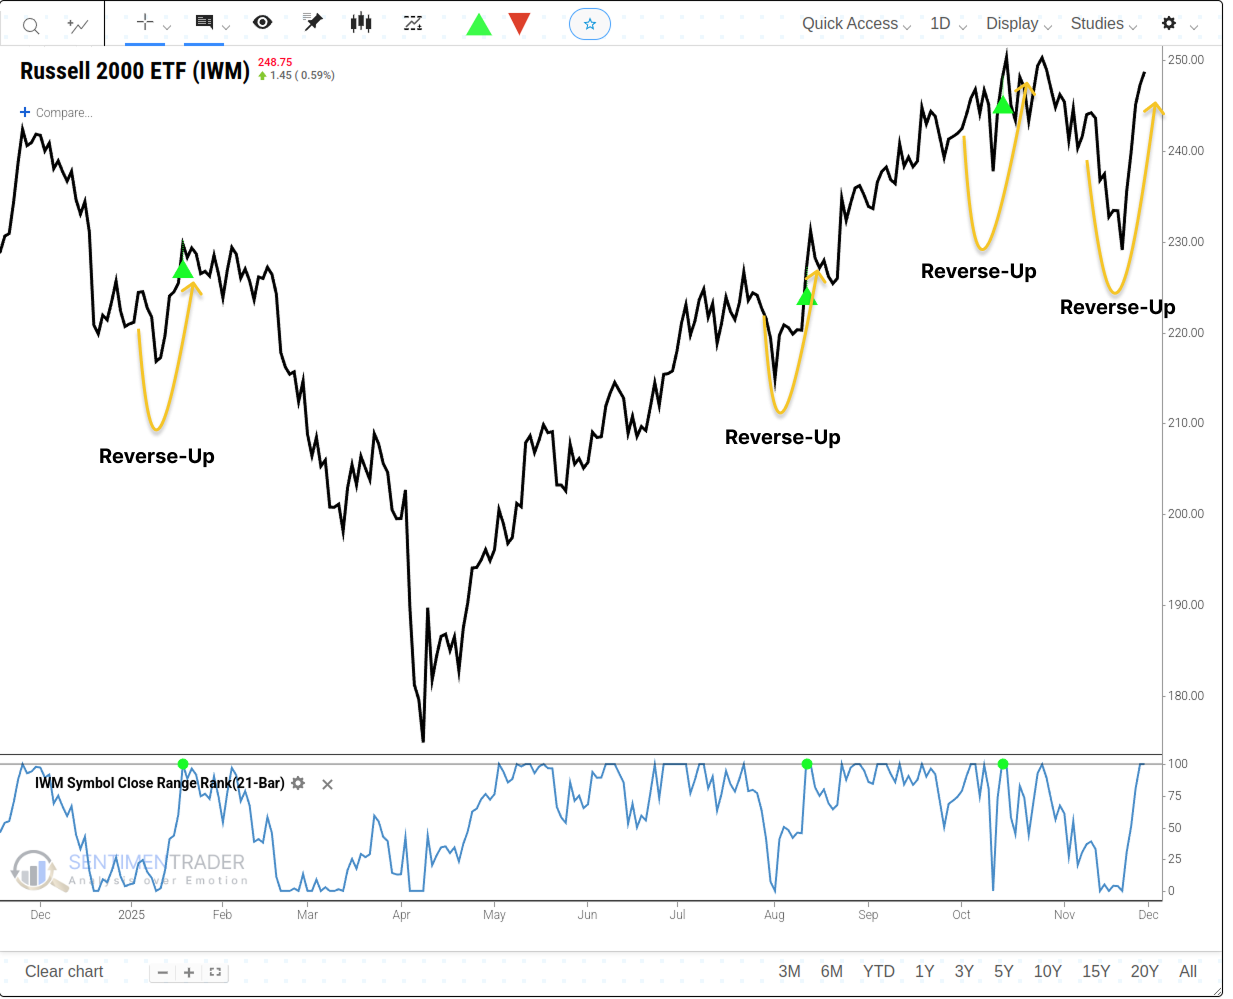
- The Russell 2000 (IWM) triggered a "Reverse Up" buy signal, rallying from a one-month low to a one-month high in under 10 days.
- Historically, this signal has preceded solid returns for small-caps, particularly over the 3-month timeframe.
- The recent strength in small-caps aligns with favorable seasonal trends.
A sharp reversal in small-cap stocks
The Russell 2000 ETF (IWM) triggered a "Reverse Up" buy signal at the close on Nov 26, 2025. The concept of a "Reverse Up" signal identifies when an asset's price rebounds from a one-month low to a one-month high in fewer than ten trading sessions. For those interested in the original concept description, click here.
While I monitor alerts across a broad range of securities, I pay particular attention to a few cyclical sectors, such as small-cap stocks, because they can convey important economic messages.
Recently, we've seen several signals emerge within the small-cap space. Are these economically sensitive sectors trying to tell us something?
Today's report aims to review the outlook for small-cap stocks following a Reverse Up signal. For related backtest, click here.
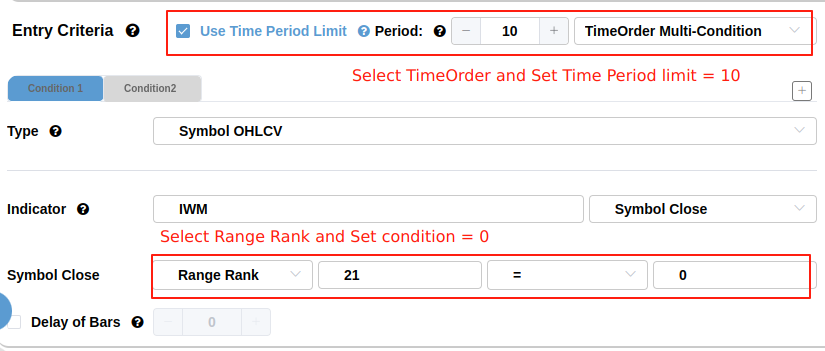
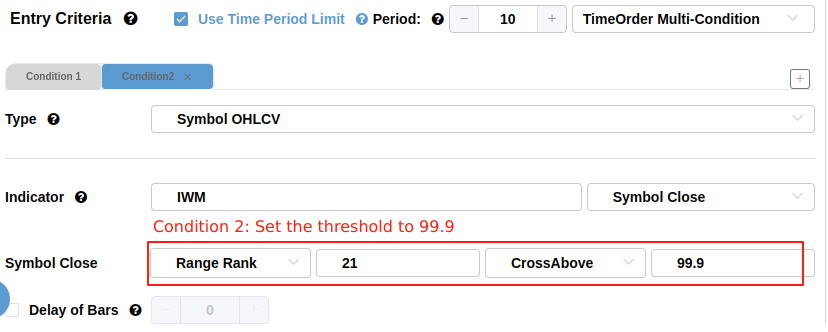
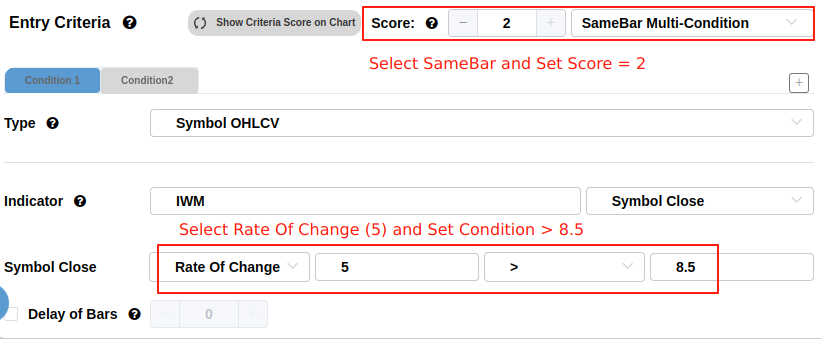
For users unfamiliar with BacktestEdge, you can also follow these steps to create the corresponding backtest. For more ways to use Backtestedge, click here.
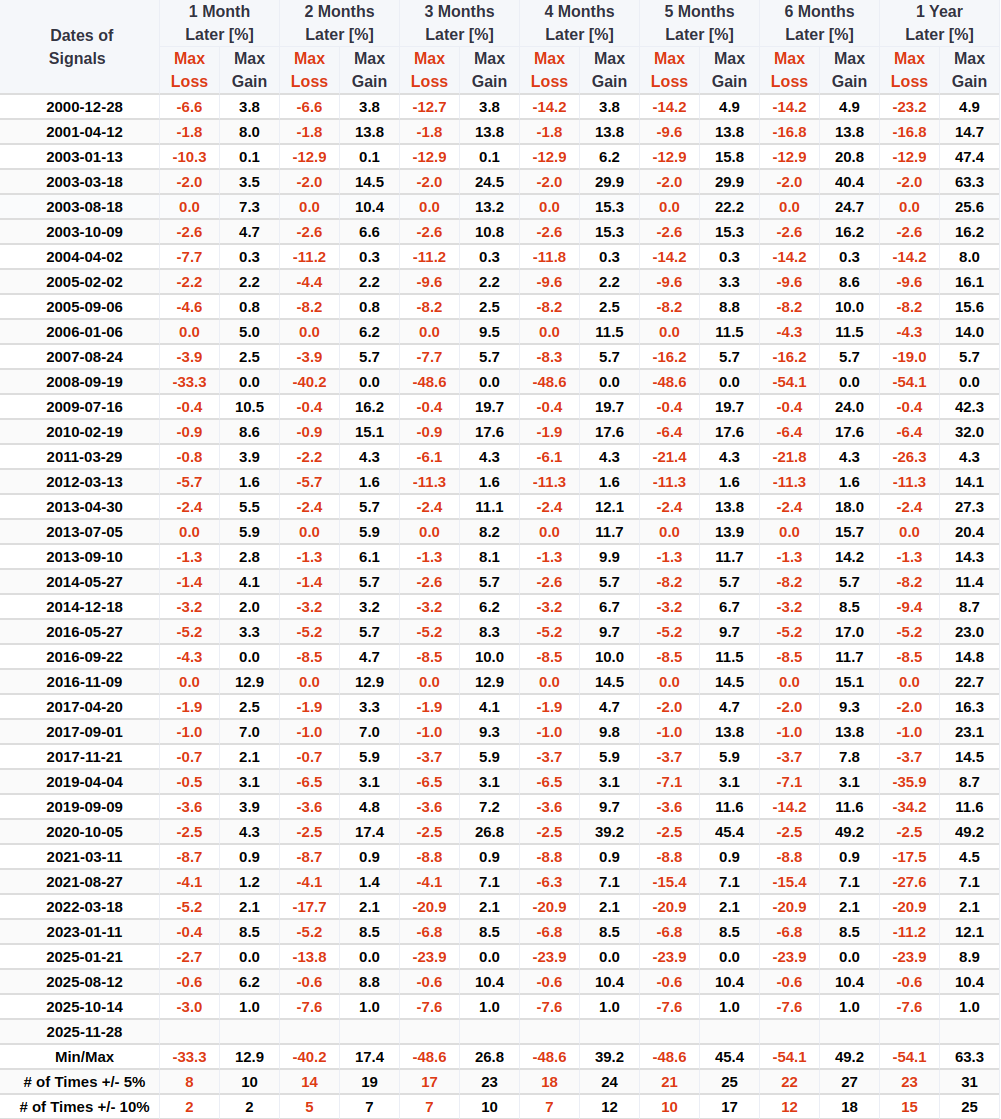
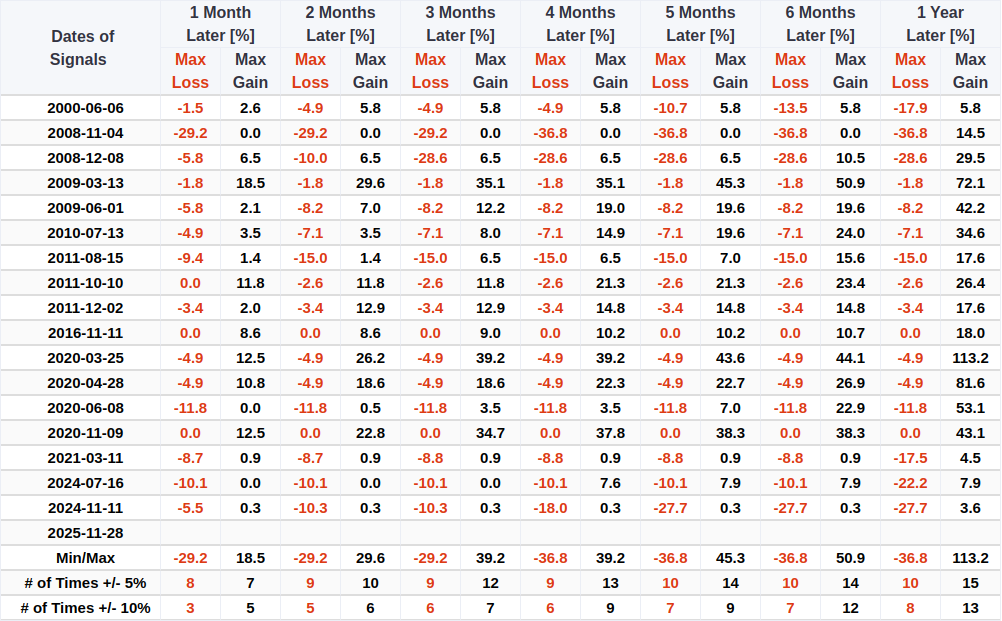
The results look encouraging, especially over the three-month timeframe. It is worth noting that between 2013 and 2020, there were 14 consecutive positive signals over the three-month period.
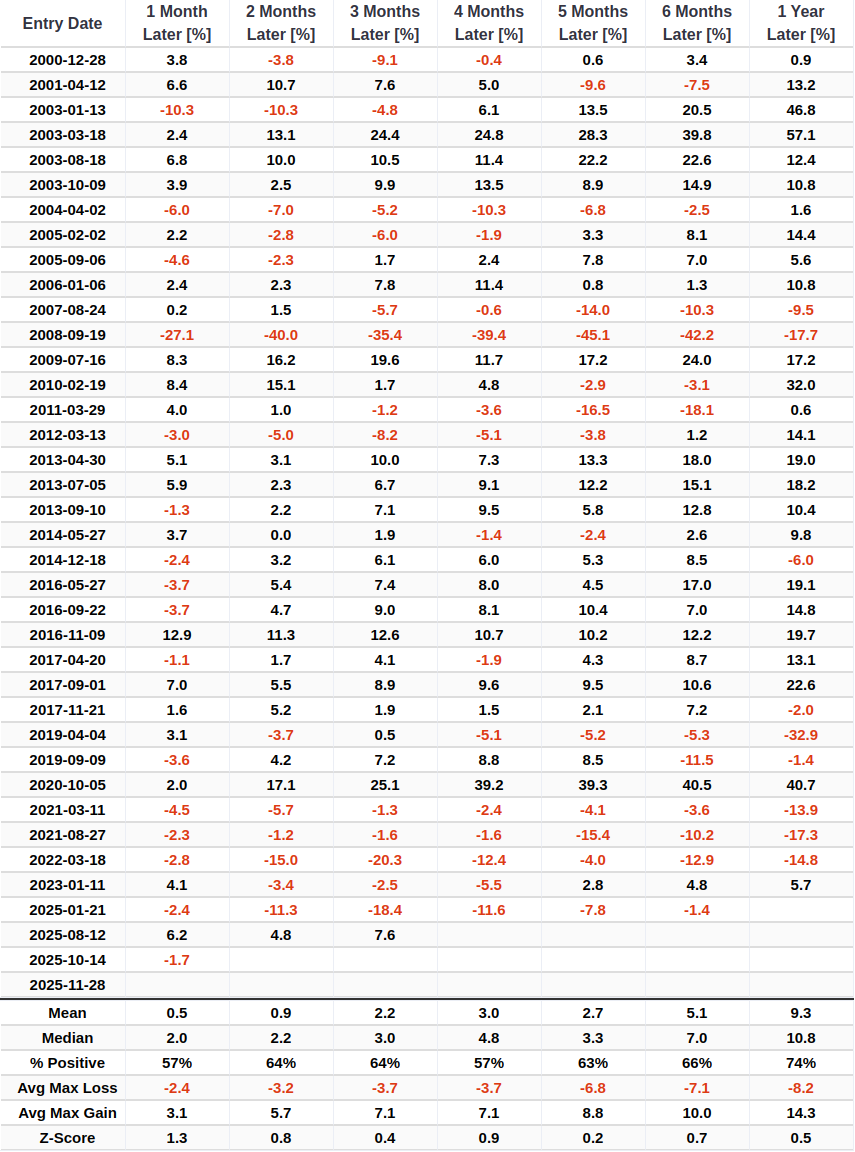
As the holding period extends to one year, while the signal is capable of capturing significant upside (with max gains exceeding 60%), it also comes with significant drawdowns.
How about the S&P 500?
When small-caps trigger this reversal signal, the broader market also tends to benefit. The S&P 500 has shown consistent positive returns following these events.
The Russell keeps running
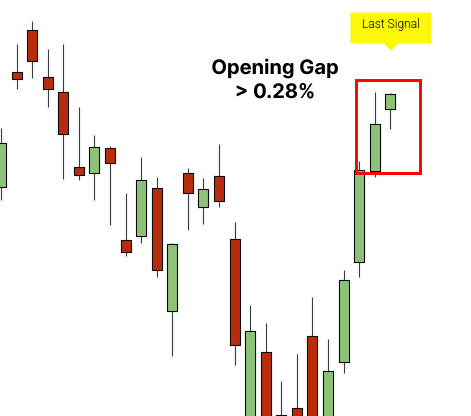
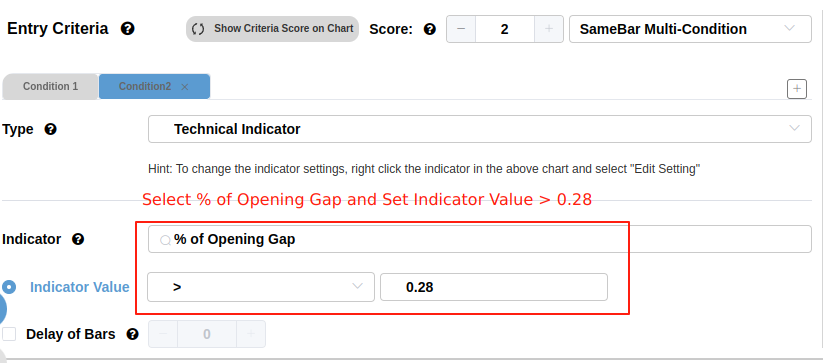
Even after four consecutive days of gains, trader enthusiasm for small-caps remains undiminished. The IWM Russell 2000 ETF gapped up more than 0.28% last Friday. By the close, IWM had gained over 8.5% (ROC5). For related backtest, click here.
For users unfamiliar with BacktestEdge, you can also follow these steps to create the corresponding backtest.
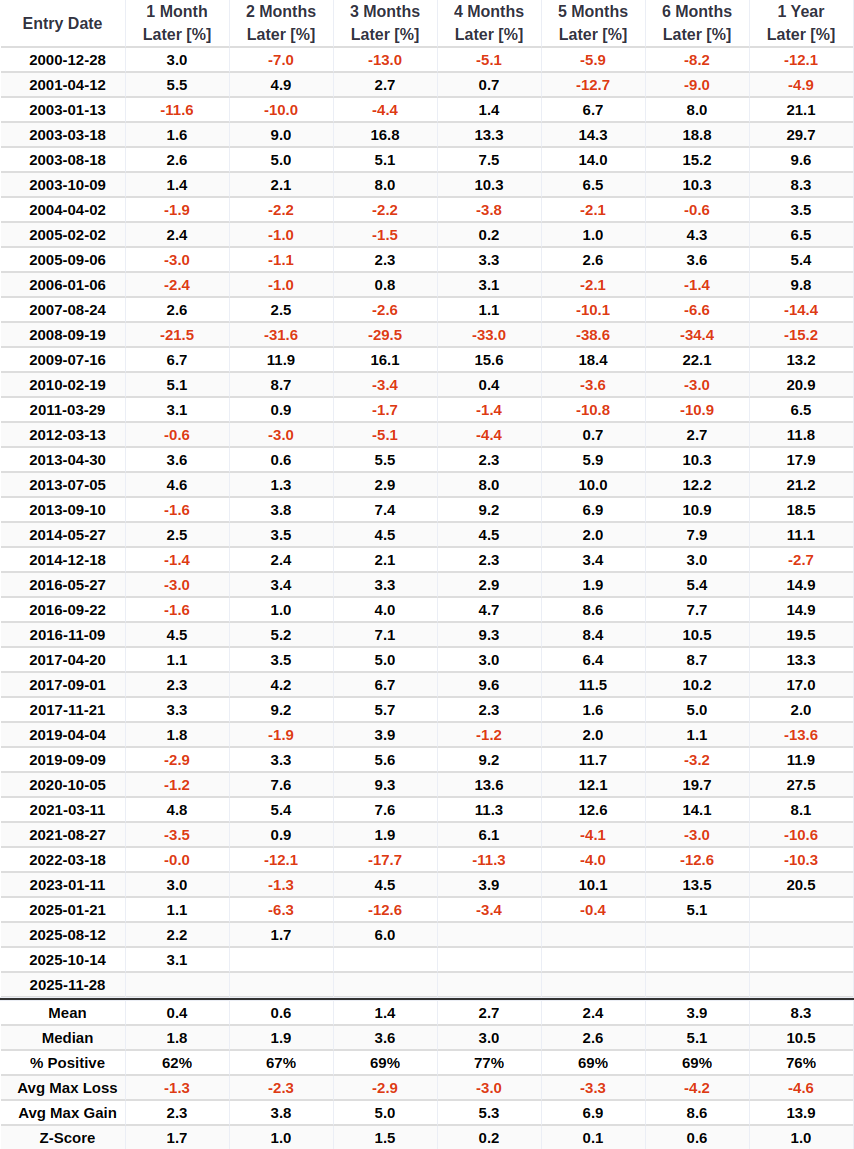
This persistent strength is reflected in the performance metrics.
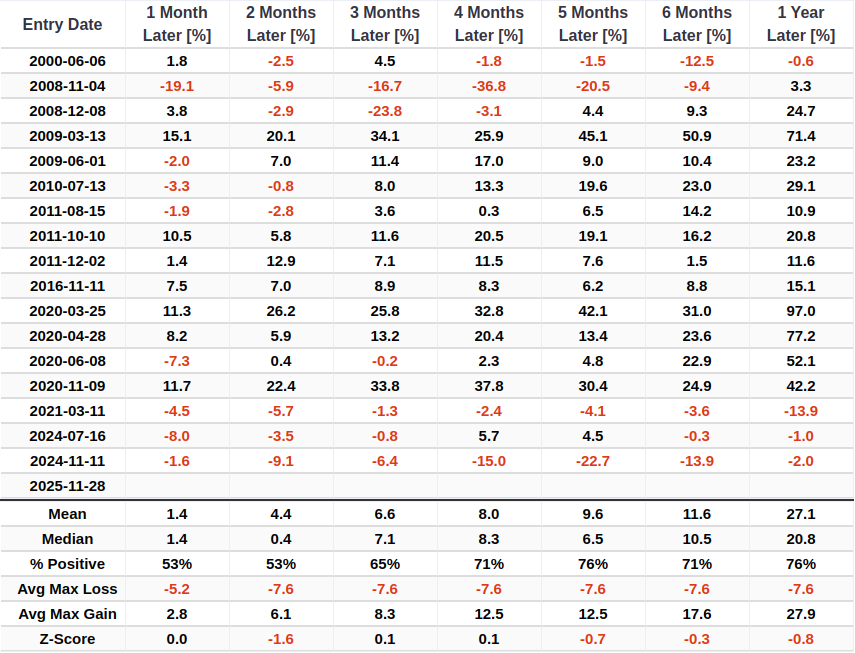
Similarly, the max drawdown is also noteworthy.
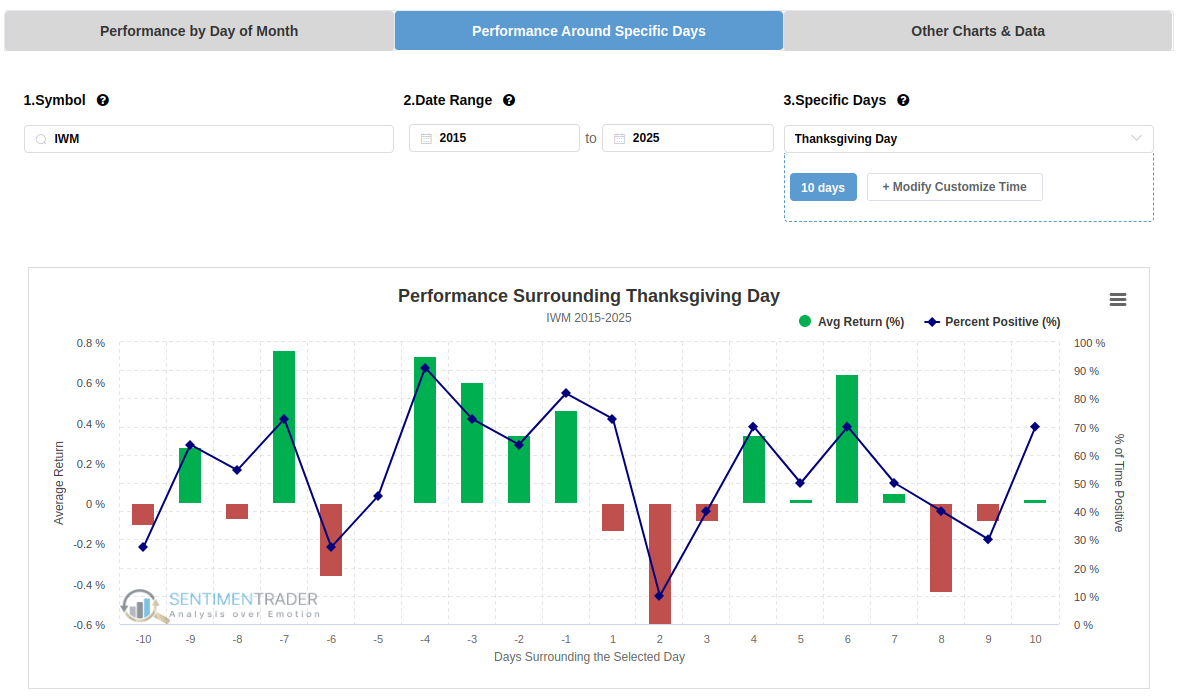
Seasonality
As seen below, the recent price action aligns closely with historical seasonal trends for this time of year.
What the research tells us...
Although the Nasdaq index ended its seven-month winning streak in November with a 1.5% decline, the S&P 500 and Dow Jones indices extended their seven-month consecutive gains. This divergence reveals a profound style rotation within the market: capital did not exit the market but shifted from highly valued tech giants to more cyclical and value-oriented sectors.Small-cap stocks, represented by the Russell 2000, have triggered a "Reverse Up" buy signal, indicating a rapid shift in momentum from a recent low to a new high. Historically, this specific pattern has preceded further gains, with a particularly strong track record over the subsequent three months. This signal often acts as a tailwind for the broader market as well.