Products
SentimenTrader Trading Tools
‍
Backtest Engine
My Trading Toolkit
Correlation Analysis
Seasonality
Market Prediction
Indicators & Data API
‍
Proprietary Indicators & Charts
Market Data API
Strategies & Scanner
‍
50+ Trading Strategies
Smart Stock Scanner
Smart Option Scanner
Research Reports
‍
Research Solutions
Reports Library
Free Resources
Simple Backtest Calculator
Simple Seasonality Calculator
The Kelly Criterion Calculator
Sentiment Geo Map
Public Research Reports
Education
Sentiment Indicators
Technical Indicators
Pricing
Company
About
In the News
Testimonials
Client Success Stories
Contact
Log inLoginSign up
< BACK TO ALL REPORTS

The Russell 2000 small-cap index formed a top pattern

Dean Christians
2025-02-25
The Russell 2000 completed a topping pattern when it reversed from a 2-year high to a 5-month low but not a 12-month low. Comparable breakdowns saw the small-cap index struggle in the near term. Over longer timeframes, the outlook showed uninspiring results.

Key points:

  • After reaching a two-year high, the Russell 2000 closed at a five-month low but not a 12-month low
  • Similar breakdowns led to near-term downside follow-through and muted long-term prospects
  • The Russell's breakdown carried over to the S&P 500, which also showed near-term vulnerability

What are the economically sensitive small-cap stocks signaling?

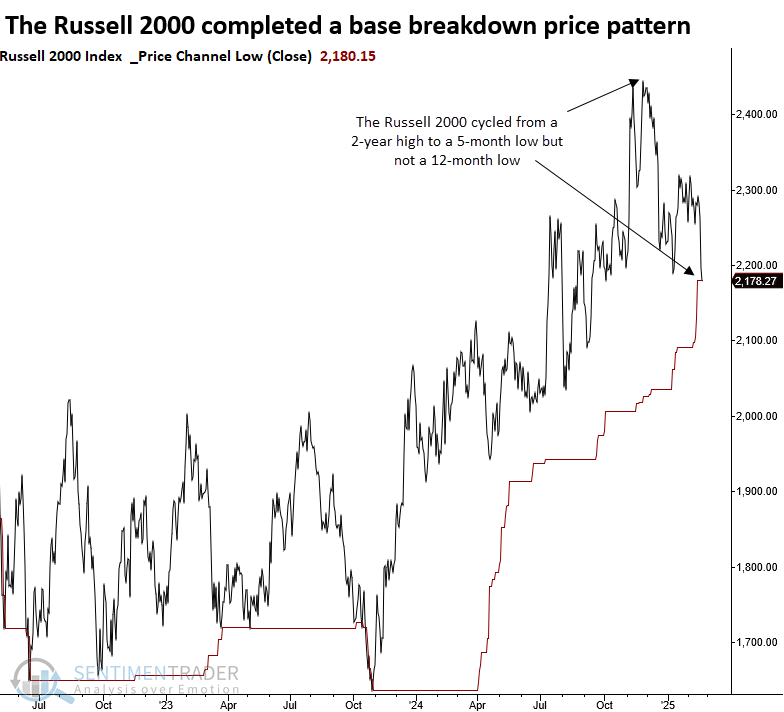
After reaching a multi-year high, the Russell 2000's breakout proved short-lived as the index reversed lower, closing at a five-month low while avoiding a 12-month low. This price action aligns with a base breakdown pattern, which some technical analysts may interpret as a failed breakout.

While the initial decline in the small-cap index coincided with a sharp rise in the 10-year Treasury yield, it's notable that the latest downturn occurred as the 10-year benchmark fell-a scenario that would typically favor small caps unless the drop in yields signals economic weakness.

The previous instance occurred in January 2022, a less-than-ideal time to hold stocks across any market capitalization. 

Similar breakdown patterns preceded negative returns in the near term

Whenever the Russell 2000 closed at a 5-month low, but not a 12-month low, and it was the first instance following a 2-year high, the small-cap index tended to see downside follow-through over the next few weeks. Although the outlook improved over medium and long-term horizons, it was uninspiring.

Risk exceeded reward across all time horizons except for the 12-month window, which only managed a slight positive skew. 

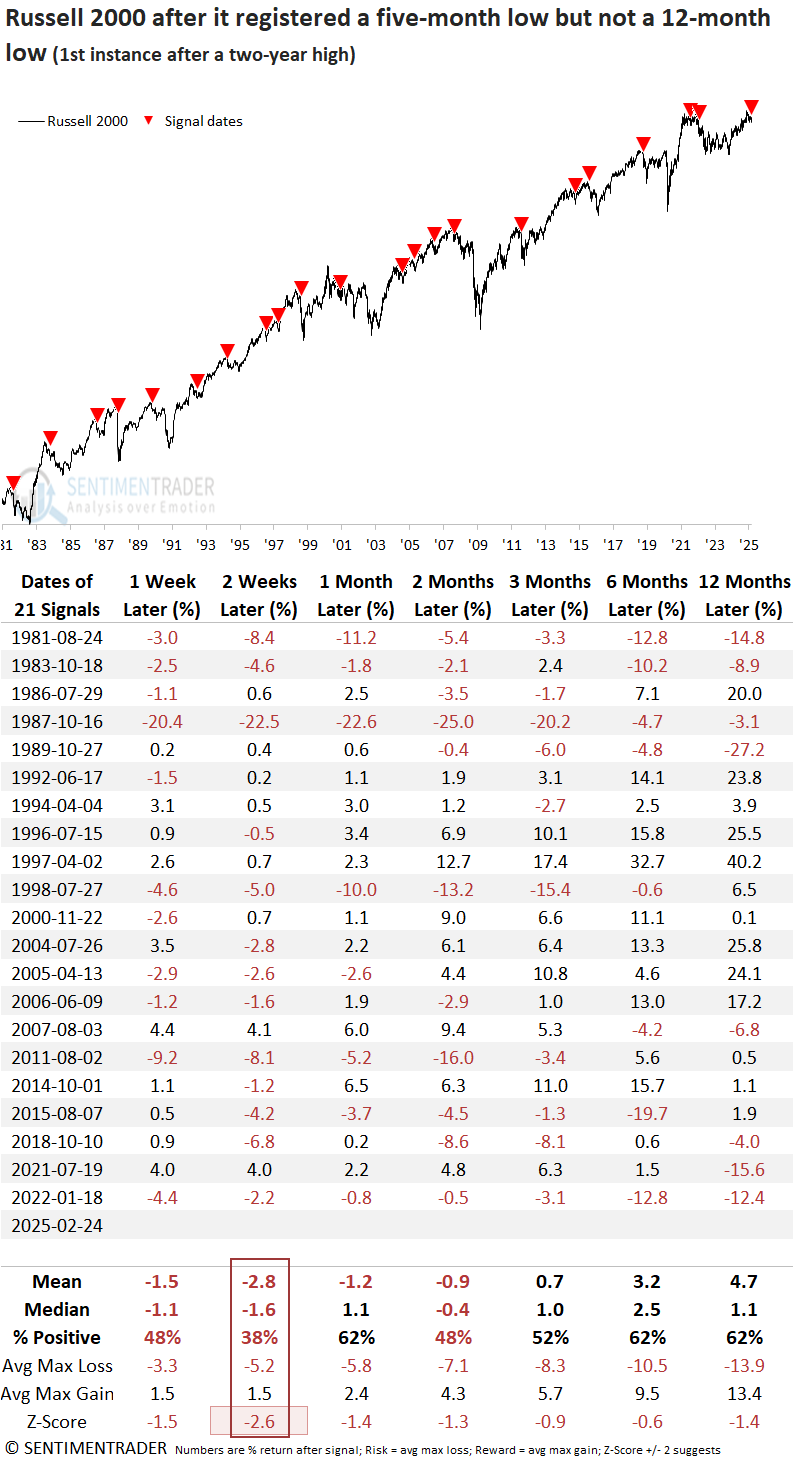
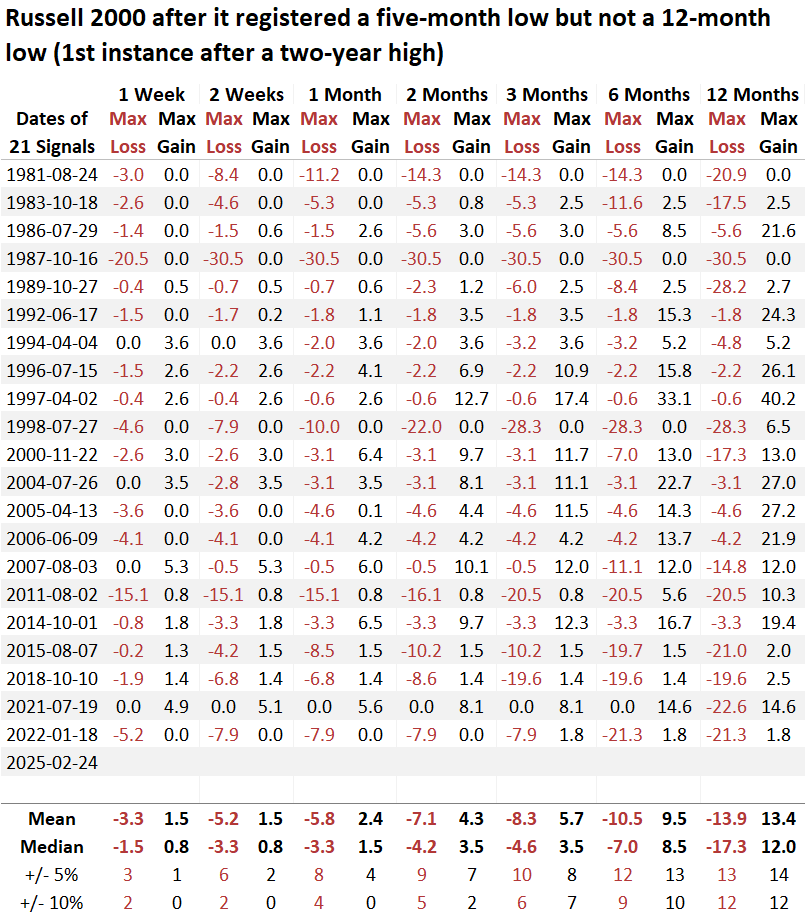
Nearly half of the historical cases experienced a maximum loss exceeding 10% within the first six months, emphasizing the need for prudent risk management. 

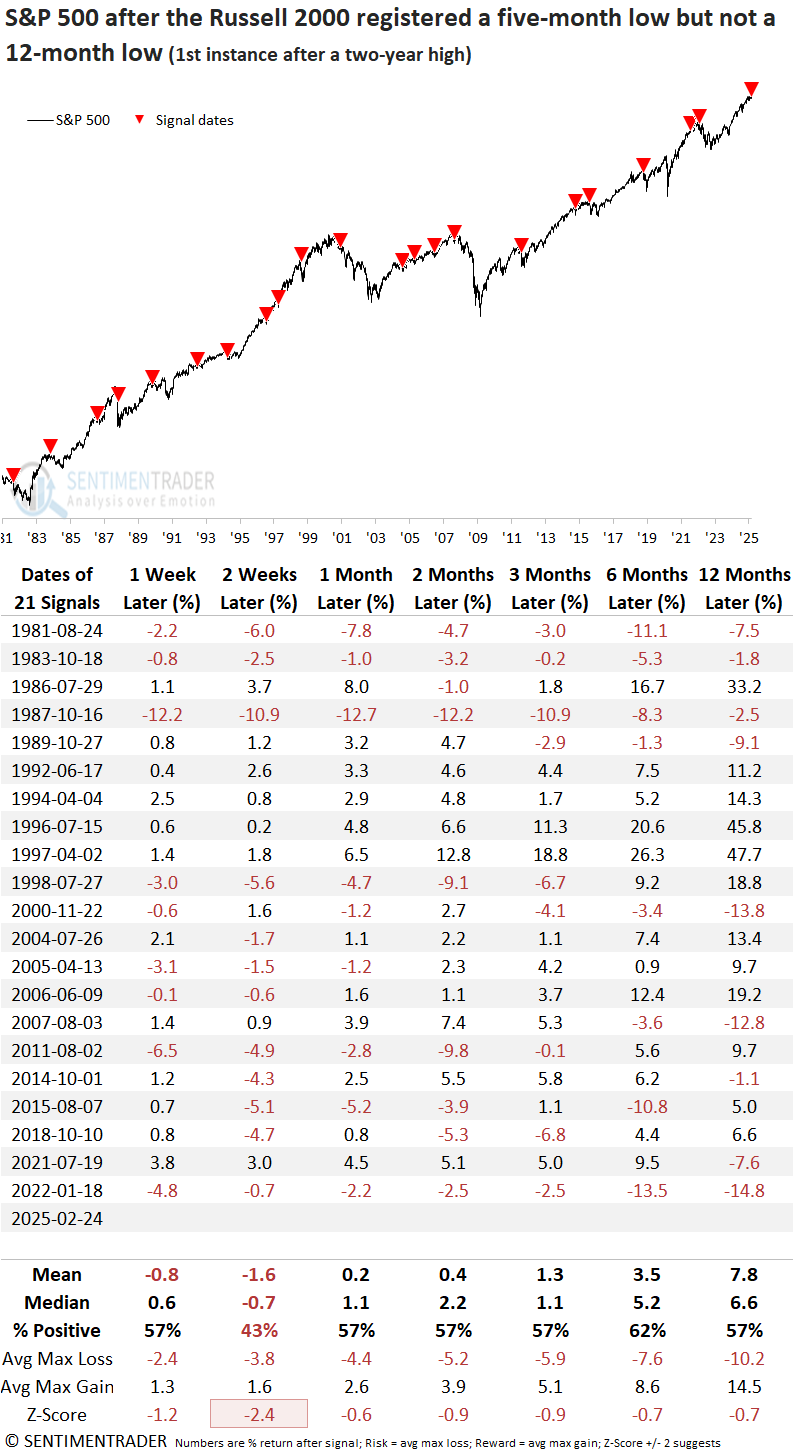
If the signals are applied to the S&P 500, it's clear that whatever affected small-cap stocks also created issues for large-caps, as the world's most benchmarked index struggled in initial weeks and posted rather uninspiring returns over a longer horizon.

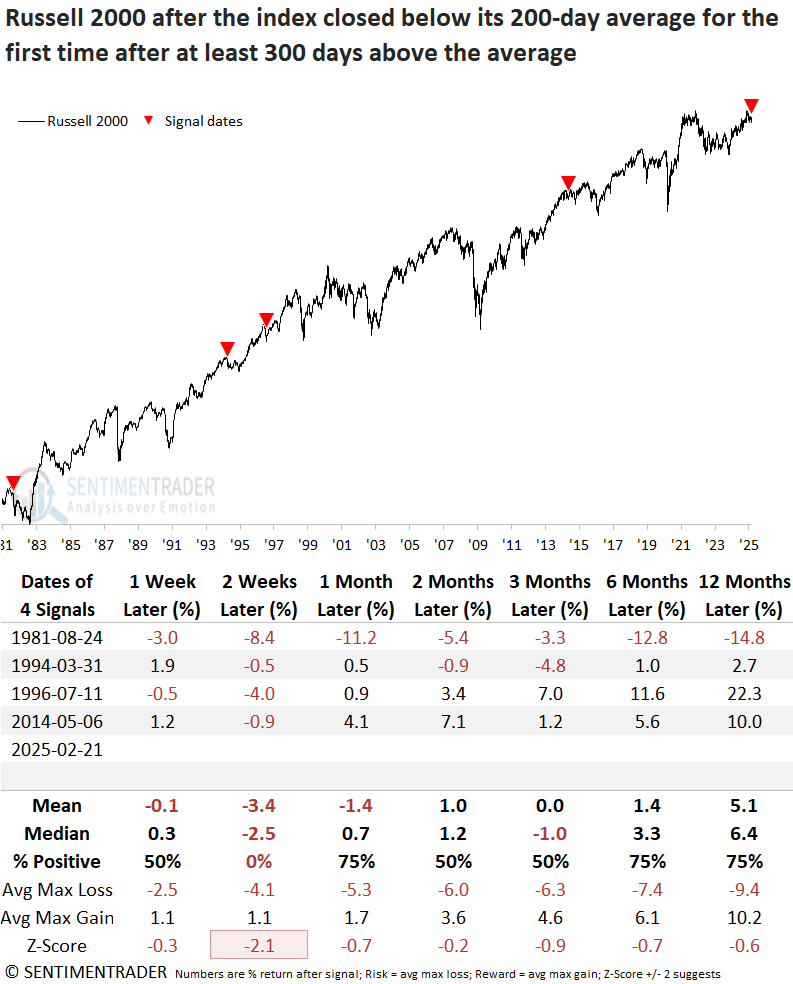
A long-term trend shift

Although the sample size is tiny, the Russell 2000's first close below its 200-day average, following a minimum 300-day streak above it, has historically signaled continued downward momentum over the subsequent two weeks, aligning with price pattern breakdown analysis. 

What the research tells us...

The Russell 2000, a small-cap stock index, closed at its lowest point in five months, though it avoided recording a 12-month low. This price trend shift marks the first instance after a two-year high, completing a topping pattern. Similar breakdowns suggest continued downside momentum in the small-cap index over the near term. Furthermore, returns and consistency were subpar over longer time horizons. The adverse price action extended to the S&P 500, possibly hinting at a broader macroeconomic influence. Given small-caps' sensitivity to the business cycle, one might question what, if anything, this breakdown indicates.

PRODUCTS
SentimenTrader
Trading Tools
Indicators & Data API
‍
Strategies & Scanner
‍
Research Reports
FREE
RESOUrCES
Simple Backtest
Calculator
Simple Seasonality
Calculator
The Kelly Criterion
Calculator
Sentiment Geo Map
‍
Public Research Reports
‍
Education
Sentiment Indicators
‍
Technical Indicators
‍
Pricing
Bundle pricing
‍
FAQ
‍
Announcements
‍
COMPANY
‍
About
‍
In the News
‍
Testimonials
‍
Client Success Stories
CONTACT
‍
General Inquiries
‍
Media Inquiries
‍
Financial Professionals Inquiries
‍
© 2026 Sundial Capital Research Inc. All rights reserved.
Setsail Marketing
TermsPrivacyAffiliate Program
Risk Disclosure: The information and tools provided are for research and analytical purposes only and are not intended as investment advice. Market analysis involves uncertainty, and outcomes may differ from expectations. Users should conduct their own due diligence and consider their individual circumstances before making any financial decisions. Past performance is not necessarily indicative of future results.

Hypothetical Performance Disclosure: Hypothetical performance results have many inherent limitations, some of which are described below. No representation is being made that any account will or is likely to achieve profits or losses similar to those shown; in fact, there are frequently sharp differences between hypothetical performance results and the actual results subsequently achieved by any particular trading program. One of the limitations of hypothetical performance results is that they are generally prepared with the benefit of hindsight. In addition, hypothetical trading does not involve financial risk, and no hypothetical trading record can completely account for the impact of financial risk of actual trading. for example, the ability to withstand losses or to adhere to a particular trading program in spite of trading losses are material points which can also adversely affect actual trading results. There are numerous other factors related to the markets in general or to the implementation of any specific trading program which cannot be fully accounted for in the preparation of hypothetical performance results and all which can adversely affect trading results.

Testimonial Disclosure: Testimonials appearing on this website may not be representative of other clients or customers and is not a guarantee of future performance or success.