
The Russell 2000 makes it 200 days above average

Key points:
- The Russell 2000 has lasted 200 sessions above its 200-day moving average
- This is only the 16th time it levitated this long above average in the past 45 years
- It's an index less prone to trend-following success, with subpar returns after other bouts of momentum
A milestone achievement
At the start of December 2023, the small-cap Russell 2000 finally closed above its 200-day moving average. For many, this was the first real sign of a potential long-term trend change, as buying an asset below its 200-day average has long been a no-no.
As long as they've stuck it out through the short-term wiggles, it's worked out for those investors. Since it poked above its average, it hasn't closed below.
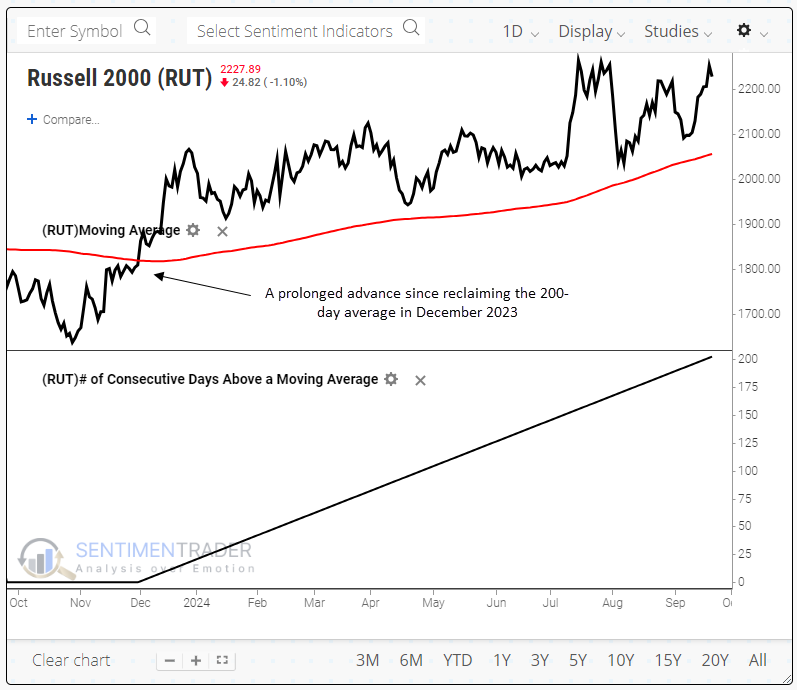
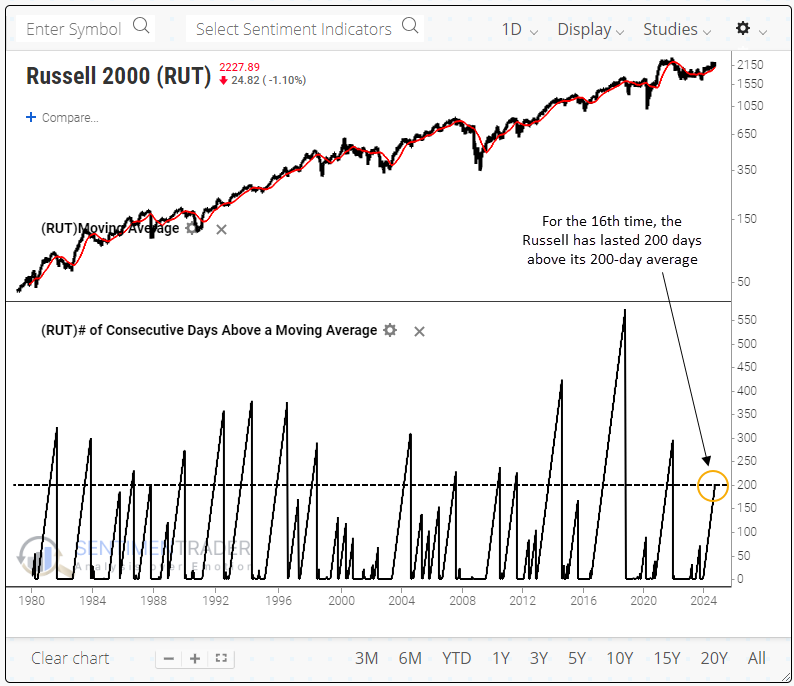
That means the Russell just celebrated its 200th consecutive session above its 200-day average. It's a relatively rare achievement for this particular index, as it's only the 16th such streak in the past 45 years.
Struggles to hold momentum
Some equity indexes aren't as prone to trend-following as others. The Russell is one of those indexes.
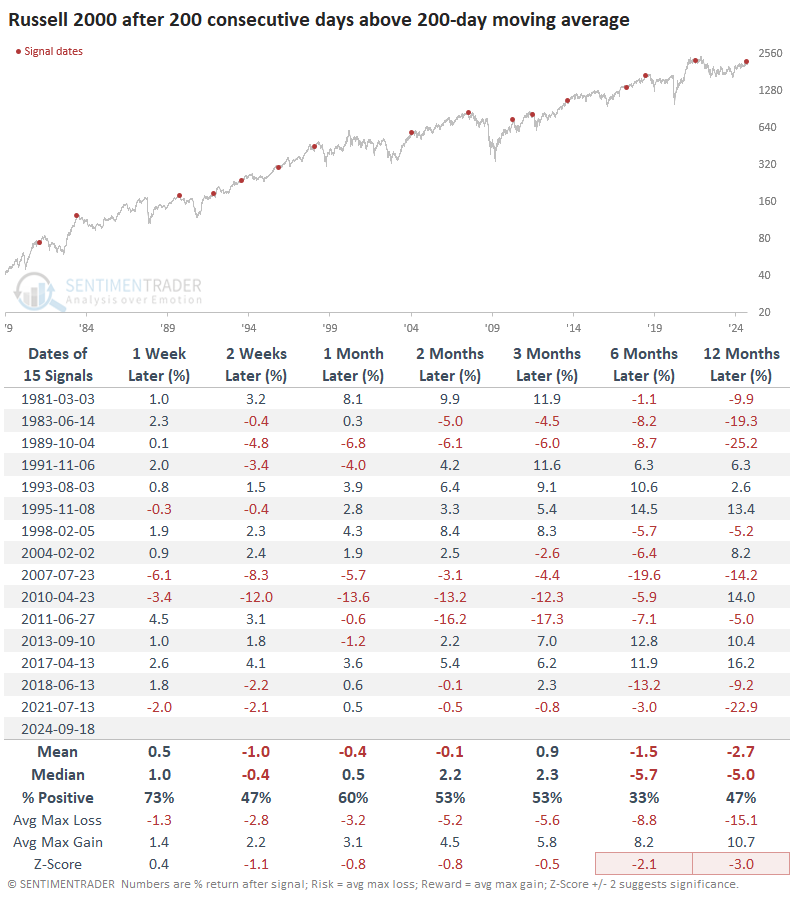
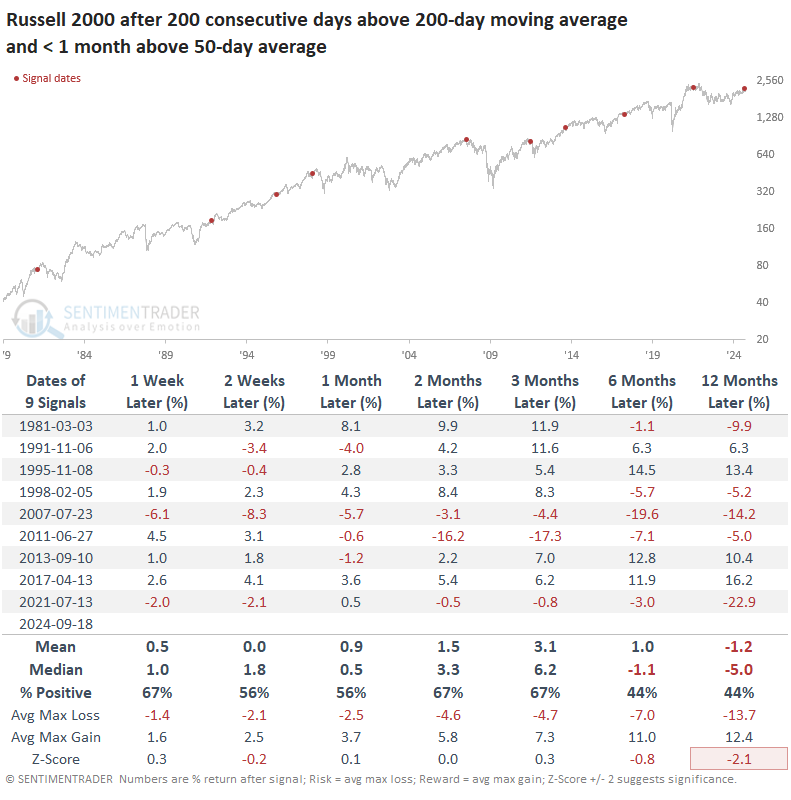
Below, we can see the index's future returns once it reaches the milestone of 200 days above its 200-day average. Up to three months later, its returns weren't horrible, but they certainly weren't great. They were below random across almost every time frame, and the risk-reward was about even. That changed for the worse over the 6-12 month time frames.
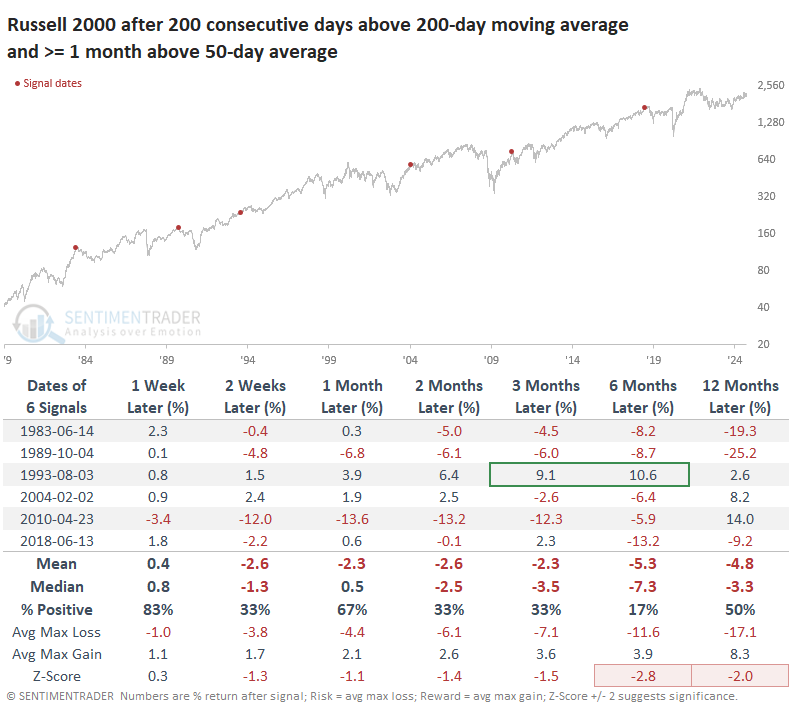
The problem with some of the more consistent losses, to some extent, was that the Russell 2000 had been levitating for a long time above its 200-day average and its 50-day average. The table below filters the signals to those times when it had been above its 200-day for 200 sessions and above its 50-day for at least a month. There was only one signal when it showed gains three or six months later.
That's not the case now, though. The Russell only poked above its 50-day average a few days ago. When we look at those signals, returns were better. Many of the losses over the next few months were erased or mitigated. There were two severe drawdowns out of the nine signals up to three months later, though longer-term returns were still poor.
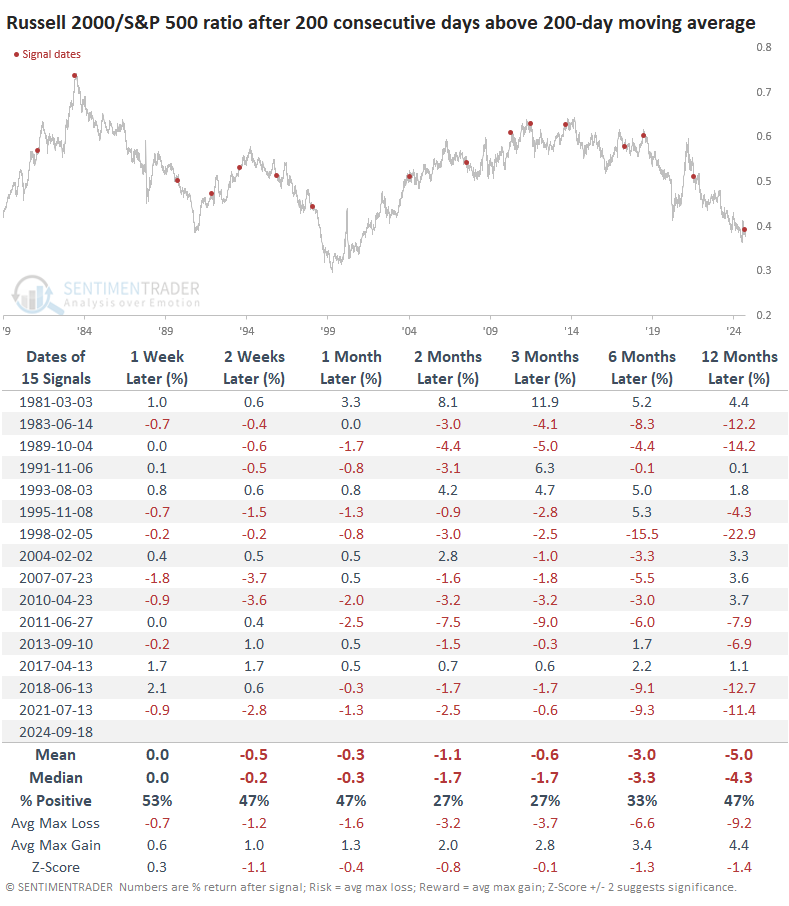
There is hope that a resurgence in small-caps means it will finally be time for them to shine relative to the S&P 500. It's hard not to sympathize with that sentiment because it's been a long time since they've asserted dominance.
However, these bouts of protracted levitation above the 200-day average were not great signals of a relative resurgence. Over the next 2-3 months, the Russell outperformed the S&P only 27% of the time. And almost all of those bouts of outperformance lost their luster in subsequent months.
A decile analysis of Russell 2000 returns based on its distance from its 200-day moving average shows when we should most worry about its future returns.
The chart below shows the Russell's annualized returns based on the percentage the index is from its average. We can see three clear regimes - below -3.6% (oversold), above +4.3% (positive momentum), and in-between (the mushy middle).
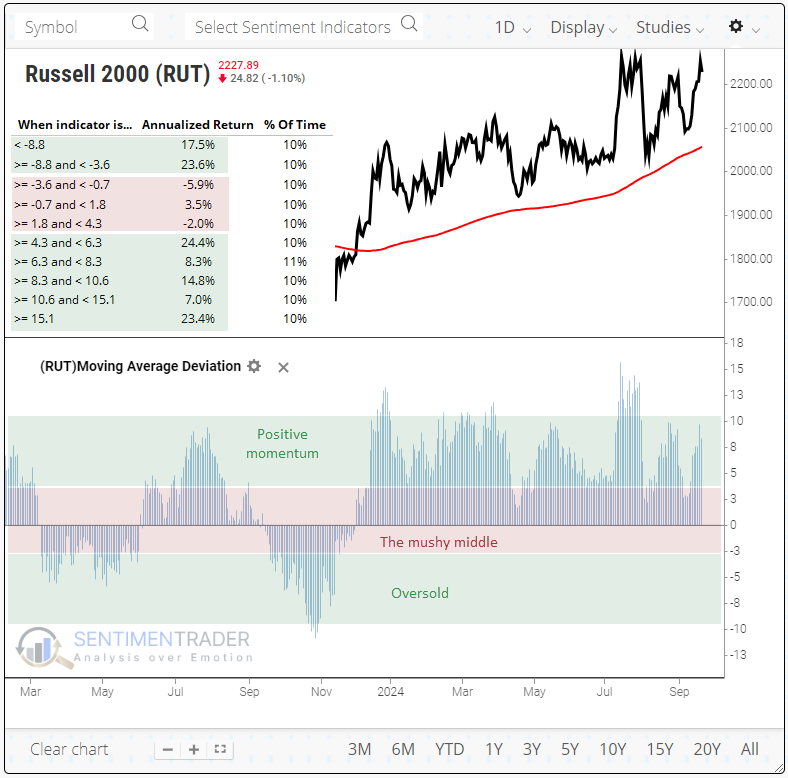
The positive numbers, even when the Russell is far above its 200-day, are thanks to a few bursts of rapid gains, usually when it's emerging from a protracted bear market.
These returns suggest that the dangerous part for investors will be when the 200-day average catches up to the index, it starts to flatten out, and the positive momentum evaporates. That's when this index tends to enter a long period of chop, at best.
What the research tells us...
Many signs indicate that small-cap investors have suffered historic frustration relative to those overweight larger-cap stocks. The trouble is that almost all those signs have a poor record of pinpointing turning points. Even bouts of positive momentum in smaller stocks have been poor at indicating times of future outperformance and, unfortunately, even positive absolute returns.
The fact that medium-term momentum isn't as extended is a relatively good sign for a while, anyway. When it starts to flatten out and retreat closer to its 200-day average, it has a poor history of providing investors with positive returns.